The deck is a short March 2020 update from WeWork's parent, The We Company, prepared during the early COVID-19 period. It opens with a title slide and then a forward-looking statement that withdraws earlier 2020 targets. A disclaimer slide follows, covering forward-looking statements, third-party data and non-GAAP measures. The main content sections are the leadership team, a three-stage strategy (short, mid and long term) and the five-year targets for 2024. The closing slide shows pro forma cash and cash commitments as a waterfall chart, tied to SoftBank financing that is subject to conditions. The strongest slides to study are the targets slide, which pairs four large headline metrics with footnoted definitions, and the liquidity waterfall, which shows how each source of cash adds or subtracts from the total.
Full text of the slides (7 slides)
Every slide's words and a description of its charts and images, so the deck can be searched and rebuilt. Also available as Markdown.
Slide 1
wework
WEWORK UPDATE
MARCH 26, 2020
© 2020 The We Company. Proprietary & Confidential.
Visuals: A logo: the lowercase wework wordmark in a dark charcoal custom serif, set in one line, horizontally centred, about 55 percent of slide width. No photograph, chart, or other icon.
Slide 2
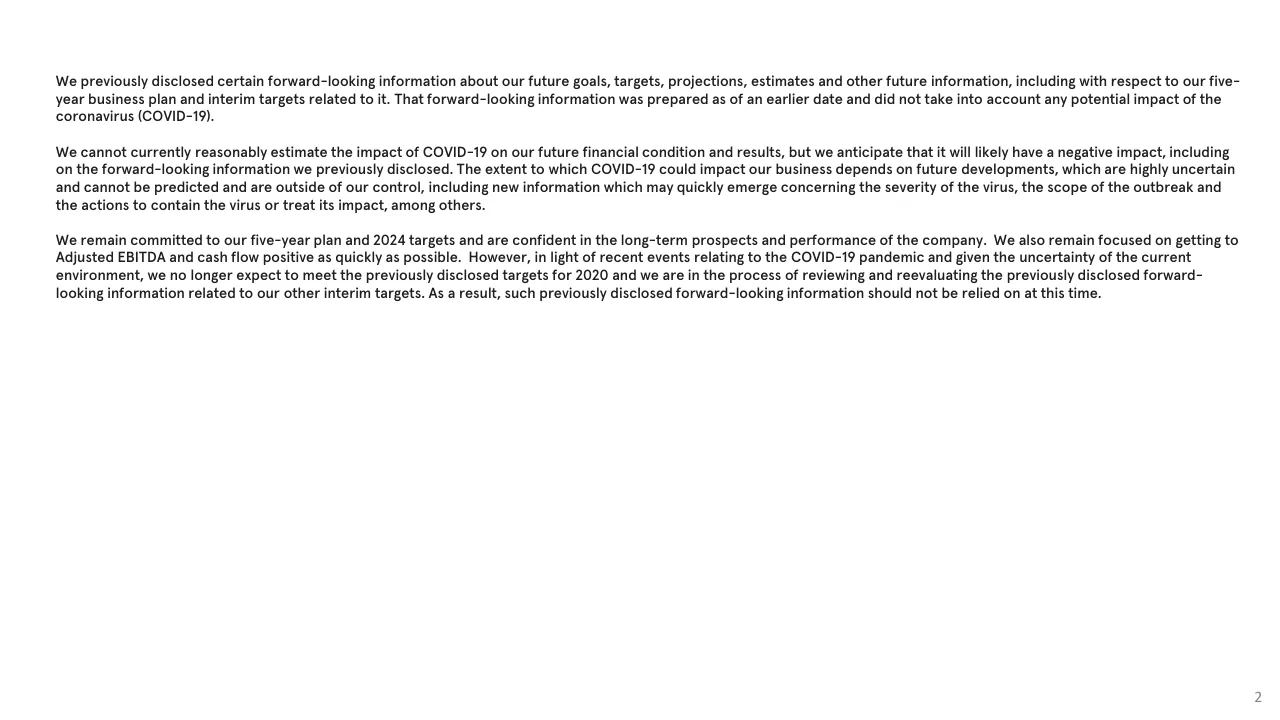
We previously disclosed certain forward-looking information about our future goals, targets, projections, estimates and other future information, including with respect to our five-
year business plan and interim targets related to it. That forward-looking information was prepared as of an earlier date and did not take into account any potential impact of the
coronavirus (COVID-19).
We cannot currently reasonably estimate the impact of COVID-19 on our future financial condition and results, but we anticipate that it will likely have a negative impact, including
on the forward-looking information we previously disclosed. The extent to which COVID-19 could impact our business depends on future developments, which are highly uncertain
and cannot be predicted and are outside of our control, including new information which may quickly emerge concerning the severity of the virus, the scope of the outbreak and
the actions to contain the virus or treat its impact, among others.
We remain committed to our five-year plan and 2024 targets and are confident in the long-term prospects and performance of the company. We also remain focused on getting to
Adjusted EBITDA and cash flow positive as quickly as possible. However, in light of recent events relating to the COVID-19 pandemic and given the uncertainty of the current
environment, we no longer expect to meet the previously disclosed targets for 2020 and we are in the process of reviewing and reevaluating the previously disclosed forward-
looking information related to our other interim targets. As a result, such previously disclosed forward-looking information should not be relied on at this time.
2
Slide 3
This presentation supersedes and supplements any prior presentation and any oral or written communication with respect to our company and its business.
This presentation contains “forward-looking statements”, including statements about estimated and projected business, operational and financial metrics (including profitability, liquidity and cash flow), plans (including our five-year strategic and financial plan), goals, targets, objectives and other information for future or recently completed periods. These statements are often, but not always, made through the use of words or phrases such as “may”, “should”, “could”, “predict”, “potential”, “believe”, “will likely result”, “expect”, “continue”, “will”, “anticipate”, “become”, “seek”, “estimate”, “intend”, “aim,” “plan”, “projection”, “would,” “outlook” and “goal”, or the negative version of those words or phrases or other comparable words or phrases of a future or forward-looking nature. These forward-looking statements are not historical facts, and are based on current expectations, estimates and projections about our industry as well as certain assumptions made by management, many of which, by their nature, are inherently uncertain and beyond our control. It is not possible for us to predict all risks, nor can we assess the impact of all factors on our business or the extent to which any factor, or combination of factors, may cause actual results to differ materially from those contained in any forward-looking statements we may make. In light of these risks, uncertainties and assumptions, the future events, estimates, projections, goals, targets, plans and trends discussed in this presentation, and our future levels of activity and performance, may not occur and actual results could differ materially and adversely from those anticipated or implied in the forward-looking statements. Any forward-looking statement speaks only as of the date on which it is made, and we do not undertake any obligation to publicly update or revise any forward-looking statement, whether as a result of new information, future developments or otherwise, except as required by law.
This presentation contains information concerning our solutions and our industry, including market size and growth rates of the markets in which we participate, that are based on industry surveys and publications or other publicly available information, other third-party survey data and research reports commissioned by us and our internal sources. This information involves many assumptions and limitations, and you are cautioned not to give undue weight to this information. We have not independently verified this third-party information. Similarly, other third-party survey data and research reports commissioned by us, while believed by us to be reliable, are based on limited sample sizes and have not been independently verified by us. In addition, projections, assumptions, estimates, goals, targets, plans and trends of the future performance of the industry in which we operate, and our future performance, are necessarily subject to uncertainty and risk due to a variety of factors, including those described above. These and other factors could cause results to differ materially from those expressed in the estimates made by independent parties and by us.
In addition, all projections, estimates, goals, targets, plans, trends or other statements with respect to our future results or future events, are based on current management estimates and assumptions (including, without limitation regarding average occupancy, estimated expenses, estimated revenues and satisfaction of financing condition), some of which may not materialize or may change, and are subject to risks and uncertainties over which we have no control or ability to predict. Unanticipated events may occur that could affect the outcome of such projections, estimates, goals, targets, plans, trends and other statements. You must make your own determinations as to the reasonableness of these projections, estimates, goals, targets, plans, trends and other statements and should also note that if one or more estimates change, or one or more assumptions are not met, or one or more unexpected events occur, the performance and results set forth in such projections, estimates, goals, targets, plans, trends and other statements may not be achieved. We can give no assurance as to its future operations, performance, results or events.
This presentation includes certain financial measures not presented in accordance with generally accepted accounting principles in the United States (“GAAP”), including Free Cash Flow and Adjusted EBITDA. These financial measures are not measures of financial performance in accordance with GAAP and may exclude items that are significant in understanding and assessing our financial results. Therefore, these measures should not be considered in isolation or as an alternative to net loss or other measures of profitability, liquidity or performance under GAAP. You should be aware that our presentation of these measures may not be comparable to similarly titled measures used by other companies, which may be defined and calculated differently.
The brands and logos included herein are the property of third-party owners and are used for informational purposes only. Such use should not be considered an endorsement of the third-party owner or its services and should not be considered an endorsement of our company and its services by the third-party owner.
3
Slide 4
Our Leadership Team
Sandeep Mathrani
Chief Executive Officer
Marcelo Claure
Executive Chairman
Kimberly Ross
Chief Financial Officer
Shyam Gidumal
COO, Americas
Eugen Miropolski
COO, International
Jen Berrent
Chief Legal Officer
Hamid Hashemi
Chief Product &
Experience Officer
Matt Jahansouz
Chief People Officer
Peter Greenspan
Head of Real Estate
Marissa Shorenstein
Chief Communications
Officer
Nick Worswick
Chief Sales Officer
Miguel Mckelvey
Co-founder &
Chief Culture Officer
Ken Watson
Chief Technology
Officer
Prabhdeep Singh
Global Head of
WeWork Labs
4
Visuals: Fourteen black-and-white circular head-and-shoulders portraits, one per person, cropped to circles and placed in three rows. Sandeep Mathrani: smiling man in a dark zip-neck pullover, pale blurred background with a leaf at left, centred framing. Marcelo Claure: smiling man in a dark jacket, near-black background, high contrast, slightly angled. Kimberly Ross: smiling woman with shoulder-length dark hair and dark blazer, white background, head small in the circle with the bottom of the torso visible. Shyam Gidumal: man with glasses speaking, white collared shirt, black backdrop. Eugen Miropolski: smiling man in dark blazer over black graphic t-shirt, background of dark vertical stripes. Jen Berrent: smiling woman with long dark hair, light grey background. Hamid Hashemi: smiling older man in white shirt and dark jacket, dark grey background; his image box is larger than the visible circle and the circle shows its centre. Matt Jahansouz: man with short hair in white open-necked shirt, pale blurred window background, slight smile. Peter Greenspan: man with glasses in white shirt, bright light background, upper body. Marissa Shorenstein: smiling woman with dark hair and dark top, light grey background. Nick Worswick: man with glasses and short hair, arms crossed, beige shirt, dark grey background. Miguel Mckelvey: bearded man in patterned dark shirt, blurred warm background. Ken Watson: smiling man in dark suit and white shirt, light grey background. Prabhdeep Singh: smiling bearded man in black turban and glasses, turned to the side, white background. All portraits are neutral-lit studio or office shots, shown in greyscale, with no overlay or tint and no borders.
Slide 5
Our Vision: provide space-as-a-service solutions where people & companies unite / as communities to move forward together
2020
2021
2022
2023
2024
1.0
Short-Term
Deliver our core space-as-a-service offering. / To achieve our goals, our immediate focus will be on optimizing / and right-sizing our existing portfolio.
1.5
Mid-Term
Increase our membership offerings and expand our footprint strategically. / These include global access to our community through a new enhanced / membership, customization of offices to include equipment, access to a network / that provides health benefits and payroll services, and an on-demand feature for / desks, offices and conference rooms available to all.
2.0
Long-Term
Transform into an end-to-end business solutions platform. / We will continue to add services and experiences that will allow our / members to have a better day at work, while helping them use their / most valuable commodity - time - in the most efficient way possible.
5
Visuals: Diagram: a horizontal timeline in dark slate #304957, about 0.4% of slide height thick, running from the left edge to the right edge and ending in a small filled arrowhead at the right. Five light grey circular markers (about #DCDCDC, roughly 2.5% wide and 4.4% tall) sit on the line centred at x about 5.6%, 24.4%, 43.3%, 61.9% and 80.7%, each with its year label above and to the right, labelled 2020, 2021, 2022, 2023 and 2024. Below, three right-pointing block arrows of the same design, stacked top to bottom, each with a flat fill and a straight shaft and a triangular head with sharp corners and no shadow: 1.0 Short-Term arrow in teal #408F9E (shaft from x about 5.4% to 22%, head tip near x 27.4%, y 32.1% to 53.9%); 1.5 Mid-Term arrow in dark slate #304957 (x 7.1% to 36.0%, y 54.0% to 75.9%); 2.0 Long-Term arrow in grey #616161 (x 5.6% to 44.7%, y 76.2% to 98.1%). Each arrow begins at a circular badge with a light grey #E0E0E0 outer ring about 8.2% wide and 14.7% tall, and an inner filled disc in the same colour as its arrow (teal #408F9E, slate #304957, grey #616161) carrying the number in cream #F6F2EC. No photographs, icons or logos.
Slide 6
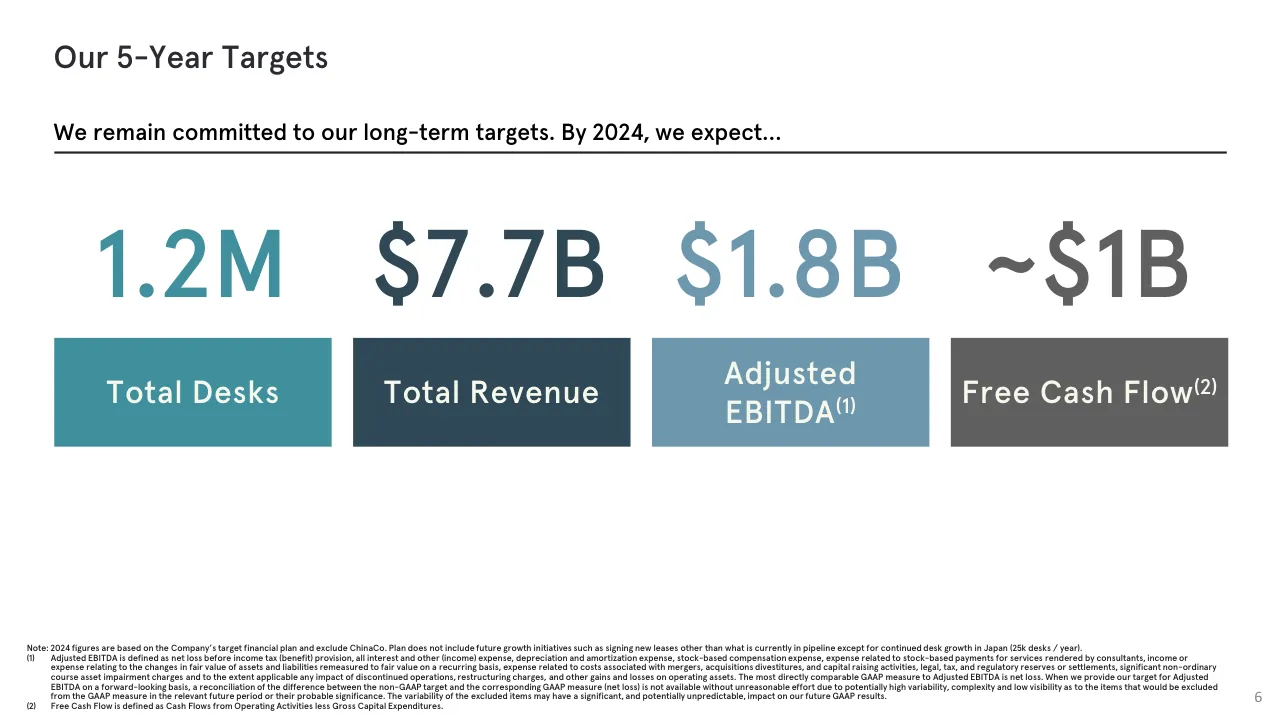
Our 5-Year Targets / We remain committed to our long-term targets. By 2024, we expect… / 1.2M / Total Desks / $7.7B / Total Revenue / $1.8B / Adjusted / EBITDA(1) / ~$1B / Free Cash Flow(2) / 6 / Note: 2024 figures are based on the Company’s target financial plan and exclude ChinaCo. Plan does not include future growth initiatives such as signing new leases other than what is currently in pipeline except for continued desk growth in Japan (25k desks / year). / (1) / Adjusted EBITDA is defined as net loss before income tax (benefit) provision, all interest and other (income) expense, depreciation and amortization expense, stock-based compensation expense, expense related to stock-based payments for services rendered by consultants, income or / expense relating to the changes in fair value of assets and liabilities remeasured to fair value on a recurring basis, expense related to costs associated with mergers, acquisitions divestitures, and capital raising activities, legal, tax, and regulatory reserves or settlements, significant non-ordinary / course asset impairment charges and to the extent applicable any impact of discontinued operations, restructuring charges, and other gains and losses on operating assets. The most directly comparable GAAP measure to Adjusted EBITDA is net loss. When we provide our target for Adjusted / EBITDA on a forward-looking basis, a reconciliation of the difference between the non-GAAP target and the corresponding GAAP measure (net loss) is not available without unreasonable effort due to potentially high variability, complexity and low visibility as to the items that would be excluded / from the GAAP measure in the relevant future period or their probable significance. The variability of the excluded items may have a significant, and potentially unpredictable, impact on our future GAAP results. / (2) / Free Cash Flow is defined as Cash Flows from Operating Activities less Gross Capital Expenditures.
Visuals: Four solid filled rectangular tiles arranged in a row, with no photographs, charts or icons. Tile 1 is teal #408F9E and holds the label Total Desks in white. Tile 2 is dark slate #304957 and holds the label Total Revenue in white. Tile 3 is light steel blue #6E98AF and holds the label Adjusted EBITDA(1) in white, set on two lines. Tile 4 is dark grey #616161 and holds the label Free Cash Flow(2) in white. Above each tile is a large figure in the same colour as its tile: 1.2M in teal #408F9E, $7.7B in slate #304957, $1.8B in steel blue #6E98AF, and ~$1B in grey #616161. The tiles are square-cornered with no shadow and no gradient, and no overlap with other elements.
Slide 7
Our Liquidity
Pro Forma Cash and Cash Commitments
($ in billions)
$1.1
$5.5
$2.2
$4.4
$0.8
$0.1
$1.3
Available Cash
12/31/19(1)
Capital Commitments
to JapanCo(2)
Release of
Unrestricted Cash(3)
SoftBank Unsecured
Financing Commitments(4)
Pro Forma Cash &
Cash Commitments
SoftBank Secured
Financing Commitments(5)
Pro Forma Cash &
Cash Commitments
7
Note: SoftBank financing subject to regulatory approvals and other closing conditions.
(1) Cash excludes restricted cash and includes SoftBank Warrant proceeds received on October 30, 2019.
(2) Additional existing $100M related to additional commitments from SoftBank to PacificCodue in Oct. ’20 may be terminated as part of the JV roll-up contemplated under the SoftBank transaction.
(3) Represents release of unrestricted cash associated with the closing of the $1.75 billion LC facility. Majority was released simultaneously with closing of LC Facility. Remaining $80M to come in during end of February 2020 / beginning of March 2020.
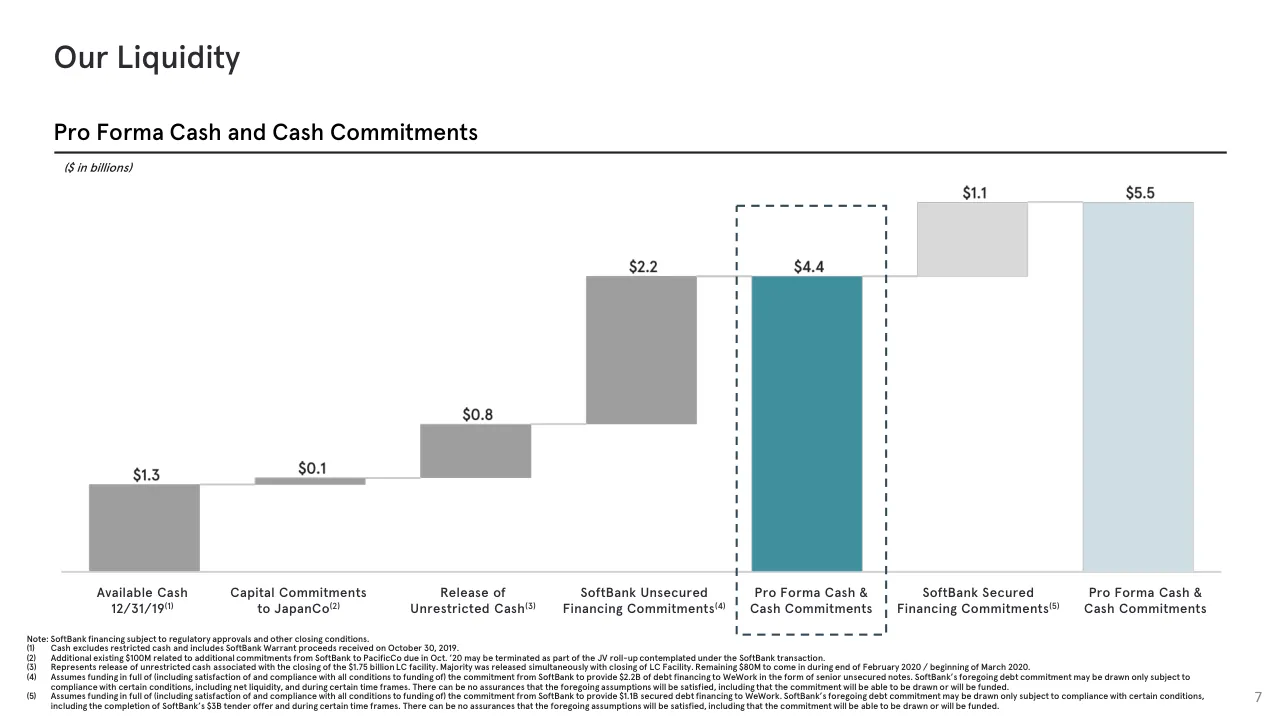
(4) Assumes funding in full of (including satisfaction of and compliance with all conditions to funding of) the commitment from SoftBank to provide $2.2B of debt financing to WeWork in the form of senior unsecured notes. SoftBank’s foregoing debt commitment may be drawn only subject to
compliance with certain conditions, including net liquidity, and during certain time frames. There can be no assurances that the foregoing assumptions will be satisfied, including that the commitment will be able to be drawn or will be funded.
(5) Assumes funding in full of (including satisfaction of and compliance with all conditions to funding of) the commitment from SoftBank to provide $1.1B secured debt financing to WeWork. SoftBank’s foregoing debt commitment may be drawn only subject to compliance with certain conditions,
including the completion of SoftBank’s $3B tender offer and during certain time frames. There can be no assurances that the foregoing assumptions will be satisfied, including that the commitment will be able to be drawn or will be funded.
Visuals: Waterfall chart (floating columns, no y-axis, no gridlines, no legend, values printed above each column in dark sans-serif, units stated in the subtitle as $ in billions). Columns from left to right: Available Cash 12/31/19(1) $1.3, grey #9E9E9E, bottom at baseline, top at about 1.3; Capital Commitments to JapanCo(2) $0.1, grey #9E9E9E, thin floating column; Release of Unrestricted Cash(3) $0.8, grey #9E9E9E, floating from about 1.4 to 2.2; SoftBank Unsecured Financing Commitments(4) $2.2, grey #9E9E9E, floating from about 2.2 to 4.4; Pro Forma Cash & Cash Commitments $4.4, teal #3F8E9B, from baseline to 4.4, highlighted by dashed box; SoftBank Secured Financing Commitments(5) $1.1, light grey #D6D6D6, floating from about 4.4 to 5.5; Pro Forma Cash & Cash Commitments $5.5, pale blue #D0DFE6, from baseline to 5.5. Thin light grey connector lines run horizontally between column tops. Column bar widths are equal. Baseline is a light grey horizontal line. The dashed highlight rectangle is dark slate #2E4A5A, stroke about 0.2% of slide width, with dash segments, enclosing the teal column and its label extending from above the $4.4 label to below the category label.