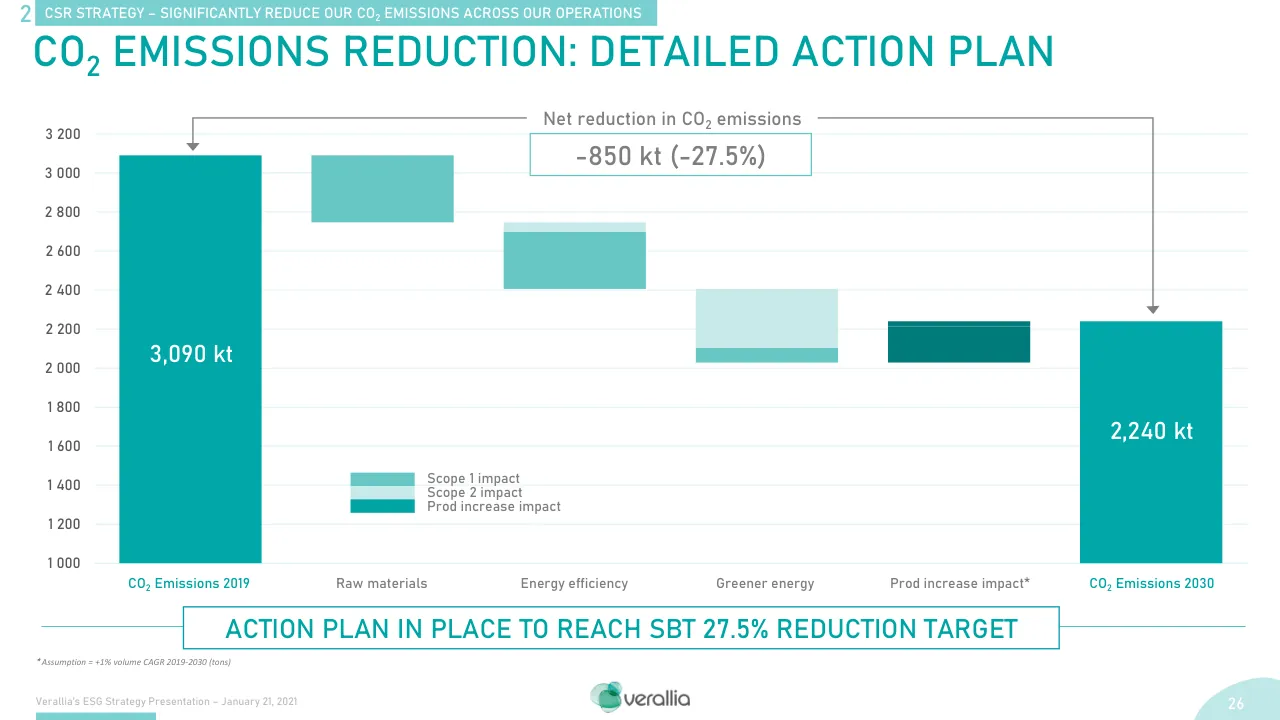
The deck opens with a title slide and an agenda naming the presenting executives, then introduces Verallia as a global glass packaging maker, covering its end-market split, footprint, values and purpose. It moves through a materiality exercise and the company's membership in the Ellen MacArthur Foundation. The main body covers the three CSR pillars in order: enhancing the circularity of glass packaging (cullet collection, recycling capacity and furnace use, plus reuse), significantly reducing CO2 emissions (the 2030 target, the levers to reach it, green electricity, lightweighting and tree planting), and providing a safe and inclusive workplace (accident frequency, diversity, employee shareholding and community support). Governance follows, covering board composition, committees, ESG oversight, executive pay, compliance, whistleblowing and responsible purchasing. The deck closes with a conclusion summarizing the ESG ambition and ratings, then a Q&A slide and appendices with the goal tables and historical data. Slides that show the approach well include the CO2 reduction action plan waterfall, the green electricity target chart and the safety roadmap maturity ladder.
Slides worth studying
Questions about this deck
How many slides does Verallia's ESG Strategy Presentation from January 21, 2021 have?
The deck has 55 pages in total, as shown in its slide count. The title slide is slide 1 and the agenda appears on slide 3.
What CO2 emissions reduction target does Verallia set for 2030 in its ESG strategy presentation?
Verallia's goal is to reduce absolute CO2 emissions by 27.5% by 2030 vs 2019, in line with Science-Based Targets (slide 22). The slide shows scopes 1 and 2 emissions falling from 3,090 k in 2019 to 2,240 k in 2030 (slide 22).
What does Verallia's ESG strategy presentation say about external cullet usage targets?
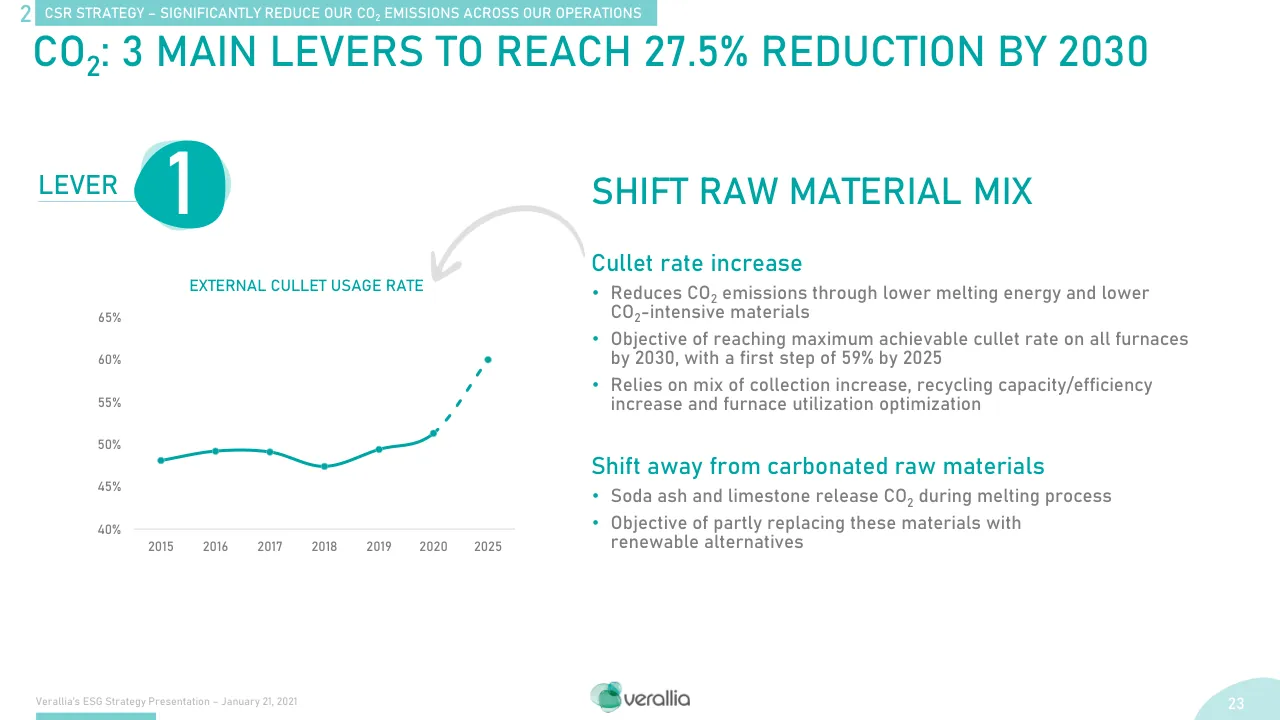
The rate of external cullet usage in Verallia's glass production sites was 49% in 2019, with a 2025 target of 59% (slide 14). The goal is to increase the rate of use of external cullet by 10 pts vs 2019 (slide 14).
How is Verallia's ESG strategy presentation structured?
The agenda on slide 3 lists five sections: Introduction, CSR Strategy: 3 Main Pillars, Governance, and Conclusion. The CSR strategy section covers three pillars: enhancing the circularity of glass packaging, significantly reducing CO2 emissions across operations, and providing a safe and inclusive place of work (slide 11).
Details
- Company: Verallia
- Year: 2021
- Type: Strategy presentation
- Industry: Glass packaging
- Pages: 55
Review score: 7 out of 10, Effective
Presentation quality, judged with the SlideDeck Co review heuristic. Ask, evidence and idea merit are not rated here.
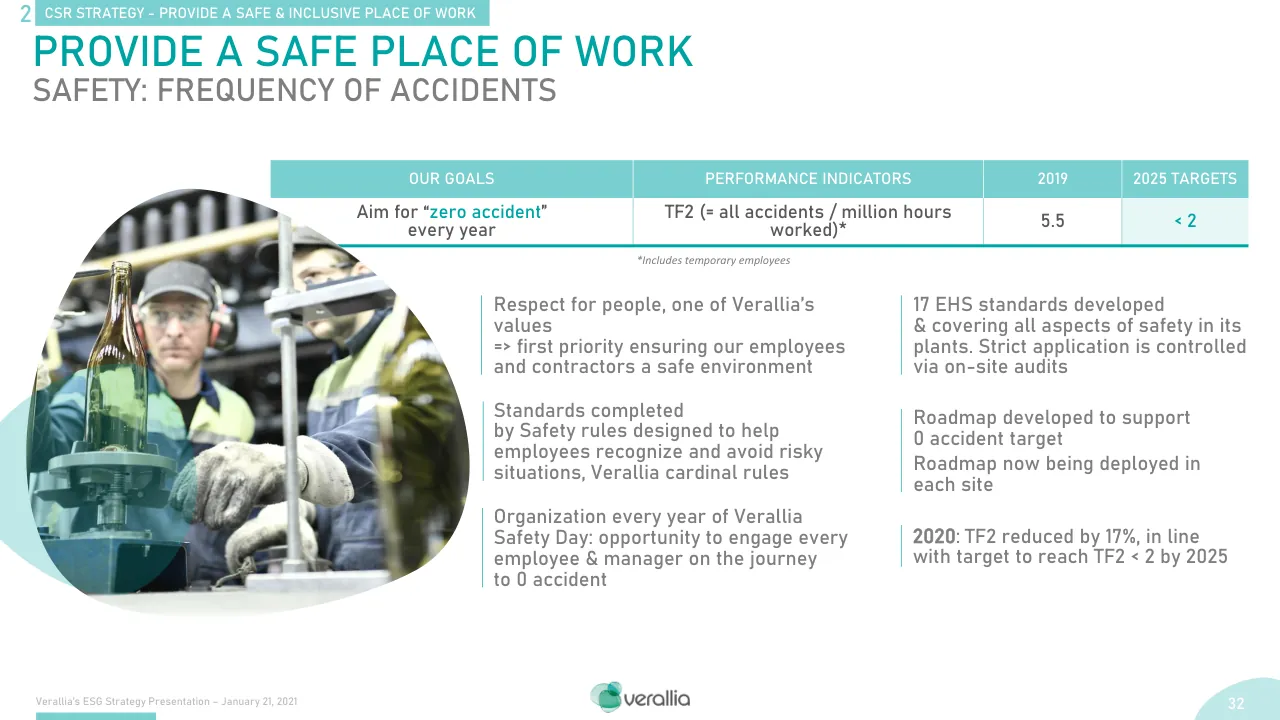
The deck has a clear route: an agenda that is repeated as a tracker (slides 2, 3, 10, 39, 48), consistent section tags, and three pillars each opened by a photo divider and followed by goal tables with 2019 baselines and 2025 targets. Visual identity is coherent and polished, and slides 26 and 23 show strong chart craft with readable headline numbers. The weaknesses are density and legibility: many pages (7, 15, 16, 18, 41, 45, 47) carry small body text and footnotes that cannot be read in a room, and several are walls of bullets or maps with little hierarchy. Slide 8 is blank, slide 2 shows 'GENDA' with the A cropped, and slides 3 and 10 repeat the agenda tracker without adding content.
Worth keeping: Keep the agenda tracker with presenter photos, the goal-and-indicator table header used on slides 14, 22, 29, 32 and 35, the waterfall on slide 26 with its single takeaway box, and the lever 1/2/3 structure on slides 23 to 25.
Most useful repair: Fix the blank slide 8 and the clipped 'GENDA' title, and enlarge or cut the small text on slides 7, 15, 16, 18, 41, 45 and 47.
What would change the score: I would split or reduce the densest case-study and governance slides to one message each and give the action titles on pages like 13, 42 and 43 a stated conclusion instead of a topic label.
Confidence medium. 55 of 55 pages inspected on contact sheets, 4 at readable size. Reviewed 2026-11-08. Model-assisted review (claude-sonnet-5-5).
Full text of the slides (55 slides)
Every slide's words and a description of its charts and images, so the deck can be searched and rebuilt. Also available as Markdown.
Slide 1
ESG STRATEGY PRESENTATION
MICHEL GIANNUZZI
Chairman & CEO
January 21, 2021
verallia
Visuals: A photograph of a glass bottling line: a row of dark green and olive wine bottles standing upright on a stainless steel conveyor ring, seen from a low angle. The bottles recede to the right and their necks are cut off at the top of the frame. A blurred yellow and white background sits at upper right. Lighting is soft, natural and even, with specular highlights on the glass. The dominant colours are dark olive green, grey steel and muted teal. The photo is shown inside a white margin rather than edge to edge. Three large teal (#01A5A5) translucent organic curved shapes overlay it: one covering the upper left, one covering the lower right, and one at upper left over the bottles. A translucent teal rectangle sits behind the presenter name. A white horizontal rule runs on each side of the name. The verallia logo appears at bottom centre: a stylised green and teal leaf-like mark with the lowercase white wordmark 'verallia'.
Slide 2
GENDA / INTRODUCTION / CSR STRATEGY: 3 MAIN PILLARS / GOVERNANCE / CONCLUSION / Michel GIANNUZZI / CEO / Laetitia FABRE / Head of CSR / Romain BARRAL / Director of Operations / Denis MICHEL / Secretary General / Wendy KOOL-FOULON / General Counsel / Michel GIANNUZZI / CEO / Verallia’s ESG Strategy Presentation – January 21, 2021 / 2
Visuals: Four blob-framed pictures, one per column. Column 1 (INTRODUCTION): a photograph of green, olive and amber wine and beer bottles and glass jars standing in a row on white, lit evenly from the front, cropped to an organic oval-triangle window. Column 2 (CSR STRATEGY: 3 MAIN PILLARS): a split photograph, left half an orange-lit glass bottle with a white thread loop, right half a tree trunk with green ivy leaves, divided by a vertical seam. Column 3 (GOVERNANCE): a flat illustration of a ring of stylised hands in yellow, teal, olive, orange and dark blue-grey, meeting at the centre in a circular arrangement on white. Column 4 (CONCLUSION): a photograph of many empty glass bottles in green, cobalt blue and clear glass on a light grey background with a wooden surface, lit from the side. Below, six circular black-and-white portrait photos on teal blob backing: Michel GIANNUZZI (man, smiling, dark suit, white shirt, grey background, head and shoulders, appears twice), Laetitia FABRE (woman, dark hair, smiling, grey top, head and shoulders), Romain BARRAL (man, grey hair, dark jacket, head and shoulders), Denis MICHEL (man, short grey hair, dark suit, white shirt, head and shoulders), Wendy KOOL-FOULON (woman, long blonde hair, smiling, head and shoulders). Each portrait is cropped to a rounded blob with a teal shape offset behind it. Bottom centre: the Verallia logo, a green-teal overlapping-leaf mark with the grey wordmark 'verallia'. A thin teal bar runs along the bottom-left edge under the footer. Corner shape bottom-right, teal at 25% opacity.
Slide 3
AGENDA / INTRODUCTION / CSR STRATEGY: 3 MAIN PILLARS / GOVERNANCE / CONCLUSION / Michel GIANNUZZI / CEO / Laetitia FABRE / Head of CSR / Romain BARRAL / Director of Operations / Denis MICHEL / Secretary General / Wendy KOOL-FOULON / General Counsel / Michel GIANNUZZI / CEO / Verallia’s ESG Strategy Presentation – January 21, 2021 / verallia / 3
Visuals: Four blob-shaped picture frames, one per agenda section, at the same height across the slide. Column 1 (active, INTRODUCTION): a teal #01A5A5 organic ring around a photograph of green, amber and brown glass bottles and jars standing on a white background, seen at a close eye-level frame with the bottles filling the frame and slightly cropped on the left and right edges; the photo is full colour. Column 2 (CSR STRATEGY: 3 MAIN PILLARS): a grey ring around a greyscale split photograph, left half a clear glass bottle with a ribbed surface, right half a close-up of leaves and a textured surface, with a white curved line tracing an infinity-like loop across the middle. Column 3 (GOVERNANCE): a grey ring around a white-on-white line icon of a circular gear-like wheel with four spokes ending in cogs, drawn in light grey. Column 4 (CONCLUSION): a grey ring around a greyscale photograph of many wine and glass bottles with a jar in the foreground, faded to light grey. Portraits, each in a blob-shaped crop with a grey or teal backdrop: Michel GIANNUZZI (CEO, active, colour-tinted crop, smiling bald man in dark suit and open-necked shirt, teal blob behind), Laetitia FABRE (faded greyscale, woman with dark hair), Romain BARRAL (faded greyscale, smiling man with short grey hair in dark jacket), Denis MICHEL (faded greyscale, smiling man with grey hair and dark jacket), Wendy KOOL-FOULON (faded greyscale, woman with long light hair), Michel GIANNUZZI (CEO, faded greyscale, same portrait as the active one). Verallia logo: a green overlapping-circles mark followed by the lowercase wordmark verallia in dark grey. Lighting is soft and even throughout; no overlays except the white 70% veil over the faded columns.
Slide 4
1 / INTRODUCTION / A GLOBAL LEADER IN GLASS PACKAGING / Diversified and balanced end-markets / 2019 Glass packaging(1) sales split by end-market / Food / 17% / Soft drinks / 12% / Beer / 13% / Spirits / 13% / Sparkling wine / 12% / Still wine / 33% / 11 / countries / 10,000 / employees / 16 / billion / bottles/jars p.a. / 32 / glass plants / 8 / cullet recycling / centers / 3 / decoration plants / 57 / furnaces / N° 1 / in Europe(2) / 90% of 2019 sales / N° 2 / in Latin America(3) / 10% of 2019 sales / N° 3 / Globally / Sources: Companies public information, management estimates and Advancy (IPO related study) / Notes: (1) For bottles and jars only (97% of total Verallia sales) / (2) Based on 2019 sales; “Europe” using each company’s definition and management estimates / (3) Based on 2019 volumes in Argentina, Brazil and Chile / verallia / Verallia’s ESG Strategy Presentation – January 21, 2021 / 4
Visuals: Donut chart. Title: none printed as chart title; chart heading is ‘Diversified and balanced end-markets’ with subtitle ‘2019 Glass packaging(1) sales split by end-market’. Type: donut with centre hole of about 50% diameter; no axes, no units. Segments clockwise from top: Still wine 33% (dark green #009362, label inside segment in white), Sparkling wine 12% (green #58AB27), Spirits 13% (teal #00A7A7), Beer 13% (yellow #F9B200), Soft drinks 12% (orange #EA640D), Food 17% (magenta #AE0079). Each segment has its category name in its own colour placed outside the ring, and its percentage in white inside the ring. No legend; no highlighted points. Central blob graphic: seven teal rounded-blob bubbles, each with a white bold number and a grey label beneath, connected by thin light-teal straight lines (#00B3B0, about 1 px) to a central Verallia glass-droplet logo: 11 countries (upper left), 10,000 employees (top), 16 billion bottles/jars p.a. (upper right), 8 cullet recycling centers (right), 57 furnaces (bottom), 3 decoration plants (lower left), 32 glass plants (left). Bubbles are two overlapping teal blobs (#00B3B0 at 27% and 63% opacity). Central logo: three overlapping translucent glass drops in teal and green with white ‘verallia’ lowercase wordmark. Footer logo: small Verallia drop mark plus wordmark ‘verallia’ in dark teal-grey. Decorative corner shape bottom-right in #01A5A5 at 25% opacity. Icon-like small ornaments: none.
Slide 5
1 / INTRODUCTION / OUR VALUES / CARE / for customer / RESPECT / people, laws and / the environment / EMPOWERMENT / and accountability / TEAMWORK / Verallia’s ESG Strategy Presentation – January 21, 2021 / 5
Visuals: Four solid teal blob shapes, each an irregular rounded pebble-like form in #00B3B0, each carrying a white pictogram. Top-left blob: white wine bottle and jar with teal heart symbols on their labels. Top-right blob: white pictogram of a person, two bottles and glasses, and a leaf, above an open white hand. Bottom-left blob: white pictogram of a person beside a white shelf or cabinet with a grid of small bottles. Bottom-right blob: two white person silhouettes with arms spread, standing either side of a white bottle. Centre: full-colour Verallia logo (three overlapping translucent green-teal glass drops with dark grey wordmark verallia) placed over the crosshair intersection, overlapping the inner edges of the top blobs. Four thin light-teal lines (#9ED8D8, about 0.1 percent width) form the crosshair: two horizontal lines from the logo outward and two vertical lines from the top and bottom of the centre. Bottom-centre footer logo is a small version of the same logo. Nothing is cropped; all are boxed on the white background, not full-bleed. No photograph.
Slide 6
1 / INTRODUCTION / OUR PURPOSE / Re-imagine glass / for a sustainable future / 6 / Verallia’s ESG Strategy Presentation – January 21, 2021
Visuals: Photograph, full-bleed across the slide width in a horizontal band from about 20% to 84% of slide height. Subject: left half shows a heap of crushed green, white and brown glass cullet, sharp and in focus; right half shows several olive-green glass bottles standing upright, their rims and necks blurred. Composition: landscape band, bottles cropped at the right edge, cullet filling the left. Lighting: soft, even, diffuse daylight. Dominant colours: sage green, off-white, dark olive. A black overlay at 44% opacity covers a horizontal strip from 35% to 75% of slide height across the full width, darkening the photo behind the quotation. Two large white opening quotation mark graphics sit at the left of the strip, about 12% to 26% of slide width, overlapping the cullet. Verallia logo: teal and green overlapping rounded blobs with the lowercase word 'verallia' in dark grey, centred near the bottom. No other icons.
Slide 7
1 / INTRODUCTION / OUR PURPOSE / A TWO-PRONGED STRATEGY TO DEVELOP OUR PURPOSE / PERFORMANCE OF A MATERIALITY ANALYSIS* / Verallia developed a materiality matrix to reflect the strong identity / of the Group as well as the specific issues relating to its activities / and local presence / It led to the development of three priorities: / 1 / Acting for the safety and development of teams / 2 / Helping to preserve the environment by being / a benchmark player in the circular economy / 3 / Nurturing relationships with our stakeholders / A COLLABORATION WITH ALL VERALLIA’S STAKEHOLDERS / • 42 interviews with external stakeholders / (customers, suppliers, etc.) / • 28 in-depth interviews with internal stakeholders / • Key market focus groups / - 10 employee focus groups were conducted in 5 key markets: / France, Germany, Italy, Iberia, and Latin America / - 1 focus group in each market conducted with Middle / managers & Senior managers / • Global employee consultation / - Online consultation conducted in 13 countries / in 7 languages generating c. 1,500 responses / • 5 webinars with the Divisions to introduce the purpose / • 4 workshops with the Corporate Functions to introduce / the purpose / * For more information, please see the 2019 Statement of Extra-Financial Performance: https://www.verallia.com/wp-content/uploads/2020/11/Ls9b95-dpef-verallia-2019-en-def.pdf / Verallia’s ESG Strategy Presentation – January 21, 2021 / 7
Visuals: Three numbered priority markers in the left column, each a solid teal blob shape (#00B3B0) with a fainter offset teal blob (#00B3B0 at 28 percent opacity) behind it, containing white numerals 1, 2 and 3. A small Verallia logo at bottom centre: a stylised green-teal leaf or drop mark with the lowercase wordmark verallia in dark grey beside it. No photographs or charts. A decorative pale teal corner shape at bottom right (#01A5A5 at 25 percent opacity) behind the page number. A short teal bar at bottom left under the footer text.
Slide 8
8
Visuals: A full-slide image (1920 by 1080 px) renders as blank white with no visible subject. A small image (256 by 79 px) sits near the bottom centre, but its content is not visible against the white background. There is no chart, table, photograph, diagram or icon with visible content. The pale teal rectangle at bottom right is a filled shape, not an image.
Slide 9
1 / INTRODUCTION / VERALLIA HAS JOINED AS A NETWORK MEMBER / THE ELLEN MACARTHUR FOUNDATION / The Ellen MacArthur Foundation / Launched in 2010 to accelerate the transition to a circular economy / The Foundation works with, and inspires, business, academia, policymakers, / and institutions to mobilise systems solutions at scale, globally / Collaboration / with the Ellen MacArthur Foundation to accelerate progress / across our three priority areas: / accelerating innovation in the glass value chain / encouraging reuse / mobilizing for more recycled glass / Great opportunity for Verallia to work / with leading thinkers, and even more closely with other / network organizations right across our value chain to drive / the transition to a circular economy for glass / New milestone on our journey to make glass / the most sustainable material / Verallia’s ESG Strategy Presentation – January 21, 2021 / 9
Visuals: 1) Ellen MacArthur Foundation Member logo (image, 959 by 270 px, box x 6.8%, y 51.2%, w 39.4%, h 19.8%): black concentric ring mark of three incomplete circles on the left, with the bold black sans-serif wordmark ELLEN MACARTHUR / FOUNDATION in capitals and the word Member in black slab-style serif below. Flat, no tint, not cropped. 2) Verallia logo (image, 256 by 79 px, box x 46.1%, y 94.6%, w 7.8%, h 4.3%): green-teal overlapping leaf-like glossy blobs at left with the lowercase wordmark verallia in dark grey to the right. 3) Large teal organic blob shape at the left edge (box x 0%, y 29.7%, w 18.8%, h 49.4%), fill #01A5A5 at 25% opacity, bleeding off the left edge, rounded irregular outline. 4) Small teal blob in the bottom-right corner (box x 92.6%, y 93.9%, w 7.4%, h 6.1%), fill #01A5A5 at 25% opacity, bleeding off the right and bottom edges. 5) Solid teal bar bottom left under the footer text (about x 2.8%, y 98.9%, w 8.0%, h 0.9%), fill #01A5A5 full opacity. 6) Light teal tab behind the section label (about x 2.7%, y 0%, w 12.0%, h 3.6%), fill #78CFCF, no border. 7) Three thin vertical teal rules, 1 px, #01A5A5: at about x 48.9% y 44% to 58% beside Collaboration, about x 56.1% y 62.5% to 74.5% beside Great opportunity, and about x 46.2% y 77% to 85% beside New milestone.
Slide 10
GENDA
INTRODUCTION
CSR STRATEGY: 3 MAIN PILLARS
GOVERNANCE
CONCLUSION
Michel GIANNUZZI
CEO
Laetitia FABRE
Head of CSR
Romain BARRAL
Director of Operations
Denis MICHEL
Secretary General
Wendy KOOL-FOULON
General Counsel
Michel GIANNUZZI
CEO
Verallia’s ESG Strategy Presentation – January 21, 2021
verallia
10
Visuals: Four blob-framed section images. Column 1 (faded, grey overlay): photograph of glass bottles of varied shapes and jars on a light background, full composition in an organic rounded-triangle frame. Column 2 (full colour, teal ring behind): split photograph, left half shows an amber-orange glass bottle with a warm glowing backlight, right half shows a close-up of a tree trunk with green ivy leaves; a thin white infinity-like curved line crosses the join. Column 3 (faded grey): flat grey line icon of a circular ring with four spokes ending in cog-like knobs, arranged in a loop with gaps. Column 4 (faded grey overlay): photograph of many dark and clear glass bottles and jars standing close together, lit from the front. Three teal-ringed circular portrait photos in the active column, each a greyscale head-and-shoulders headshot with a light grey background: Laetitia FABRE (woman, dark hair pulled back, smiling, light grey top), Romain BARRAL (man, short grey hair, dark jacket, smiling), Denis MICHEL (man, short grey hair, dark suit and open-collar white shirt). Faded grey portraits for Michel GIANNUZZI (column 1, man, bald, smiling, dark jacket), Wendy KOOL-FOULON (column 3, woman, long blonde hair, smiling) and Michel GIANNUZZI (column 4). Portraits are cropped to organic blob shapes with a teal offset ring behind the active ones. Verallia logo: a green-to-teal overlapping circle mark with the lowercase wordmark verallia in dark grey to its right.
Slide 11
2 / CSR STRATEGY
VERALLIA COMMITMENT TO THE
UNITED NATIONS SUSTAINABLE DEVELOPMENT GOALS
Enhance
the circularity
of glass packaging
Significantly reduce
our CO2 emissions
across our operations
Provide
a safe & inclusive
place of work
Verallia’s ESG Strategy Presentation – January 21, 2021
verallia
11
Visuals: Three photographs in organic rounded-triangle (blob) crops, each about 21.5% of the slide width and 37% of the slide height. Left: close-up of broken green, brown and clear glass cullet piled in a heap, lit evenly, filling the blob. Middle: a wide view of a industrial plant with two tall brown-red chimneys, grey silos and conveyor structures in front of brown hills and a snowy mountain range under a pale sky; a small verallia sign is visible on a building at lower left. Right: a smiling woman with blonde hair in a navy cap and navy and lime-green high-visibility jacket, seated at a table with papers and a pen, three blurred colleagues in grey and navy workwear behind her in a bright white room; the crop is a blob with the top-right edge cutting her cap. Also one UN Global Compact emblem (grey globe with laurel wreath and curved text 'UN GLOBAL COMPACT') at top right, and the verallia logo (green-teal swirl mark with grey-teal wordmark) at bottom centre. Nine UN SDG icons arranged in three groups of three, each a square tile with a number, a label and a white pictogram: left group 12 RESPONSIBLE CONSUMPTION AND PRODUCTION (ochre #B8862B tile with infinity-loop pictogram), 13 CLIMATE ACTION (green #3F7F3F tile with eye-globe pictogram), 17 PARTNERSHIPS FOR THE GOALS (dark blue #1F4E79 tile with interlocking rings pictogram); middle group 13 CLIMATE ACTION (green #3F7F3F tile with eye-globe pictogram), 15 LIFE ON LAND (bright green #5DBB2E tile with tree and bird pictogram), 17 PARTNERSHIPS FOR THE GOALS (dark blue #1F4E79 tile with interlocking rings pictogram); right group 8 DECENT WORK AND ECONOMIC GROWTH (crimson #A0173F tile with bar chart and rising arrow pictogram), 5 GENDER EQUALITY (red-orange #FF3B1F tile with gender symbol pictogram), 17 PARTNERSHIPS FOR THE GOALS (dark blue #1F4E79 tile with interlocking rings pictogram). Photos are not framed, have no border or overlay.
Slide 12
2
CSR STRATEGY
ENHANCE
THE CIRCULARITY
OF GLASS PACKAGING
12 RESPONSIBLE CONSUMPTION AND PRODUCTION
13 CLIMATE ACTION
17 PARTNERSHIPS FOR THE GOALS
Verallia’s ESG Strategy Presentation – January 21, 2021
verallia
12
Visuals: Photograph: close-up of crushed green, brown, clear and white glass fragments heaped across the frame, shot at a slight angle with shallow depth of field and sunlit highlights on the shard edges. The photo is cropped into an irregular rounded teardrop/blob shape (not a rectangle) and is not full-bleed. A translucent teal (#01A5A5 at 25% opacity) shape overlaps the left portion of the photo and extends beyond it to the left edge of the slide. Dominant photo colours: deep green, dark olive, white and amber-brown. Three SDG icons in a row, each a square tile with no border: (1) SDG 12 Responsible Consumption and Production, square in ochre-gold #BF8B30 with white number 12, white text RESPONSIBLE CONSUMPTION AND PRODUCTION and a white infinity-loop arrow symbol; (2) SDG 13 Climate Action, square in green #3F7E44 with white number 13, white text CLIMATE ACTION and a white eye outline containing a globe; (3) SDG 17 Partnerships for the Goals, square in dark blue #1F4E79 with white number 17, white text PARTNERSHIPS FOR THE GOALS and a white interlinked-rings emblem. Verallia logo: teal and green overlapping rounded blobs with the wordmark verallia in dark grey lowercase sans-serif. A thin dark grey vertical rule separates the text from the image. Small teal blob in bottom-right corner behind the page number.
Slide 13
2 / CSR STRATEGY – ENHANCE THE CIRCULARITY OF GLASS PACKAGING / CIRCULARITY IS AT THE HEART / OF OUR MODEL / Extraction and processing / of raw materials / (sand, limestone, soda ash) / Eco-design and manufacturing / of quality glass packaging / Collection and awareness / on sorting and recycling / SAVINGS / +10 / pts / of cullet / -5 / % / of CO2 / emissions / -2.5 / % / of energy / consumption / Processing of collected glass into cullet / via the recycling of glass in cullet treatment centers / (Verallia or partners) / Packing and marketing / enhancement of our customers’ products / and well-being of end consumers / Verallia’s ESG Strategy Presentation – January 21, 2021 / verallia / 13
Visuals: One large flat vector illustration in an infinity-loop (figure-eight) process diagram, drawn as a light grey-green looping road band with darker green chevron arrows showing a clockwise flow. Stage 1 (top-left, orange #F9B200): a conical heap of sand and an orange sun-like dot with a leader line, plus three orange-tinted dump trucks driving up the loop. Stage 2 (top-centre, magenta #E81773): an isometric glass factory with a tall chimney and a magenta-outlined silo, and a small magenta truck leaving it; a dotted magenta route line runs down from the factory to the centre. Stage 3 (top-right, teal #01A5A5): a teal recycling bin with a leader dot above, a teal-outlined garbage truck with recycling symbols tipping cullet, a teal bin with a person beside it, and a teal truck on the upper-right arc with a dotted teal route. Stage 4 (bottom-left, navy #225288): an isometric cullet treatment plant with a conveyor and a pile of teal cullet fragments, a teal truck entering a grey tunnel, and a navy leader dot below the label. Stage 5 (bottom-right, red #E5101B): a red-outlined packing and marketing building with a red bottle and a red dot leader, and a red truck on the lower path. Also a teal cloud outline with the text CO2 and a teal lightning bolt outline in the right column. Small thin-line teal V-shaped chevron below +10 pts of cullet. Ink line style, flat fills, no photographs.
Slide 14
CSR STRATEGY – ENHANCE THE CIRCULARITY OF GLASS PACKAGING
2
INCREASE CULLET INTEGRATION
OUR GOALS
PERFORMANCE INDICATORS*
2019
2025 TARGETS
Enable the increase of cullet collection by 7 pts
vs 2019
% of domestic used glass collected
in Verallia’s countries in Europe
76%*
83%
Increase the rate of use of external cullet by 10 pts
vs 2019
Rate of external cullet usage in our glass
production sites
49%
59%
*Historical data are shown in Appendices
3 main levers for action
to maximize cullet utilization in Group’s
furnaces
1
Take part
in joint initiatives
to increase cullet
collection
2
Improve
recycling
capacity and
efficiency
3
Optimize
cullet usage
in Group
furnaces
* Latest 2018 FEVE public figures; 2019 figures are undisclosed
Verallia’s ESG Strategy Presentation – January 21, 2021
14
Visuals: Table with four columns and three rows (one header row, two data rows): column 1 'OUR GOALS' (cells: 'Enable the increase of cullet collection by 7 pts vs 2019'; 'Increase the rate of use of external cullet by 10 pts vs 2019'); column 2 'PERFORMANCE INDICATORS*' (cells: '% of domestic used glass collected in Verallia’s countries in Europe'; 'Rate of external cullet usage in our glass production sites'); column 3 '2019' (cells: '76%*' and '49%'); column 4 '2025 TARGETS' (cells: '83%' and '59%'). The 2025 targets column has a pale mint tint #E8F7F6 and its values are teal. Three numbered steps: numerals 1, 2, 3 in large teal type, each beside a thin vertical teal divider line and a teal organic blob (solid #00B3B0 with a lighter offset #00B3B0 copy at 28% opacity behind it, slightly up and left). Each blob carries white centred text: 'Take part in joint initiatives to increase cullet collection', 'Improve recycling capacity and efficiency', 'Optimize cullet usage in Group furnaces'. Logo: Verallia logo at bottom centre, a stylised overlapping teal-green drop mark on the left with the lowercase dark wordmark 'verallia' on the right. No photographs. Bottom-right corner has a pale teal curved shape.
Slide 15
2 / CSR STRATEGY – ENHANCE THE CIRCULARITY OF GLASS PACKAGING / LEVER #1: / JOINT INITIATIVES TO INCREASE CULLET COLLECTION / CASE STUDY / FEVE PARTNERSHIP AND LOCAL INITIATIVES / WORKING DIRECTLY WITH LOCAL AUTHORITIES / FEVE* / European glass packaging industry to boost EU glass collection / for recycling to 90% by 2030 (from 76% in 2018¹) / CLOSE THE GLASS LOOP PROGRAM AMBITIONS / 1. MORE / Promote selective / glass collection / to increase cullet / quantity & quality / 2. BETTER / Optimize and develop sorting / & treatment systems to / increase yield and generate / more furnace-ready cullet / 3. TOGETHER / Exchange of knowledge and / best practices in collection, / sorting & treatment / systems between countries / Chile / Russia: work with cities around our plants to help / them increase collection (+30% increase in cullet used expected in 2021) / Rancagua / 225 k hab / Chile / (Region VI, / 1 m inhabitants) / FRIENDS OF GLASS – SPANISH INITIATIVE VIA ANFEVI / CHIN CHIN Campaign on social media June to September 2020 / Influencers on Instagram, Tik Tok plus youtube video + 5.6 million views / VOLGOGRAD / SOTCHI / SOUTH CAUCASUS / Russia / (South Caucasus, / 25 m inhabitants) / Cities involved / Verallia Plant / *FEVE: Federation of European manufacturers of glass containers for food and beverage and flacons for perfumery, cosmetics and pharmacy markets / 1. Latest 2018 FEVE public figures / Verallia's ESG Strategy Presentation – January 21, 2021 / 15
Visuals: Chile map: a grey regional map of Chile's Region VI shown as light-grey outlined administrative regions with small black region labels (for example NAVIDAD, LITUECHE, LA ESTRELLA, MARCHIGUE, PICHILEMU, PAREDONES, LOLOL, CHEPICA, SANTA CRUZ, SAN FERNANDO, MACHALI); teal dots mark cities involved, and a teal factory icon marks the Rancagua plant; a teal city marker sits on the Rancagua label. South Caucasus map: a schematic outline map of the Black Sea coast and Caucasus region, with the Russian Federation regions in dark grey and Georgian and Armenian areas in white outline; labels VOLGOGRAD and SOTCHI in dark grey bold capitals with black dots; teal dots mark cities involved and teal factory icons mark plants. Ring graphic: a circle of about 150 small dots in green, blue, light-green and pink on a white background, arranged in a loose ring, placed behind the heading CLOSE THE GLASS LOOP PROGRAM AMBITIONS and overlapping its last word. Photograph left: a dark silhouette of a person's head and shoulders against a bright window showing blurred apartment blocks, high contrast, boxed rectangle, not cropped. Photograph centre: two hands clinking beer bottles against a sunset sky with orange-yellow glow, boxed; to its right a cropped screenshot of an Instagram post with small grey text and icons on white. Legend: a teal filled circle labelled Cities involved and a teal factory icon labelled Verallia Plant. Verallia logo: a green and teal three-blob mark with the lowercase wordmark verallia in dark grey.
Slide 16
2
CSR STRATEGY – ENHANCE THE CIRCULARITY OF GLASS PACKAGING
LEVER #2:
IMPROVE RECYCLING CAPACITY AND EFFICIENCY
CASE STUDY
INVESTMENT IN CULLET TREATMENT CAPACITY
(DIRECT PARTNERSHIPS AND THROUGH EXTERNAL SUPPLIERS)
Verallia – 8 cullet treatment plants
• Invested €15m in its cullet treatment plants (2018-2020)
• Has teamed up with a leading Spanish cullet treatment operator to set up a new cullet treatment plant close to Madrid in 2019
• Bought recycling facility in the Canary Islands in 2018
• Has increased the efficiency of recycling process to
• improve separation of colored and non colored cullet and
• improve cullet re-use rate in non colored glass at its own as well as suppliers’ facilities
• Is treating 50% of its cullet in house
118
Joint Venture with TM Alcudia Reciclatges in Guadalajara
Available glass waste in Madrid: 118 kt
• Increase treatment capacity for Verallia Iberia of +40 kt/year
• Flint cullet production of 10 kt/year
Recicladora de Vidrio de Canarias since October 2018
• In 2019: production of 35 kt of usable cullet
• Treatment capacity/year: 45 kt/year
New Cullet plant – Guadalajara district – 9,300 m² land with 5,000 m² of constructed facilities
Verallia plants
Vidrieras Canarias
Cullet treatment plant – Gran Canarias
Verallia’s ESG Strategy Presentation – January 21, 2021
2
16
layout:The slide is a free layout on a white field with a title block at top left, a centred teal subtitle with a thin teal rule on either side, a map of Spain and Portugal with the Canary Islands inset on the left, a legend row beneath the map, and a text column on the right with a headline, bullet list, a rounded photo and a second text block. The header tag is at top left, the Verallia logo sits centred at the bottom, the footer is at bottom left and the slide number is in a small teal corner shape at bottom right.
Visuals: Outline map of Spain and Portugal drawn in thin grey (#7F7F7F-like) lines on white, with the Canary Islands inset in a box at bottom left and a scale bar (150 km / 100 mi) at bottom right of the map, credit d-maps.com. Teal (#01A5A5) factory icons mark Verallia plants at about six locations: northern Spain near Burgos, Basque area near Zaragoza, Catalonia near Barcelona, central Spain near Madrid, Portugal near Lisbon, and Andalusia near Seville, plus one in Gran Canaria. A teal rounded blob labelled 118 sits at the Madrid area beside a teal star marking the new cullet plant near Guadalajara. Light teal factory icons mark Vidrieras Canarias in the Canary Islands. A large light grey (#BFBFBF, 49% opacity) curved arrow sweeps from the Madrid area up and over toward Catalonia and then down-right, ending in an arrowhead. A photograph of glass cullet cascading down a conveyor or chute, with green and white fragments falling over a grey metal drum, shown in a blob-shaped crop with a teal (#01A5A5, 25% opacity) blob behind and a white blob offset behind it. Logo: the Verallia logo, a green and teal stylised glass shape with the word verallia in lowercase grey-green type, bottom centre.
Slide 17
2
CSR STRATEGY – ENHANCE THE CIRCULARITY OF GLASS PACKAGING
LEVER #3: OPTIMIZE CULLET USAGE IN GROUP FURNACES
2
drivers
CONTINUOUS IMPROVEMENT
OF GLASS CHEMICAL RECIPES
Ongoing effort by Verallia glass
experts to optimize glass recipes
to add cullet while maintaining
final quality
Approach generalized through
the application of a standard rate
of cullet in each plant, adjusted
for glass color
ALIGNMENT WITH SALARY
INCENTIVES (AS OF 2021)
Cullet usage rate introduced
as a KPI for bonus calculation
purposes
Applies to all functions
in the company
Verallia’s ESG Strategy Presentation – January 21, 2021
17
Visuals: Three photographs, one large and two small, plus decorative blob shapes, two grey curved arrows, a teal '2 drivers' badge and the Verallia logo. The large photo (about x 41.5%, y 42.5%, w 25.9%, h 44.6%, 691 by 668 px) is cropped to an irregular organic blob: a worker in a grey protective sleeve reaches into industrial glass-forming machinery, with metal fixtures and a warm orange-brown interior; framing is medium, lighting is warm and industrial, dominant colours are rust brown, orange and grey, no overlay. The upper-left small photo (about x 33.3%, y 46.5%, w 14.6%, h 25.1%, 389 by 376 px) is a blob with a thin white outline showing bright orange molten glass flowing in a channel, lit intensely, dominant colours orange and deep red. The lower-right small photo (about x 59.4%, y 73.8%, w 10.4%, h 17.9%, 276 by 267 px) is a blob with a thin white outline showing rows of amber glass bottles on a dark background, lit warm orange, dominant colours amber and black. Behind the photos are pale teal blob shapes (#00B3B0 at 28% opacity). The teal badge at about x 44%, y 19%, w 12.5%, h 23.8% is a solid #00B3B0 organic blob with a lighter #00B3B0 blob at 28% opacity offset behind it at about x 43.9%, y 18.4%, w 14.5%, h 23.8%. Two light grey (about #D4D4D4) curved arrows with rounded ends: the left one runs from about x 24%, y 24% to x 44%, y 38%, ending with an arrowhead pointing down-left; the right one runs from about x 59%, y 25% to x 77%, y 38%, ending with an arrowhead pointing down-right. The Verallia logo at about x 46.1%, y 94.6%, w 7.8%, h 4.3% is a teal circular leaf-like icon with overlapping green-teal rounded forms beside the lowercase wordmark 'verallia' in dark grey-teal.
Slide 18
2 / CSR STRATEGY – ENHANCE THE CIRCULARITY OF GLASS PACKAGING / GOING ONE STEP FURTHER: / EXPAND REUSE BUSINESS MODELS WHERE IT MAKES SENSE / 2025 TARGETS / At least 1 pilot in France / REUSE: re-imagine an heritage on the impulse of zero waste, bulk and short-circuit trends / Returnable Glass Bottles is both a trend that supports sustainability and an opportunity for extra business / REUSE: A LONGSTANDING FEATURE / OF THE GLASS INDUSTRY / RENEWED EFFORT TO PROACTIVELY DRIVE REUSE / IN NEW GEOGRAPHIES / GERMANY / Returnable Glass Bottles (RGB): / Market share of different mineral water container (%) / 37.8 / 34.6 / 29.9 / 35.3 / 23.7 / 22.5 / YTD June 2019 / YTD June 2020 / Reusable PET / Disposable PET / Reusable Glass / Source: Lebensmittelzeitung / A new 2020 Reusable retro-look 33cl Verallia exclusive / design. Not customer-exclusive development. / Today more than 10 breweries have decided to use it. / Objective: 30 millions of bottles in 2021. / Pictures from Veltins, Krombacher and Bitburger / FRANCE: first steps of new initiative / 6 ongoing product developments / to proactively meet the objective / of a standard reusable glass range / in France by 2022 (AGEC law) / More than 5 meetings with players / interested in launching reusable / bottles/jars / Verallia France invited as a speaker / during the “Rencontres Techniques / de la Consigne” / >> / Special awards given to 2 students / for the design of rosé wine reusable / bottles / 2020 VERALLIA DESIGN AWARDS / TERRASSE ROSÉE / Sodastream / SodaStream Design / Registration No. 006364246 / Co-design / of DUO 1L bottle / matching carbonation / and reuse / Pülleken / LIMO BIER / Benediktiner Weiss / verallia / 18 / Verallia’s ESG Strategy Presentation – January 21, 2021
Visuals: 1) Bar chart, titled GERMANY Returnable Glass Bottles (RGB): Market share of different mineral water container (%). Vertical bar chart, three groups on the category axis labelled Reusable PET, Disposable PET, Reusable Glass; no numeric axis is printed, so bar heights are estimates in percent of the chart height. Series 1 (grey #BFBFBF, YTD June 2019): Reusable PET 23.7, Disposable PET 37.8, Reusable Glass 29.9. Series 2 (light teal #78CFCF, YTD June 2020): Reusable PET 22.5, Disposable PET 34.6, Reusable Glass 35.3 printed in dark teal #0098AF to highlight it. Legend at right of chart: grey dot YTD June 2019, teal dot YTD June 2020. Three teal hand-drawn trend arrows: down-right arrow above Reusable PET, down-right arrow above Disposable PET, up-right arrow above Reusable Glass. Source line Lebensmittelzeitung below the axis. 2) Photo of three beer bottles with paper labels (about 2 of 3 visible labels legible as Pülleken, LIMO BIER and Benediktiner Weiss), standing upright on white, boxed, no crop, neutral daylight. 3) German flag icon, a circular glossy badge with black, red and gold horizontal stripes. 4) French flag icon, a circular glossy badge with blue, white and red vertical stripes. 5) Image of the 2020 VERALLIA DESIGN AWARDS graphic, large pale '2020' numerals behind the wordmark, on white. 6) Magazine spread image (Terrasse Rosée, a page with photographs of wicker chair, interior and outdoor scenes, and dense small text) placed left of a grey-toned studio photo of two rosé-tinted reusable wine bottles with textured glass, soft diffuse light, cropped as one rectangle. 7) Product photo of a SodaStream DUO 1L glass carafe bottle with black cap, filled with sparkling water, on white, full height of its box. 8) Verallia logo: a green-teal stylised leaf/bubble mark with lowercase wordmark verallia in dark grey, bottom centre. 9) Decorative leaf-shaped teal blob at 25% opacity behind the French bullet text and magazine images.
Slide 19
2 / CSR STRATEGY / SIGNIFICANTLY REDUCE / OUR CO2 EMISSIONS / ACROSS OUR OPERATIONS / 13 CLIMATE ACTION / 15 LIFE ON LAND / 17 PARTNERSHIPS FOR THE GOALS / verallia / 19 / Verallia’s ESG Strategy Presentation – January 21, 2021
Visuals: Photograph: a wide, eye-level view of an industrial plant (appears to be a glass or lime production site) on dry, scrubby hills. Two tall brick-red chimneys rise from the centre, flanked by beige and cream silos, a grey pipe run, a yellow conveyor gantry, and low beige and tan buildings; one building carries the Verallia logo. Behind the plant are green tree rows at left, brown-ochre hills, a line of wind turbines, and snow-capped mountains on the horizon under a pale grey-blue sky. Lighting is soft, even overcast daylight with muted, desaturated tones. Dominant colours are grey-blue sky, ochre and olive hills, beige buildings and brick red chimneys. The photo is cropped into an irregular rounded blob shape with no border. A translucent teal blob (about 25 percent opacity, #01A5A5) overlaps the left edge of the photo. Three SDG icon tiles: 13 Climate Action (white eye shape containing a globe on dark green #3F7E44 square); 15 Life on Land (white tree with birds and ground lines on bright green #56C02B square); 17 Partnerships for the Goals (white interlocking rings on navy #19486A square). Each tile is square, no rounded corners, no shadow. Small Verallia logo on the building in the photo and a Verallia logo centred in the footer (teal-green swirl mark with wordmark in dark grey).
Slide 20
2 / CSR STRATEGY – SIGNIFICANTLY REDUCE OUR CO2 EMISSIONS ACROSS OPERATIONS / CO2 EMISSIONS: THE 3 SCOPES / HFCs / N2O / CH4 / CO2 / SCOPE 2 / INDIRECT / SCOPE 3 / INDIRECT / SCOPE 1 / DIRECT / SCOPE 3 / INDIRECT / PFCs / SF6 / leased / assets / Company / facilities / electricity / for own use / employee / communiting / transformation / & distribution / business / travel / processing of / sold products / UPSTREAM ACTIVITIES / REPORTING COMPANY / DOWNSTREAM ACTIVITIES / Purchased goods / & sevices / fuel & energy / related / fuel & energy / related / transformation / & distribution / waste from / operations / use of sold / products / end-of-life / treatment of / sold products / leased / assets / franchises / investments / *For Verallia emissions from GHG other than CO2 are insignificant / Verallia’s ESG Strategy Presentation – January 21, 2021 / verallia / 20
Visuals: One diagram, a raster illustration of a greenhouse-gas scope model. Subject: three upward arrows rising from a bottom ribbon of activity icons, set against stacked grey clouds labelled CO2, CH4, N2O, HFCs, PFCs and SF6. Arrows: a green arrow on the left labelled SCOPE 2 INDIRECT (about x 32 to 41%, y 50 to 72%); a teal arrow left of centre labelled SCOPE 3 INDIRECT (about x 38 to 46%, y 46 to 71%); a dark blue to violet arrow in the centre labelled SCOPE 1 DIRECT (about x 44 to 56%, y 43 to 82%); a teal arrow right of centre labelled SCOPE 3 INDIRECT (about x 53 to 62%, y 46 to 71%). Inside the arrows are icons with labels: lightning bolt in circle with electricity for own use; stacked-drawer icon with leased assets; train with employee communiting; airplane with business travel; stacked-drawer icon with Company facilities; ship with transformation & distribution (upper right); factory with processing of sold products; battery with use of sold products; recycling bin with end-of-life treatment of sold products; pallet stack with leased assets; storefront with franchises; money bag with investments; shopping cart with Purchased goods & sevices; truck with fuel & energy related; drop in bottle with fuel & energy related; ship with transformation & distribution (lower left); waste bin and cup icon with waste from operations. A grey ring-shaped arc links the clouds behind the arrows. Ribbon of icons sits on a rounded-corner rectangle (about x 13.9 to 86.1%, y 70.9 to 81.6%). The image is not cropped; it is a rectangular box with a soft grey gradient background (lighter at the centre top, darker grey at the edges). Lighting is flat and even; no photograph. Dominant colours: lime green #A3CD39, teal #1BAFC6, blue #1E7BC4, violet #6B5FBF at the base of the centre arrow, cloud greys #B9BEC6 to #E2E4E8. The three bands below: UPSTREAM ACTIVITIES, a teal to blue arrow-tipped bar (about x 13.9 to 48.5%, y 85.2 to 88.8%, fill #1AA6B5); REPORTING COMPANY, a deeper blue arrow-tipped bar (about x 41.9 to 56.6%, fill #2A6DB5); DOWNSTREAM ACTIVITIES, a blue arrow-tipped bar (about x 58 to 86.1%, fill #1A7FC0). Verallia logo: a green-teal and blue overlapping mark with the lowercase wordmark verallia in dark grey, boxed, no tint. A small teal bar sits bottom-left at about x 2.8 to 12.2%, y 98.6 to 99.4%. A 25% opacity teal quarter-circle sits bottom-right behind the page number.
Slide 21
2
CSR STRATEGY – SIGNIFICANTLY REDUCE OUR CO2 EMISSIONS ACROSS OUR OPERATIONS
CO2 EMISSIONS: 2020 KEY STEPS AND OBJECTIVES
In our 2019 Extra-Financial statement, CO2 reduction target from 2019 to 2030
= -20% ton of CO2 (scopes 1 and 2) per ton of packed glass
2020 > Challenge of our initial target
To support the worldwide initiative
to limit the increase of global
temperature to well-below 2°C
above pre-industrial levels
1
MEASURE THE 2019 CARBON
BALANCE
Scopes 1, 2, 3 (tons)
Scope 1 | 2,479,512 | 50.6%
Scope 2 market-based(1) | 610,653 | 12.5%
Scope 3 | 1,809,918 | 36.9%
Total Scopes 1, 2, 3 | 4,900,083 | -
Our Scope 3 represents less
than 40% of our total Group
emissions
(1) For Scope 2 emissions, “Market-based” will be the calculation method used
Market-based method = based on GHG emissions emitted by the generators from which Verallia contractually purchases electricity bundled with contractual instruments
Location-based method was used until 2019 = based on average energy generation emission factors for defined geographic locations
2019 Scope 2 emissions “location-based” = 487,825 tons, “market-based” = 610,653 tons.
Verallia’s ESG Strategy Presentation – January 21, 2021
verallia
21
Visuals: Table: title 'Scopes 1, 2, 3 (tons)' above a table with three columns (label, tons, share) and four rows. Row 1 Scope 1 | 2,479,512 | 50.6%. Row 2 Scope 2 market-based(1) | 610,653 | 12.5%. Row 3 Scope 3 | 1,809,918 | 36.9%. Row 4 Total Scopes 1, 2, 3 | 4,900,083 | - (dash). Table has a thick teal rule (about #00A4A3, about 0.5% of height) above the header row, thin light-teal row dividers (about #67C8C5 at low weight) and vertical dividers between columns. Row 4 is filled #67C8C5 with white text. Numeric values are shown as printed; no chart. Decorative: a teal numbered blob marking step 1 (large #00B3B0 blob with a lighter #00B3B0 blob at 28% opacity offset behind it, the number 1 in white). Thin grey horizontal rules flank the top statement (left and right, about #7F7F7F). A thin vertical teal line (about #78CFCF) runs from about y 33% to y 94% at about x 32.3%. Two thin teal chevrons: one left-pointing chevron at about x 30.6% to 33.3%, y 50% to 63%, and one right-pointing chevron at about x 73% to 75%, y 64% to 71%. Verallia logo: a green-teal abstract droplet mark with the word verallia in lowercase grey-teal, placed bottom centre.
Slide 22
2 / CSR STRATEGY – SIGNIFICANTLY REDUCE OUR CO2 EMISSIONS ACROSS OPERATIONS / CO2 EMISSIONS: 2020 KEY STEPS AND OBJECTIVES / OUR GOAL / PERFORMANCE INDICATORS / 2019 / 2025 TARGETS / 2030 TARGETS / Reduce our absolute CO2 emissions by 27.5% / by 2030 vs 2019, in line with Science-Based Targets / Tons of CO2 emitted (scopes 1 & 2)(1) / 3,090 k / 2,626 k / 2,240 k / 2 / REDACT / AND DISCLOSE / CDP / DISCLOSURE INSIGHT ACTION / A- / 1st Rating 08.12.2020 / 3 / DEFINE THE GHG EMISSIONS / REDUCTION TARGETS / SCIENCE BASED TARGETS / DRIVING AMBITIOUS CORPORATE CLIMATE ACTION / “COMMITTED” status / -27.5% in 2030 / of scopes 1 & 2 emissions / in absolute data from a base year 2019 / well below 2°C trajectory / 4 / ON-GOING 2021: / ACTIVATE SCOPE 3 / REDUCTION LEVERS / • Strategic suppliers / • Logistic optimization / • Lightweight of bottles and jars / (1) Commitment on Scopes 1 & 2, as our Scope 3 emissions represent less than 40% of our total Group emissions (Scopes 1, 2 and 3) / Note: Historical data are shown in Appendices / Verallia’s ESG Strategy Presentation – January 21, 2021 / verallia / 22
Visuals: Table with five columns and two rows. Header row (teal cells): OUR GOAL | PERFORMANCE INDICATORS | 2019 | 2025 TARGETS | 2030 TARGETS. Body row: Reduce our absolute CO2 emissions by 27.5% by 2030 vs 2019, in line with Science-Based Targets | Tons of CO2 emitted (scopes 1 & 2)(1) | 3,090 k | 2,626 k | 2,240 k; the 2025 and 2030 cells have a pale mint fill and teal values. Three numbered teal organic blob shapes with white numerals 2, 3 and 4, each with a lighter offset copy behind it. Logo of CDP (Disclosure Insight Action): crimson and red stylised geometric mark beside bold red CDP wordmark, with small red caps tagline DISCLOSURE INSIGHT ACTION beneath. Logo of Science Based Targets: thin circular ring of multiple coloured curved strokes (navy, teal, red, orange) forming a wave, with dark grey caps wordmark SCIENCE BASED TARGETS and small tagline DRIVING AMBITIOUS CORPORATE CLIMATE ACTION beneath. Verallia logo: overlapping teal-green leaf or drop shapes with a lowercase dark teal-grey verallia wordmark. Two thin light-teal vertical rules and two outlined chevron arrows (about 1px light teal stroke) divide the three columns. Large grade A- in teal, no chart. A small teal bar sits at bottom left.
Slide 23
CSR STRATEGY – SIGNIFICANTLY REDUCE OUR CO₂ EMISSIONS ACROSS OUR OPERATIONS
2
CO₂: 3 MAIN LEVERS TO REACH 27.5% REDUCTION BY 2030
LEVER
1
EXTERNAL CULLET USAGE RATE
65%
60%
55%
50%
45%
40%
2015
2016
2017
2018
2019
2020
2025
SHIFT RAW MATERIAL MIX
Cullet rate increase
•
Reduces CO₂ emissions through lower melting energy and lower / CO₂-intensive materials
•
Objective of reaching maximum achievable cullet rate on all furnaces / by 2030, with a first step of 59% by 2025
•
Relies on mix of collection increase, recycling capacity/efficiency / increase and furnace utilization optimization
Shift away from carbonated raw materials
•
Soda ash and limestone release CO₂ during melting process
•
Objective of partly replacing these materials with / renewable alternatives
Verallia’s ESG Strategy Presentation – January 21, 2021
verallia
23
Visuals: Line chart titled EXTERNAL CULLET USAGE RATE. Type: line chart with smooth solid teal line from 2015 to 2020 and a dashed teal segment from 2020 to 2025. Y axis: percent, range 40% to 65%, labelled at 40%, 45%, 50%, 55%, 60%, 65%. X axis: years 2015, 2016, 2017, 2018, 2019, 2020, 2025 (2025 is spaced as the next category after 2020 and is not a true year step). Series: one series, no legend. Labelled values: none printed; estimates: 2015 about 48%, 2016 about 49%, 2017 about 49%, 2018 about 47.5%, 2019 about 49.5%, 2020 about 51%, 2025 about 60%. Highlighted points: small filled teal dots at each data point, the 2025 point is at about 60% and is the endpoint of the dashed projection. Axis baseline is a thin light grey horizontal line at 40%, no gridlines. Also a thick light grey curved arrow pointing from the right column down-left to the chart title. Also a teal blob with the number 1 marking Lever 1. Also the Verallia logo: a teal and green leaf-like emblem with a grey lowercase wordmark verallia.
Slide 24
2
CSR STRATEGY – SIGNIFICANTLY REDUCE OUR CO2 EMISSIONS ACROSS OUR OPERATIONS
CO2: 3 MAIN LEVERS TO REACH 27.5% REDUCTION BY 2030
LEVER
2
MELTING ENERGY MIX
100%
80%
60%
40%
20%
0%
2015
2019
2020
2025
Fuel
Nat. Gas
Electricity
Biogas
REDUCE ENERGY CONSUMPTION
Melting energy reduction (CA 80% of total energy consumed)
• Upgrade of furnace technology (hardware and process control) to address losses, eliminate water ingress via cullet and add pre-heaters
• Gradual reduction in share of fossil energy used in furnaces, eliminating fuel (highest CO2 generator) and maximizing electrical heating
• Participation into FEVE “Furnace of the Future” project for the development of next generation furnace using 80% of electrical heating
• Evaluation of hydrogen usage impact on furnace performance and design through real life test and participation to a consortium led by DNV-GL
Non melting energy reduction (CA 20% of total energy consumed)
• Address loss reduction on forehearth/heat treatment equipment, optimize supporting fluid generation or heat reuse
Verallia’s ESG Strategy Presentation – January 21, 2021
verallia
24
Visuals: 1) Stacked column chart titled MELTING ENERGY MIX (teal caps, centred above the chart at about x 18.6%, y 37.7%). Type: stacked column, four columns for 2015, 2019, 2020 and 2025. Y axis: 0% to 100%, ticks every 20% (0%, 20%, 40%, 60%, 80%, 100%), no axis title, no gridlines, light grey baseline. X axis: years 2015, 2019, 2020, 2025, no axis title. Series, bottom to top: Fuel (dark teal #01A5A5) about 27% in 2015, about 10% in 2019, about 9% in 2020, none visible in 2025; Nat. Gas (mid teal #78CFCE) to about 95% in 2015 (about 68% of the column), to about 93% in 2019 (about 83%), to about 93% in 2020 (about 84%), to about 91% in 2025 (about 91%); Electricity (pale teal #CCE8E9) on top, about 5% in 2015, about 7% in 2019, about 7% in 2020, about 6% in 2025 with column tops at about 100%, 100%, 100% and 97.5%. No printed data labels. Legend below the axis, centred at y 77.4%: square swatches for Fuel (dark teal), Nat. Gas (mid teal, its label sits on a light grey #BFBFBF box at about 49% opacity), Electricity (pale teal); Biogas has a label but no visible swatch. No highlighted points. 2) Grey curved arrow (light grey #BFBFBF at about 49% opacity, stroke about 1% of slide height with rounded ends) starting near the right text heading at about x 45%, y 29% and sweeping up and left to an arrowhead pointing down-left at the top of the chart near x 33%, y 40%. 3) LEVER 2 badge: a solid teal #00B3B0 organic blob shape (about 8.3% by 15.8%) with a larger pale teal #00B3B0 blob at about 28% opacity offset behind it, containing a large white numeral 2 in a condensed sans. 4) Small teal numeral 2 beside the header strip and a teal numeral 2 near the title as a subscript in CO2. 5) Verallia logo: a stylised teal-green leaf or drop emblem made of overlapping translucent green and teal rounded forms, followed by the lowercase wordmark verallia in dark grey, at about x 46%, y 94.6%, w 7.8%, h 4.3%. 6) Decorative shapes: a bottom-left solid teal bar (#78CFCF) about 9% wide and 1% tall at the bottom edge, and a bottom-right pale teal quarter-round shape (#01A5A5 at 25% opacity) at about x 92.6%, y 93.9%.
Slide 25
2 / CSR STRATEGY – SIGNIFICANTLY REDUCE OUR CO2 EMISSIONS ACROSS OUR OPERATIONS / CO2: 3 MAIN LEVERS TO REACH 27.5% REDUCTION BY 2030 / LEVER / 3 / Covered ground / 12.000 m2 / Covered warehouses / 36.400 m2 / INCREASE USE OF GREEN ENERGY / Green Energy purchases / • Maximize green energy purchases through certified sources of electricity / (target >60% by 2025, from 34% in 2020) / • Benefit from government-led actions to reduce CO2 emissions / (e.g electricity emission factor reduction or hydrogen introduction / in natural gas) / Biogas utilization / • Replace natural gas with biogases in selected plants / • First pilot under evaluation in Germany with the target to have / 3 furnaces fully supplied by bio-gases by 2030 / On-site energy production / • Verallia to implement on-site renewable electricity production / (e.g solar panels - first project Portugal 2022) / Solar panels installed on roofs and land in Verallia / Portugal plant will start production in 2022 / Verallia’s ESG Strategy Presentation – January 21, 2021 / 25
Visuals: Site plan drawing (left, x 6.1 to 28.3 percent, y 37.4 to 69.7 percent): a black-and-white technical plan of an industrial site with outlined building footprints and yellow and grey edges; blue filled rectangles mark solar panel arrays, several in the upper-left and centre, a row of blue panels at lower centre and a larger blue array at lower left. Two red leader arrows with labels 'Covered ground 12.000 m2' (pointing to the upper-right array) and 'Covered warehouses 36.400 m2' (pointing to the lower-centre blue arrays) are drawn in red text on white. Aerial photo (x 28.6 to 41.6 percent, y 39.6 to 69.0 percent): a colour satellite view of a plant with several white-roofed warehouses partly covered by solar panels, surrounded by green trees, roads and red-roofed houses; soft daylight, top-down framing, boxed with square corners and no border. Grey curved arrow (lower centre, roughly x 26 to 46 percent, y 68 to 95 percent): a thick light-grey arc with an arrowhead pointing up-left, sitting behind the lower part of the grey blob. Verallia logo (x 46.1 to 53.9 percent, y 94.6 to 98.9 percent): a teal and green stylised leaf-like mark with the lowercase wordmark 'verallia' in dark grey. Grey blob: a large pale-grey organic leaf-shaped backdrop (#E9EAED) behind the left column. Badge: a teal rounded blob (#00B3B0 with a lighter translucent halo) holding the white numeral 3 next to the word LEVER.
Slide 26
2 / CSR STRATEGY – SIGNIFICANTLY REDUCE OUR CO₂ EMISSIONS ACROSS OUR OPERATIONS / CO₂ EMISSIONS REDUCTION: DETAILED ACTION PLAN / Net reduction in CO₂ emissions / -850 kt (-27.5%) / 3 200 / 3 000 / 2 800 / 2 600 / 2 400 / 2 200 / 2 000 / 1 800 / 1 600 / 1 400 / 1 200 / 1 000 / 3,090 kt / 2,240 kt / CO₂ Emissions 2019 / Raw materials / Energy efficiency / Greener energy / Prod increase impact* / CO₂ Emissions 2030 / Scope 1 impact / Scope 2 impact / Prod increase impact / ACTION PLAN IN PLACE TO REACH SBT 27.5% REDUCTION TARGET / *Assumption = +1% volume CAGR 2019-2030 (tons) / Verallia's ESG Strategy Presentation – January 21, 2021 / 26
Visuals: Waterfall (bridge) bar chart. Y-axis: value scale from 1 000 to 3 200 with labels every 200 at 1 000, 1 200, 1 400, 1 600, 1 800, 2 000, 2 200, 2 400, 2 600, 2 800, 3 000, 3 200, no axis title (values in kt); faint horizontal gridlines in pale teal at each label. X-axis: six categories. Bar 1 'CO₂ Emissions 2019' solid #00A7A7 bar from 1 000 to 3 090 kt, value label '3,090 kt' in white centred inside the bar. Bar 2 'Raw materials' floating bar about 2 750 to 3 090 kt, #67C8C5. Bar 3 'Energy efficiency' floating stack: about 2 700 to 2 750 kt light #C9EAEB segment on top of about 2 410 to 2 700 kt #67C8C5 segment. Bar 4 'Greener energy' floating stack: about 2 100 to 2 410 kt light #C9EAEB segment on top of about 2 030 to 2 100 kt #67C8C5 segment. Bar 5 'Prod increase impact*' floating bar about 2 030 to 2 240 kt, dark teal #017C7C. Bar 6 'CO₂ Emissions 2030' solid #00A7A7 bar from 1 000 to 2 240 kt, value label '2,240 kt' in white centred inside. Net reduction annotation: a grey #7F7F7F bracket line running from above bar 1 (arrow pointing down at its top) across the top to above bar 6 (arrow pointing down at its top), with label 'Net reduction in CO₂ emissions' above a bordered box reading '-850 kt (-27.5%)'. Legend at lower-middle left of the chart: three swatches stacked, #67C8C5 for 'Scope 1 impact', #C9EAEB for 'Scope 2 impact', #00A7A7 for 'Prod increase impact'. No values are printed for the intermediate bars; their values above are estimates marked about.
Slides 27 to 55 continue in the full text file.
Download this deck
The hosted PDF of every library deck is free for readers of the SlideDeck Co newsletter. Join with your email and the viewer and download appear here.
Preparing a strategy presentation of your own? The SlideDeck Co Consulting Deck is a slide library with a statement of work and a worked client case.