
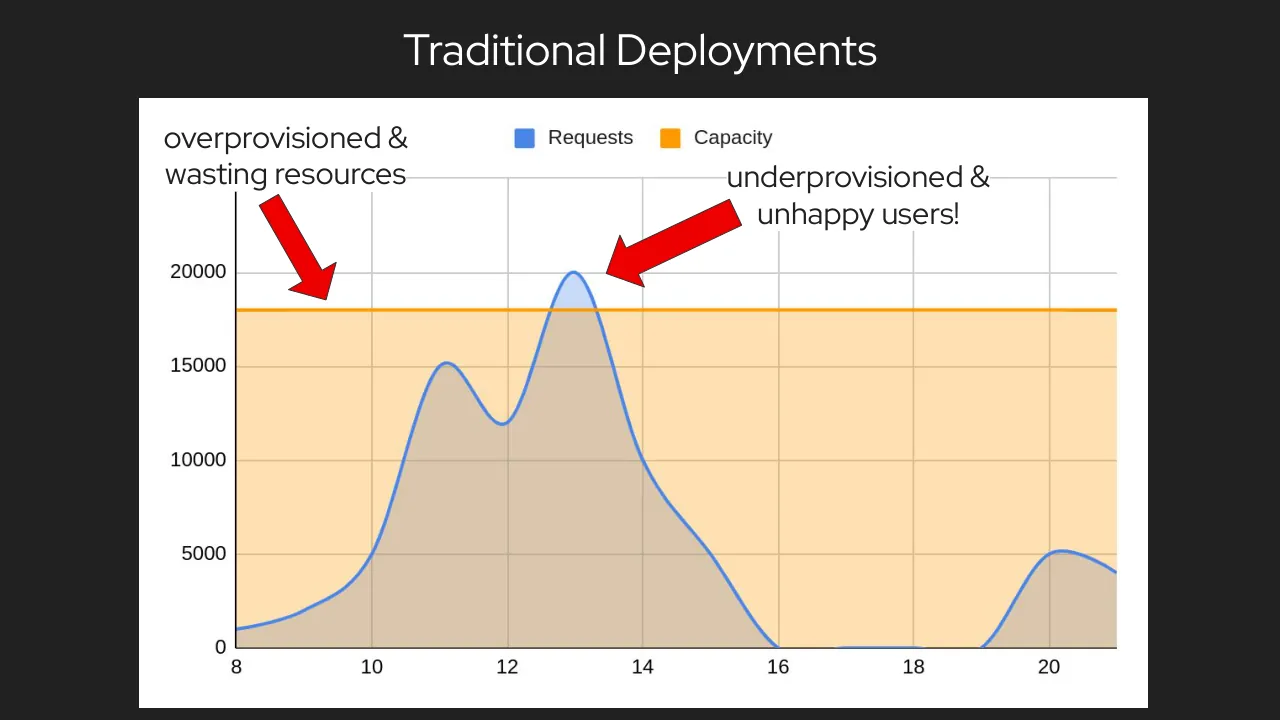
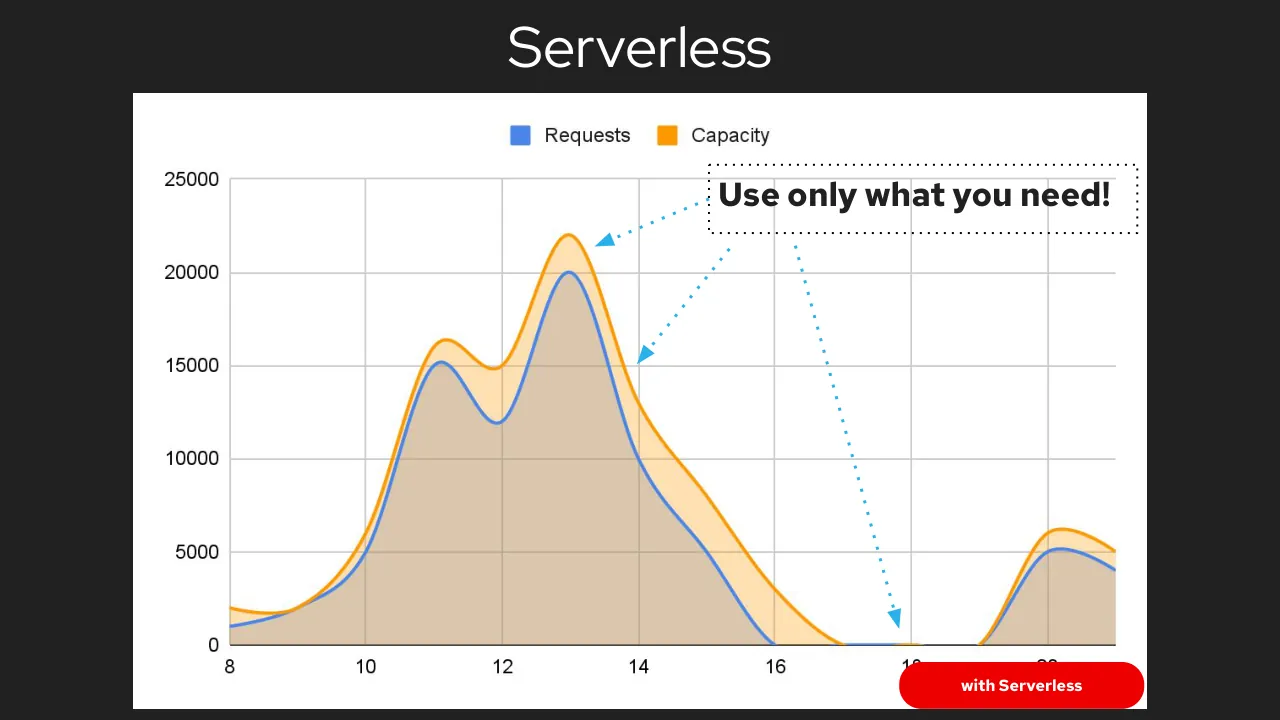
The deck opens with a title slide and speaker introductions for Kevin Dubois and Jose Gomez-Selles of Red Hat, followed by a short framing of the energy demand of computing, supported by quotes and a survey on cloud overspending. It then moves to a comparison of traditional deployments, which waste capacity, against serverless autoscaling, which matches capacity to requests, and introduces Knative and Kepler, a tool for estimating power use per pod, including how it uses eBPF. The core of the talk is a series of experiments comparing power consumption of a serverfull deployment, a Knative serverless setup and a plain setup under different request rates, with results summarised after each one. It closes with conclusions that serverless overhead is roughly constant and that measurement matters, followed by future work, acknowledgements, resource links and speaker contact details. Slides worth seeing include the traditional versus serverless capacity charts on slides 9 and 10, which make the argument with a single visual, and the experiment result slides, which keep each finding to a short bullet list.
Slides worth studying
Questions about this deck
How many slides does the Red Hat Is Serverless Powerfully Powerless deck have?
The Red Hat deck has 59 pages. Slide 1 is the title slide, which names Jose Gomez-Selles and Kevin Dubois as speakers.
What does the Red Hat deck say about the maturity level of Kepler?
Slide 17 states that Kepler was accepted to CNCF on May 17, 2023 and is at the Sandbox project maturity level. The same slide describes Kepler as a way to estimate power consumption at the process, container, and Kubernetes pod levels.
What were the Red Hat deck's Experiment 1 results for serverless and serverfull power use?
Slide 34 reports that E(serverless) > E(serverfull) and that Knative adds idle power consumption. It also says the results were constant over time.
What were the Red Hat deck's Experiment 2 results on the plain setup?
Slide 37 reports the ordering E(serverless) > E(serverfull) > E(plain). It also states that an Istio sidecar adds a 2.5x factor in consumption to the mock.
Details
More from Red Hat
All Red Hat decks in the library
Review score: 6 out of 10, Needs substantial work
Presentation quality, judged with the SlideDeck Co review heuristic. Ask, evidence and idea merit are not rated here.
The deck has a clear question-led route (energy problem, traditional versus serverless capacity, Knative and Kepler, then experiments and conclusions), and slides 9 and 10 make the core idea with one chart and two arrows. The experiment section is hard to follow, though: slides 28 to 33 and 45 to 47 are near-identical full-bleed Grafana dashboards with tiny unreadable labels and only a red box to guide the eye. Result slides such as 34, 37 and 41 repeat the setup bullets and shrink the evidence to thumbnails, so the audience must trust the bullets rather than see the numbers. Quality is uneven, with memes (6, 13, 52), a stray blank slide (49) and a long run of closing promo slides (55 to 58).
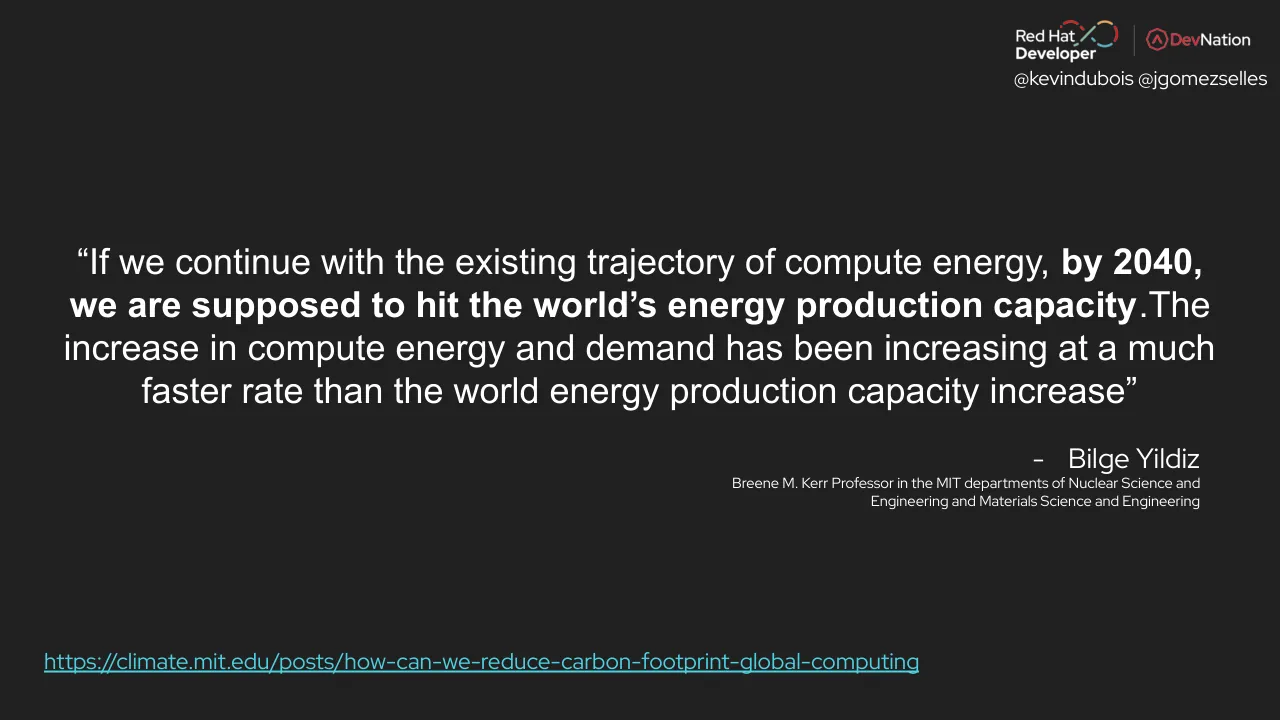
Worth keeping: Keep the single-visual capacity comparison on slides 9 and 10, the clean quote on slide 5, and the short bullet summaries of each experiment's results.
Most useful repair: Replace the dashboard screenshots with cropped, annotated charts or a simple comparison of kWh per setup, and give each result slide one large number or bar chart in place of repeated setup bullets and thumbnails.
What would change the score: Cut the repeated kprobe build slides and the empty or duplicate closing-question slides (24, 48, 49), trim the closing promotion, and use one consistent title and layout style.
Confidence medium. 59 of 59 pages inspected on contact sheets, 4 at readable size. Reviewed 2026-11-08. Model-assisted review (claude-sonnet-5-5).
Full text of the slides (59 slides)
Every slide's words and a description of its charts and images, so the deck can be searched and rebuilt. Also available as Markdown.
Slide 1
KubeCon / CloudNativeCon / Europe 2024 / Red Hat Developer / DevNation / @kevindubois @jgomezselles / Is Serverless / Powerfully Powerless? / Jose Gomez-Selles / Senior Product Manager, Red Hat / Kevin Dubois / Principal Developer Advocate, Red Hat
Visuals: Full-bleed night photograph of Paris viewed from elevated position: the illuminated Eiffel Tower is centred near the horizon, with dense city lights spreading across the frame, a dusk sky with deep blue top fading to orange-pink at the horizon, and the Les Invalides dome visible at right. Dark translucent overlays cover the lower half of the slide (about 49% to 100% height) and the bottom band (about 92% to 100%), darkening the photograph behind the text. Top-left: KubeCon and CloudNativeCon Europe 2024 logos in black on the photo, with a vertical divider between them, the Kubernetes wheel logo above 'KubeCon', and a black square-pattern CloudNativeCon emblem above 'CloudNativeCon', with 'Europe 2024' flanked by horizontal rules beneath. Top-right: Red Hat Developer logo in white with a multicoloured infinity-style mark, a thin vertical divider, and the red DevNation logo.
Slide 2
Kevin Dubois
@kevindubois @jgomezselles
★ Principal Developer Advocate at Red Hat
★ Java Champion
★ Based in Belgium
★ Speak English, Dutch, French, Italian
★ Open Source Contributor (Quarkus, Camel, Knative, ..)
@kevindubois.com
youtube.com/@thekevindubois
linkedin.com/in/kevindubois
github.com/kdubois
Visuals: Photograph (boxed, not cropped, rectangular, about 19.9% of slide width by 38.2% of slide height, with a thin dark drop shadow): a bearded man in a black t-shirt stands at a white lectern, speaking and gesturing with his right hand open. A clear water bottle is on the lectern at left, and a laptop covered in colourful stickers sits at lower right. Behind him is a dark blue-purple stage backdrop at left and a projection screen at right showing green and white code text, including the fragments kdul, Dow, In, ###, Ins and Do. Lighting is stage spotlight, with dominant colours near-black, deep violet, magenta-tinted screen and white shirt highlights. Framing is medium shot from a slightly low angle, subject placed left of centre. Logo lockup (top-right, about 20.4% by 8.3%): Red Hat Developer wordmark in white with a red and teal infinity-style swirl, a thin vertical white divider, then the DevNation wordmark with a red hexagonal icon, DevNation text in white and red. Red Fedora hat icon (about 3.8% by 5.1%) after the first bullet, in red #EE0000. Java Champions lockup (about 10.1% by 7.8%) after the second bullet: a black and white mascot icon with red accents, a vertical divider, and the blue Java wordmark with the small Champions subtitle in blue #3F87B8 and a faint white-grey glow around it. A soft halo image (about 15.5% by 17.4%) sits behind the lockup. Belgian flag icon (about 3.0% by 5.0%) after the third bullet: vertical black, yellow and red tricolour bands. Five star bullets (★) in white, one per bullet line. Twitter bird icon (about 2.3% by 3.3%) in blue #1DA1F2, centred above a brace. Curly brace shape above the handle and another curly brace below it, both thin white lines. Mastodon icon (about 2.3% by 4.4%) in blue #2B90D9, centred below the lower brace. Bluesky butterfly icon (about 2.1% by 3.3%) in blue #0A85FF beside the first link. YouTube play-button icon (about 3.2% by 4.1%) in red #FF0000 beside the second link. LinkedIn 'in' square icon (about 2.1% by 3.7%) in blue #0A66C2 beside the third link. GitHub Octocat icon (about 2.4% by 4.1%) in white beside the fourth link.
Slide 3
Jose Gómez-Sellés
@kevindubois @jgomezselles
★
Senior Product Manager at Red Hat
○ OpenTelemetry
○ Distributed Tracing
○ Kepler
★
Based in Spain
★
Physicist, PhD in Materials Engineering
★
Programming (C++), Metal & SimRacing
github.com/jgomezselles
@jgomezselles
linkedin.com/in/joseluisgomezselles
Visuals: Photograph: a man with short hair and a beard, wearing a dark t-shirt, grey distressed jeans and a lanyard badge, standing and gesturing with his right hand while holding a microphone in his left hand, in front of a large wall-mounted screen showing a blue, purple and pink gradient with the text Observabilidad en OpenTelemetry con Trazas Distribuidas y Service Mesh. Left of him is a white wall-mounted cabinet with a shelf and a small table; a white door is at the right edge. Indoor lighting, cool and neutral tones, dominant colours white, grey, blue and purple. Framing is medium-wide, the photo is boxed with a slight drop shadow and not cropped to a circle. Red Hat fedora icon in red #EE0000 beside the first bullet. Spain flag emoji beside Based in Spain. Social icons: GitHub mark in white beside github.com/jgomezselles, Twitter bird in blue #1DA1F2 beside @jgomezselles, LinkedIn 'in' square in blue #0A66C2 beside linkedin.com/in/joseluisgomezselles. Logo group: Red Hat Developer wordmark with a stylised infinity swoosh in red, white and teal, separated by a thin vertical grey divider from the DevNation wordmark with a red hexagonal icon.
Slide 4
4
Session 1: The climate impacts of computing and communications - MIT: Climate & Sustainability Consortium.
https://www.youtube.com/watch?v=QpXpEivKp28
10
Transistors Are Not Getting More Efficient
Stuttering
Transistors per chip, '000 / Clock speed (max), MHz / Thermal design power*, w
Chip introduction dates, selected
Transistors bought per $, m
Log scale
4004 / 8086 / 386 / 486 / Pentium / Pentium II / Pentium III / Pentium 4 / Xeon / Core 2 Duo
Slowdown
Slowdown of Moore's Law and Dennard Scaling
General purpose microprocessors not getting faster or more efficient
Design specialized or domain-specific hardware
Explore new devices and materials for computing
1970 75 80 85 90 95 2000 05 10 15
Sources: Intel; press reports; Bob Colwell; Linley Group; IB Consulting; The Economist
*Maximum safe power consumption
Vivienne Sze http://sze.mit.edu/ @eems_mit
Dario Gil | IBM
Vivienne Sze | MIT
Jeff Dean | Google
@kevindubois @jgomezselles
Visuals: Chart on the slide: a log-scale line chart titled Stuttering with the subtitle legend Transistors per chip ('000, dark navy dots and line), Clock speed (max) MHz (light blue dots and line), and Thermal design power* w (olive grey dots and line). The x-axis runs from 1970 to 2015 in 5-year ticks labelled 1970 75 80 85 90 95 2000 05 10 15. The y-axis is logarithmic with ticks labelled 10^-1, 10, 10^3, 10^5 and 10^7, labelled Log scale at the top right. The navy transistor-count series rises steeply from about 1970 to about 2015, reaching roughly 10^7 at the right end. The light blue clock-speed series rises from about 1970 to about 2005 then flattens near 10^3. The olive thermal-power series rises from about 1990 to about 2005 then flattens near 10 to 20. Vertical red-outlined boxed labels mark chip introduction dates: 4004, 8086, 386, 486, Pentium, Pentium II, Pentium III, Pentium 4, Xeon and Core 2 Duo. A red ellipse outline encircles the flattened right-hand portion of the blue and olive series, labelled Slowdown in red text. Inset line chart at top left titled Transistors bought per $, m, with y-axis ticks 0, 5, 10, 15, 20 and x-axis ticks 2002 04 06 08 10 12 15; the olive-grey line rises from about 2 in 2002 to about 20 around 2012 then dips slightly. No other values are printed. Other visuals: three video participant tiles (Dario Gil at IBM in a dark suit with hand at chin, Vivienne Sze at MIT in front of a domed white building with a striped top, Jeff Dean at Google in a grey shirt looking down), each tile boxed with a blue rounded name label. A small globe icon and a blue Twitter bird icon sit beside the footer text. The MIT logo sits at bottom right of the slide panel. The background behind the frame is a dark space-like image with blurred city-light speckles.
Slide 5
@kevindubois @jgomezselles
Red Hat Developer
DevNation
“If we continue with the existing trajectory of compute energy, by 2040,
we are supposed to hit the world’s energy production capacity.The
increase in compute energy and demand has been increasing at a much
faster rate than the world energy production capacity increase”
- Bilge Yildiz
Breene M. Kerr Professor in the MIT departments of Nuclear Science and
Engineering and Materials Science and Engineering
https://climate.mit.edu/posts/how-can-we-reduce-carbon-footprint-global-computing
Visuals: Logo lockup at top right: the Red Hat Developer logo (red and multicoloured infinity-loop mark with the words 'Red Hat' over 'Developer' in white) followed by a thin vertical white divider and the DevNation logo (red hexagonal emblem with 'Dev' in red and 'Nation' in white). The image is 1078 by 248 pixels, placed at x 77.6%, y 1.3%, w 20.4%, h 8.3%. No photographs, charts or diagrams.
Slide 6
Reduce Energy / Consumption / You, caring / about the planet / Your CFO / @kevindubois @jgomezselles / 6
Visuals: Photograph (meme-style painted illustration, boxed, not full-bleed): two forearms clasp in a high-five-like handshake against a dark, cloudy grey-blue sky with olive-green streaks. The left arm is a grey-sleeved shirt arm with a dark brown forearm and fist. The right arm has a red-orange sleeve and a skin-toned muscular forearm and fist. The image is not cropped inside its frame, and the edges are sharp. Lighting is dramatic, from the upper left, with strong highlights on the fists and forearms. Dominant colours are charcoal grey, slate blue, dark brown, orange-red and warm skin tones. Overlaid labels, white sans-serif, are burned into the image: 'Reduce Energy Consumption' centred over the top fist; 'You, caring about the planet' rotated about 35 degrees counter-clockwise along the left arm; 'Your CFO' rotated about 30 degrees counter-clockwise along the right arm. A small faint artist signature sits at the bottom right corner of the painting. A placed image at top right (1078 by 248 pixels) is not visible in the render against the dark background; its content cannot be read. No charts, tables or logos.
Slide 7
What factors are leading you to overspend? / Select all that apply. / Overprovisioning—for example, workloads / using more resources than necessary / 70% / Lack of individual or team-level / awareness or responsibility / 45% / Sprawl—such as resources not / deactivated after use / 43% / Technical debt—existing workloads not / re-architected for scalability of cloud / 43% / Lack of visibility and insight into / consumption, budget and spending / 40% / Presence of resource-hungry workloads / 25% / Fluctuating consumption demands / 23% / Poor planning and prediction / on cloud consumption / 23% / Absence of centralized, consistent or / standardized processes and/or tools for insight / and action across all our cloud providers / 20% / Availability of a self-service infrastructure / 15% / Red Hat Developer / DevNation / @kevindubois @jgomezselles / https://www.cncf.io/blog/2023/12/20/cncf-cloud-native-finops-cloud-financial-management-microsurvey/
Visuals: Horizontal bar chart (image, 901 by 750 px) titled 'What factors are leading you to overspend?' with subtitle 'Select all that apply.' No axis lines or axis tick labels are printed; each bar is labelled at left by its factor and at right by its printed percentage. Ten bars, ordered by value from largest to smallest: Overprovisioning—for example, workloads using more resources than necessary 70%; Lack of individual or team-level awareness or responsibility 45%; Sprawl—such as resources not deactivated after use 43%; Technical debt—existing workloads not re-architected for scalability of cloud 43%; Lack of visibility and insight into consumption, budget and spending 40%; Presence of resource-hungry workloads 25%; Fluctuating consumption demands 23%; Poor planning and prediction on cloud consumption 23%; Absence of centralized, consistent or standardized processes and/or tools for insight and action across all our cloud providers 20%; Availability of a self-service infrastructure 15%. Bar lengths are proportional to the printed values. Highlighted points: four rows are enclosed in red rectangular outlines, namely Overprovisioning (70%), Sprawl (43%), Fluctuating consumption demands (23%) and Poor planning and prediction on cloud consumption (23%). No legend. Bars are light cyan with bold black percentage values at the bar ends. Image is not cropped and is boxed with a thin white border on a blue field.
Slide 8
@kevindubois @jgomezselles
STACK LAYERS
POTENTIAL OPPORTUNITIES
Applications/algorithms
Runtime systems
Systems
Compilers
Architecture
Circuits
Devices and manufacturing
Carbon-aware load balancing
Reliability (longer lifetime)
Operational energy minimization
Scale down hardware
Specialized hardware
Data center heterogeneity
Lower footprint circuit design
Scheduling workloads
https://tech.facebook.com/engineering/2021/3/sustainable-computing/
8
Visuals: One diagram, a flow-style connector diagram rendered as a raster image (2048 by 1152 px) inside a white panel. Left column: seven rounded rectangles labelled Applications/algorithms (purple), Runtime systems (blue), Systems (teal), Compilers (lilac), Architecture (light blue), Circuits (orange), Devices and manufacturing (slate). Right column: eight light grey rounded rectangles labelled Carbon-aware load balancing, Reliability (longer lifetime), Operational energy minimization, Scale down hardware, Specialized hardware, Data center heterogeneity, Lower footprint circuit design, Scheduling workloads. Each line is a thin orthogonal connector (about 2 px) in the colour of its source layer, with right-angle bends, running from the right edge of a layer bar to the left edge of an opportunity box. Approximate links (estimated from the image): Applications/algorithms to Operational energy minimization and to Specialized hardware; Runtime systems to Carbon-aware load balancing and to Scheduling workloads; Systems to Scale down hardware and to Data center heterogeneity; Compilers to Operational energy minimization; Architecture to Reliability, Scale down hardware, Specialized hardware and Data center heterogeneity; Circuits to Specialized hardware and to Lower footprint circuit design; Devices and manufacturing to Reliability. No photographs, logos or icons are visible in the render. Nothing is highlighted beyond the colour coding.
Slide 9
Traditional Deployments
@kevindubois @jgomezselles
overprovisioned &
wasting resources
Requests
Capacity
underprovisioned &
unhappy users!
20000
15000
10000
5000
0
8
10
12
14
16
18
20
Visuals: One area/line chart inside a white rectangle. Title: none printed. X axis: ticks labelled 8, 10, 12, 14, 16, 18, 20 (no unit or axis title), range about 8 to 21, with vertical light grey gridlines at each tick. Y axis: ticks labelled 0, 5000, 10000, 15000, 20000 (no unit or axis title), range 0 to about 24000, with horizontal light grey gridlines. Series 1, 'Requests' (blue line #4A86E8 with translucent light blue fill, drawn smooth): no printed values; about 1000 at x=8, about 15200 at x=11, about 12000 at x=12, about 20000 at x=13 (highlighted peak where it rises above capacity), about 10000 at x=14, about 0 from x=16 to x=19, about 5200 at x=20.2, about 4000 at x=21. Series 2, 'Capacity' (flat orange line #FF9900, about 3 px thick) at about 18000 across the full range, with the area below it filled light orange #FFE0B2. Legend: top centre of the panel, a blue square #4A86E8 labelled Requests and an orange square #FF9900 labelled Capacity. Highlighted points: the Requests peak near x=13 that rises above the Capacity line. Two red hand-drawn block arrows (#EE0000 fill with thin dark outline): the left arrow runs from above the text 'overprovisioned &' down-right, ending at about x=9.5, y=18000, pointing at the Capacity line. The right arrow runs from the text 'underprovisioned &' down-left, ending at the Requests peak near x=13, y=19500. Lighting: none (flat graphic). Dominant colours: white, light orange, blue, red.
Slide 10
Serverless
Requests
Capacity
25000
20000
15000
10000
5000
0
8
10
12
14
16
18
20
Use only what you need!
with Serverless
@kevindubois @jgomezselles
Visuals: One area chart (line-and-fill chart) inside a white panel. Title: none printed. Legend at top centre of the chart: blue square labelled Requests, orange square labelled Capacity. X axis: numeric labels 8, 10, 12, 14, 16, 18 and 20 (the last two partly hidden behind the red pill), no unit printed, range about 8 to 20. Y axis: labels 0, 5000, 10000, 15000, 20000, 25000, no unit printed, range 0 to 25000, horizontal light grey gridlines at each 5000 and vertical light grey gridlines at each x label. Series Requests (blue line #4285F4 with light blue-grey fill beneath): about 1000 at x 8, about 5000 at x 10, about 15200 at x 11.2, about 12000 at x 12, about 20000 at x 13, about 10000 at x 14, about 5500 at x 15, about 0 from x 16 to x 19, about 5200 at x 20.2, about 4000 at x 20. Series Capacity (orange line #FF9800 with light orange fill above the Requests fill): about 2000 at x 8, about 16500 at x 11.2, about 14900 at x 12, about 22000 at x 13, about 13000 at x 14, about 3000 at x 16, about 0 around x 17 to 19, about 6200 at x 20.2, about 5000 at x 20. Highlighted points: three light blue dotted arrows with filled triangular heads (#29ABE2 approx) point to the Capacity peak near x 13 at about 22000, to the Capacity point near x 14 at about 15000, and to the zero-value region near x 18.9. The arrows start from the dotted black annotation box. The area fills are semi-transparent, and the Requests fill overlaps the Capacity fill, which is drawn above it.
Slide 11
Red Hat Developer / DevNation
@kevindubois @jgomezselles
Knative
https://github.com/knative
Visuals: Logo: Knative mark, a large blue heptagon (about #0066B3 fill) containing a white bold lowercase 'k', overlapped at its upper-right by a smaller lighter blue heptagon (about #6A93C8 fill) containing a white lowercase 'n'; the smaller shape overlaps the larger one's upper-right edge with no outline. Logo: Red Hat Developer lockup in white with a multicoloured infinity-style swoosh (red, orange, green, blue arcs) above the word 'Developer' in bold; a thin vertical white divider line separates it from the DevNation logo, a red hexagon outline containing an 'A'-like chevron followed by 'DevNation' with 'Dev' in red and 'Nation' in white. No photographs, charts or other graphics.
Slide 12
@kevindubois @jgomezselles
●
Brings serverless capabilities to Kubernetes
●
Out-of-the box autoscaling, even down to 0
●
Built in load balancer
●
Server complexity abstracted away
●
…
Visuals: Top-left logo mark: a large blue polygon (heptagon-like, about #0066B3) at x 0 to 23%, y 0 to 33%, with a bold white lowercase 'k' centred on it. Overlapping its upper-right edge is a smaller muted blue-grey polygon (about #6A96C9) with a bold white lowercase 'n', positioned at about x 15 to 33%, y 0 to 18%. Both shapes are flat with no shadow. Top-right logo: Red Hat Developer lockup (white 'Red Hat' over bold 'Developer' with a multicoloured infinity-style swoosh) at x 77.6%, y 1.3%, w 20.4%, h 8.3%, followed by a thin vertical white divider and the DevNation logo (red hexagon icon with 'Dev' in red and 'Nation' in white). No photographs, charts or tables.
Slide 13
AUTOSCALE TO 0 / THAT MEANS NO / POWER USAGE RIGHT? / RIGHT!? / imgflip.com / @kevindubois @jgomezselles / Red Hat Developer / DevNation
Visuals: Photograph-based meme in a 2x2 grid of four square-ish panels, boxed (not full-bleed), with no rounded corners. Top-left panel: a young man with brown tousled hair, frowning and looking sideways, against blurred green grass. Top-right panel: a smiling young woman with curly auburn hair and a green headband with pink flowers, wearing a mesh head covering, lit softly. Bottom-left panel: the same young man looking sideways with a smirk, grass background. Bottom-right panel: the young woman with a serious, questioning expression, mouth slightly open. Bold white uppercase condensed caption text overlaid on the panels: 'AUTOSCALE TO 0' across the bottom of the top-left panel, 'THAT MEANS NO POWER USAGE RIGHT?' across the bottom of the top-right panel, and 'RIGHT!?' across the bottom of the bottom-right panel. A small grey 'imgflip.com' watermark sits bottom-left of the bottom-left panel. Lighting is natural and even. Dominant colours: green, skin tones, brown and dark grey. Knative logo: a large blue heptagon-like hexagon (#0066B3 approx.) with a white bold lowercase-style 'K' letter, overlapped by a smaller lighter blue (#6A98CC approx.) octagon containing a white lowercase 'n'. Red Hat Developer logo: white 'Red Hat' and bold 'Developer' wordmark with a multicolour infinity-style swirl (red, green, blue, orange) in white-grey text. DevNation logo: red hexagon-A icon followed by 'DevNation' with 'Dev' in red and 'Nation' in white. A thin vertical grey divider separates the two corner logos.
Slide 14
Red Hat Developer / DevNation / @kevindubois @jgomezselles / concurrent requests / count = N / activator on/off / Activator / autoscaler / HTTP Router / traffic split (Revision assignment) / Kubernetes apiserver / ReplicaSet / concurrent requests / Queue-Proxy / User container / containerConcurrency / Pod / https://knative.dev/docs/serving/architecture/
Visuals: One architecture diagram on a white panel, drawn with flat boxes, arrows and labels. A yellow smiley-face user icon (fill #FFE699, black outline) at the left points with a grey arrow to the blue box 'HTTP Router' (fill #0066B3, white text). A thick grey line leaves HTTP Router to the right and splits: an upper branch with a grey arrow enters 'Activator' (fill #0066B3, white text), and a lower branch runs down and right with a grey arrow into 'Queue-Proxy'. Below HTTP Router, a caption reads 'traffic split' over '(Revision assignment)' in monospace. A dashed black arrow runs from 'Kubernetes apiserver' back left to HTTP Router's top area, labelled 'activator on/off'; a dashed arrow from HTTP Router top rises to Activator's left side. From Activator a solid grey line goes right and down, then left back to the thick line, forming a loop. 'Activator' has a dashed line rising from its top, labelled 'concurrent requests', that runs right and down into 'autoscaler' (fill #6699CC, white text, thin green-grey outline). A dashed line labelled 'count = N' runs from autoscaler left and down into 'Kubernetes apiserver' (fill #6699CC, white text). A dashed line from the apiserver's bottom runs left and down to a light-blue cloud labelled 'ReplicaSet' (white fill, light-blue outline, grey text). A second dashed arrow labelled 'concurrent requests' runs from the top of a blue-outlined rounded rectangle labelled 'Pod' (outline #1F6FB2, 1 px stroke, label 'Pod' in blue at bottom right) up to autoscaler's bottom, with a dashed arrow pointing up into autoscaler. Inside the Pod rectangle, 'Queue-Proxy' (fill #0066B3, white text) has a solid grey arrow to 'User container' (fill #C27016 orange, white text), and the monospace label 'containerConcurrency' sits under Queue-Proxy. Diagram lines are dark grey #404040 and dashed lines are black. Image is flat, sharp and not cropped.
Slide 15
Red Hat / Developer / DevNation / @kevindubois @jgomezselles / “To measure is to know” / Printed on the photographed panel: V / AMPERES / 10 / 20 / 30 / AUTO DIESELS Ltd. / UXBRIDGE / MADE IN ENGLAND / DZ47-63 / C16 / 240/415V~ / 50/60Hz / EN60898 / I·ON / OFF / TEST / 100 / 200 / 300 / FAITHFUL / MODEL / CLASS 2.5
Visuals: One photograph, full-bleed, covering 100% by 100% of the slide (2048 by 1429 pixels). Subject: a close-up, top-down view of an old wooden electrical distribution panel mounted on dark grey ground. Upper left: a round black two-pin socket with a ribbed collar and two screws. Upper centre: a round black-rimmed analogue voltmeter with a cream dial, scale marked 100, 200 and 300, a 'V' symbol with an AC wave symbol, the word FAITHFUL printed above the dial, and a red needle at about 200. Upper right: a grey-green UK-style switched wall socket with a rocker switch and two rectangular outlets. Far right: a yellow-wrapped white miniature circuit breaker labelled DZ47-63, C16, 240/415V, 50/60Hz, EC60898, with a blue toggle set to I·ON. Middle left: a round black rotary switch on a dark round plate. Lower left: a round dark plate with an orange cable entering an orange plug-grip. Lower centre: a round black-rimmed ammeter with a cream dial labelled AMPERES, scale 0 to 30 with marks at 10 and 20, the printed line AUTO DIESELS Ltd. / UXBRIDGE and the small line MADE IN ENGLAND, and a black needle near zero. Lower right: a brown rectangular socket plate with three round holes and a rocker switch. Bottom right corner: a few more round holes in the wood. Composition is a flat, straight-on frame with the panel filling the image. Lighting is even and diffuse with soft shadows. Dominant colours are dark chocolate-brown wood, black metal, cream-white dials, grey-green and yellow accents, and one orange cable. The photograph is not cropped beyond the frame edges, is not boxed, and has a dark overlay band across the middle. A black fill at 53% opacity sits over the photo in the band region. Logo: Red Hat Developer lockup (white Red Hat Display wordmark with a multicoloured swirl symbol) separated by a thin vertical white rule from the DevNation logo (white wordmark with a red-outlined circular icon). Both are white with coloured accents.
Slide 16
Red Hat Developer / DevNation / @kevindubois @jgomezselles / Kubernetes-based Efficient Power Level Exporter
Visuals: One image: the Kepler project logo, a white rectangular picture (about 223 by 150 px) showing a black outlined horizontal ellipse enclosing a yellow hand-drawn sun with radiating rays on the left side, with the word KEPLER in outlined capital letters with wide letter-spacing beneath the ellipse. The image is boxed, not full-bleed, with sharp corners and no shadow. Top-right: Red Hat Developer logo (red/teal/yellow infinity-style mark with bold Developer wordmark) followed by a thin vertical grey divider and the DevNation logo (red hexagon icon with DevNation wordmark, 'Dev' in red and 'Nation' in white). Colours: white, black, yellow #F5C242, red.
Slide 17
Red Hat Developer / DevNation / @kevindubois @jgomezselles / Kepler / Kepler (Kubernetes-based Efficient Power Level Exporter) that offers a way to estimate power / consumption at the process, container, and Kubernetes pod levels. / Kepler provides granular power consumption data for Kubernetes Pods and Nodes. / It uses eBPF to collect energy-related system stats and export them. / RAPL and ACPI when available or trained models for specific hardware otherwise. / Kepler was accepted to CNCF on May 17, 2023 and is at the Sandbox project maturity level. / We are here! / Graduated / Incubating / Sandbox / Innovators / Early adopters / Early majority / Late majority / Laggards
Visuals: One hand-drawn style illustration of a technology adoption curve (diffusion of innovations), boxed as a rectangular image at about x 20%, y 52.6%, 60.5% by 41.6% of the slide. A white sketched bell curve rises from left to right, peaking near the centre-right, and falls to a small arrowhead pointing right at the far end. The curve is divided into segments with hatched fills: Innovators (brick-red fill with pink hatching, small), Early adopters (brown fill box with blue outline, adjacent to Innovators), Early majority (dark teal label box with green hatched segment), Late majority (dark navy label box with purple hatched segment), and Laggards (grey-white hatched segment with a black label box). Above the curve, the handwritten labels read Graduated (peak, top centre), Incubating (above the Early adopters segment) and Sandbox (on the left, with an arrow pointing to the curve). A handwritten note reading We are here! sits at the upper left with a looping arrow pointing to Sandbox. Label boxes are small rounded rectangles with dark fills and thin white or coloured outlines. The overall tone is dark background with white and muted pastel strokes. No photograph, chart axes or legend. No logos inside the diagram.
Slide 18
Kepler & eBPF: kprobes / @kevindubois @jgomezselles
Visuals: One hand-drawn style architecture diagram, placed as a 641 by 561 px image, showing three stacked horizontal bands in a vertical flow. Top band 'User Space' (blue-grey rounded outline, dark slate fill with diagonal hatching) contains a box labelled 'Process' (purple outline) and a box labelled 'Syscall' (purple outline). Two arrows connect them: a downward arrow from Process to Syscall on the left and an upward arrow from Syscall to Process on the right. Middle band 'Linux Kernel' (orange-brown rounded outline, dark brown hatched fill) contains a box labelled 'Scheduler' (red outline, dark red fill). A downward arrow runs from Syscall (bottom of the User Space band) into Scheduler. Bottom band 'HW' (blue rounded outline, dark slate hatched fill) contains a box labelled 'CPU' (purple outline) with a white line icon of a CPU chip to its left. A downward arrow runs from Scheduler to CPU. Band labels 'User Space', 'Linux Kernel' and 'HW' are white hand-lettered text, rotated 90 degrees clockwise, on small black rectangles at the left edge of each band. Lines are white or pale grey, sketchy and slightly wobbly. The diagram is not cropped and sits unboxed on the background.
Slide 19
Red Hat Developer / DevNation / Kepler & eBPF: kprobes / @kevindubois @jgomezselles / User Space / Process / Syscall / Linux Kernel / Scheduler / kprobe__finish_task_switch / processes Table / pid / cgroupid / cpu_cycles / cache_misses / HW / CPU
Visuals: A hand-drawn-style architecture diagram with sketchy black-and-coloured outlines. Three large rounded containers on the left stack top to bottom: User Space (blue outline, dark fill), Linux Kernel (orange-brown outline, dark brown fill), and HW (blue outline, dark fill). Inside User Space, a Process rounded box sits above a Syscall rounded box (purple outline); a downward arrow runs from Process to Syscall and an upward arrow runs back from Syscall to Process. A downward arrow runs from Syscall into the Scheduler box in Linux Kernel (red outline). A rightward arrow runs from Scheduler to a red-outlined pill labelled kprobe__finish_task_switch, which has a small bee/firefly icon at its upper-left corner. A curved arrow runs from the top edge of the kprobe pill up and right to the pid field of a table. The table is titled processes Table in bold white text on a black header bar, with white outline, and lists pid, cgroupid, cpu_cycles and cache_misses as rows (pid is the key row to which the arrow points). Inside HW, a purple-outlined box contains a CPU icon (a white line-drawn microchip) and the label CPU. A downward arrow runs from Scheduler to the CPU box. Vertical black label tabs with white rotated text read User Space, Linux Kernel and HW. Logos: Red Hat Developer (white wordmark with multicolour swoosh) and DevNation (red hexagon icon with white and red wordmark) at top right, separated by a thin vertical grey rule.
Slide 20
Red Hat Developer / DevNation / Kepler & eBPF: kprobes / @kevindubois @jgomezselles / User Space / Process / Syscall / Linux Kernel / Scheduler / kprobe__finish_task_switch / processes Table / pid / cgroupid / cpu_cycles / cache_misses / HW / CPU / https://sustainable-computing.io/design/metrics/
Visuals: Hand-drawn style architecture diagram on the left, with three stacked bands. Top band, labelled User Space in a black vertical tab on its left edge: a rounded rectangle labelled Process, a downward arrow to a rounded rectangle labelled Syscall, and an upward arrow from Syscall back to Process. Middle band, labelled Linux Kernel in a black vertical tab: a rounded rectangle labelled Scheduler (red-tinted fill) with a downward arrow from Syscall into it and a rightward arrow from Scheduler to a red-outlined rounded rectangle labelled kprobe__finish_task_switch, which has a small bee/bug icon overlapping its top-left corner. Bottom band, labelled HW in a black vertical tab: a rounded rectangle containing a CPU chip icon and the label CPU, with a downward arrow from Scheduler to it. A curved white arrow runs from the top edge of the kprobe box up and right to the pid field of the table. Processes table at upper middle: black header bar reading processes Table, with rows pid, cgroupid, cpu_cycles and cache_misses in small white sans-serif text, drawn with white hand-sketched borders on a dark background. Logo at top right: the Red Hat Developer logo (white text with a red hat-style arc mark) followed by a thin vertical divider and the DevNation logo (red hexagon icon with white and red wordmark). Colours are muted: boxes have dark charcoal fills with blue, purple, orange and red sketched outlines, and the kprobe and Scheduler boxes are red-tinted.
Slide 21
Red Hat / Developer / DevNation / Kepler & eBPF: kprobes / @kevindubois @jgomezselles / User Space / Process / Syscall / Linux Kernel / Scheduler / kprobe__finish_task_switch / processes Table / pid / cgroupid / cpu_cycles / cache_misses / HW / CPU / CORE (CPU) / DRAM / UNCORE / OTHER / RAPL / https://sustainable-computing.io/design/metrics/
Visuals: Hand-drawn sketch-style architecture diagram (image 641 by 561 px, boxed, no crop) on the left. Three rounded-rectangle bands with thin blue/grey outlines and subtle diagonal hatching: top band 'User Space' containing a rounded box 'Process' above a rounded box 'Syscall', with a down arrow Process to Syscall and an up arrow Syscall to Process; middle band 'Linux Kernel' (outlined in dark gold) containing a red-outlined rounded box 'Scheduler' with a right arrow to a red-outlined rounded box 'kprobe__finish_task_switch' carrying a small blue and yellow beetle icon at its top-left corner, and a down arrow from Syscall to Scheduler; bottom band 'HW' (blue outline) containing a rounded box 'CPU' with a line-drawn chip icon, reached by a down arrow from Scheduler. A curved white arrow runs from the top edge of the kprobe box up to the pid field of the processes table. Black vertical label tabs carry the band names rotated 90 degrees. Image 636 by 314 px, boxed, placed at upper middle: a table titled 'processes Table' with a black header bar containing bold white centred text, then rows 'pid' (left column, 'pid' label), 'cgroupid', 'cpu_cycles', 'cache_misses' in small white sans-serif text on a dark background with thin white hand-drawn borders. Image 395 by 201 px, boxed, lower middle: a hand-drawn curly brace in white opening to four right-aligned white hand-lettered labels 'CORE (CPU)', 'DRAM', 'UNCORE', 'OTHER', pointing to a large light-blue (#BFDBFE) document icon with three horizontal bars inside and a folded top-right corner; a black tab under the icon holds the white label 'RAPL'. Logo image 1078 by 248 px at top right: Red Hat Developer wordmark in white with a multicolour infinity-style swoosh (red, orange, teal) and a thin vertical white divider, followed by a red DevNation wordmark with a red hexagon icon.
Slide 22
Red Hat Developer / DevNation / @kevindubois @jgomezselles / Kepler & eBPF: kprobes / User Space / Process / Syscall / Linux Kernel / Scheduler / kprobe__finish_task_switch / processes Table / pid / cgroupid / cpu_cycles / cache_misses / HW / CPU / Kepler / Metrics exporter / Compute ratio / CORE (CPU) / DRAM / UNCORE / OTHER / RAPL / https://sustainable-computing.io/design/metrics/
Visuals: Hand-drawn style architecture diagram plus two logos. Left stack: a blue-outlined rounded panel labelled User Space containing a pink-outlined box Process above a pink-outlined box Syscall, with a double-headed arrow between them; a dark-yellow-outlined rounded panel labelled Linux Kernel containing a red-outlined box Scheduler with a right arrow to a red-outlined pill kprobe__finish_task_switch that has a bee/bug icon on its top-left corner; a blue-outlined panel labelled HW containing a pink-outlined box CPU with a chip icon; arrows run down from Process to Syscall, Syscall to Scheduler and Scheduler to CPU. A curved white arrow runs from the kprobe pill up to the processes table. Centre: a black-headed table titled processes Table with rows pid, cgroupid, cpu_cycles and cache_misses, values not shown; a line runs from its bottom edge down and right to the Compute ratio icon. Right: a purple-outlined rounded panel titled Kepler containing a green-outlined rounded rectangle Metrics exporter; an arrow goes from Compute ratio up to Metrics exporter and from Metrics exporter right to a Prometheus flame logo, an orange-red circle (#E6522C) with white flame and base. Compute ratio is a blue (#4285F4) document-with-gear icon with a dark gear, labelled Compute ratio on a black label. Bottom-left: a white curly brace points to a light-blue (#BBDEFB-like) document icon with three horizontal bars labelled RAPL; the brace list reads CORE (CPU), DRAM, UNCORE, OTHER. A line from RAPL goes right and up into Compute ratio. Logo lockup top-right: Red Hat Developer wordmark with a red-orange-blue infinity-style mark, a thin vertical divider and a DevNation wordmark with a red hexagon icon.
Slide 23
@kevindubois @jgomezselles / Red Hat Developer / DevNation / Node / Pod (W) / Namespace (W) / kWh / Namespace A / Pod 1 / Pod 2 / Namespace B / Pod 3 / Syscall / Creates / eBPF: Compute energy / Kernel / Scheduler / Kepler / Program generator / Metrics exporter / Expose metrics
Visuals: Hand-drawn sketch-style architecture diagram on a dark background. Shapes: a large rounded rectangle labelled Node with a thin dark amber outline spanning about 9.8 to 77 percent of width and 6 to 91 percent of height. Inside it, Namespace A is a blue-outlined rounded box containing two green-outlined rounded boxes labelled Pod 1 and Pod 2. Namespace B is a blue-outlined rounded box containing one green-outlined box labelled Pod 3. A red-outlined rounded Kernel box contains a purple-outlined box labelled eBPF: Compute energy with a small bee emoji above the text, and below it a red-outlined box labelled Scheduler. A purple-outlined rounded Kepler box contains two green-outlined boxes labelled Program generator and Metrics exporter. A black rounded panel with white sketch outline at top right contains three small charts: Pod (W) with a red line and green fill band, Namespace (W) with a red dashed step line, and kWh with blue vertical spikes on a dark baseline; no axes, ranges or values are printed. An orange-red Prometheus flame logo sits in the middle right on a dark background. Arrows (white hand-drawn lines with arrowheads): from Pod 1 and Pod 2 down to the eBPF box, labelled Syscall on the Pod 1 line; from Pod 3 down-left to the eBPF box; from the eBPF box down to the Scheduler; from the Creates label to the eBPF box and on to Program generator; from the Metrics exporter up to the Prometheus logo; from the Prometheus logo curving up to the black chart panel; from the eBPF box curving down-right to the Metrics exporter, labelled Expose metrics. Logos: Red Hat Developer wordmark with a Red Hat ribbon-style swirl, DevNation logo with a red hexagon, and the Prometheus flame icon in orange-red #E6522C.
Slide 24
Red Hat Developer / DevNation / @kevindubois @jgomezselles / So… is Serverless Powerfully Powerless?
Visuals: Logo lockup top-right: the Red Hat Developer logo (white 'Red Hat' and bold 'Developer' wordmark with a multicoloured infinity-style red, teal, yellow and blue loop mark) followed by a thin vertical white divider line and the DevNation logo (red hexagon with a stylised 'A' mark followed by the wordmark 'DevNation' where 'Dev' is red and 'Nation' is white). Below the logos is the text '@kevindubois @jgomezselles' in white. No photographs, charts or diagrams.
Slide 25
Deployment 1 with istio / @kevindubois @jgomezselles / Red Hat Developer / DevNation / serverfull-ns / Traffic generator / istio-proxy / Istio / OTLP / monitoring-ns / Grafana / Kepler / istio-proxy / server-mock / istio-proxy / server-mock / ... / istio-proxy / server-mock
Visuals: Diagram, hand-drawn style (sketchy, Excalidraw-like outlines). Shapes: (1) a large rounded rectangle labelled serverfull-ns with dark charcoal fill, diagonal hatching and a dark amber outline; (2) inside it at top, a blue-outlined rounded box containing a green-outlined box labelled Traffic generator, and below that a green-outlined box labelled istio-proxy, with the Istio sailboat logo (blue #326CE5 sail) and small grey label Istio to its lower left; (3) a row of three blue-outlined rounded boxes at bottom, each with a green-outlined istio-proxy box above a green-outlined server-mock box, except the middle position which is a small blue-outlined box containing ... ; (4) a square icon with blue hatched background containing the OpenTelemetry Collector logo (blue telescope-like icon with orange ends) ; (5) a red-outlined rounded box labelled monitoring-ns containing the orange Prometheus flame logo; (6) the Grafana logo (orange swirl with gradient from orange-red to light orange) with grey Grafana wordmark; (7) a purple-outlined rounded box labelled Kepler containing a white rectangle with the Kepler logo (black oval outline, orange sun, grey letters KEPLER). Connectors: white hand-drawn arrows. Traffic generator to istio-proxy is a short vertical arrow; istio-proxy has a line going down that splits horizontally into three arrows pointing down to the three workload boxes; a horizontal arrow labelled OTLP runs from the traffic generator box to the collector icon; a horizontal arrow runs from the collector to the Prometheus logo in monitoring-ns; an arrow runs from monitoring-ns to the Grafana logo; a vertical arrow runs from the Kepler box up to monitoring-ns.
Slide 26
Deployment 2: serverless / Red Hat Developer / DevNation / @kevindubois @jgomezselles / serverless-ns / Traffic generator / OTLP / monitoring-ns / Grafana / Kepler / KEPLER
Visuals: Architecture diagram drawn in a hand-sketched style with slightly wobbly rounded outlines and hatched fills. Shapes and connections: (1) a large rounded rectangle labelled serverless-ns with a green outline (#3C7A2E) containing the items below. (2) A blue-outlined rounded box (#4A6FB5) holding a smaller green-outlined rectangle labelled Traffic generator. A line leaves its right side, labelled OTLP, and bends down and right with an arrowhead into the collector icon. A line leaves its bottom and runs down with an arrowhead to a Kubernetes-style blue hexagon with a white K and a small light-blue octagon with a white n (Knative-style badge). From the hexagon a horizontal arrow runs right to a stack of overlapping rounded rectangles outlined in blue (#3D5A9E) with a small ellipsis. (3) OpenTelemetry collector icon: a blue (#3B4FC4) and orange (#F5A623) telescope-like glyph on a blue hatched square (#1A3F6E). A horizontal arrow runs from its right edge to the monitoring-ns box. (4) A red-outlined rounded box (#E0524A) with dark red hatched fill (#2A1E1E) labelled monitoring-ns, containing the Prometheus logo: an orange-red (#E6522C) circle with a white flame and bars. A horizontal arrow runs from its right edge to the Grafana logo: an orange gradient swirl (#F46800 to #F8B26A) above a grey (#6E6E6E) Grafana wordmark. (5) A purple-outlined rounded box (#8E7CB8) with dark fill labelled Kepler, containing a white rectangle with a black ellipse outline, an orange sun and the grey outlined word KEPLER. A vertical arrow runs up from Kepler's top edge to the bottom of monitoring-ns. All connectors are thin white lines (about 1 px) with open arrowheads.
Slide 27
Experiment 1
@kevindubois @jgomezselles
Red Hat Developer
DevNation
● HTTP/2, 2000 RPS over 1 connection
● Alternating CronJobs every ½ hours
● 20 mins each
● Serverfull: 6 instances
● Knative
○ Max scale: 6
○ Concurrency: 4
server-full-ns
monitoring-ns
Kepler
KEPLER
Grafana
OTLP
istio-proxy
Traffic generator
Istio
istio-proxy
server-mock
istio-proxy
server-mock
...
istio-proxy
server-mock
serverless-ns
OTLP
Traffic generator
n
K
Visuals: Hand-drawn style architecture diagram on a dark background. Left group 'serverfull-ns' (dark rounded rectangle with thin olive-gold outline) contains an alarm clock icon in blue, a 'Traffic generator' box with an Istio sailboat logo and an 'istio-proxy' box beneath it, an OTLP-labelled arrow running right to an OpenTelemetry collector icon (blue/orange). From the istio-proxy, arrows fan out down to three pods, each with 'istio-proxy' over 'server-mock', plus a middle '...' placeholder box. Right of the collector, a line runs to a vertical connector up to the monitoring-ns box (red-outlined dark rounded square containing a Prometheus flame icon in orange-red, label 'monitoring-ns'). A Grafana logo sits above it with an upward arrow into Grafana. A Kepler box (purple outline) with a 'KEPLER' logo (sun icon in ellipse) connects with an arrow into monitoring-ns. Group 'serverless-ns' (dark rounded rectangle with green outline) contains an alarm clock icon, an OpenTelemetry collector icon with an OTLP arrow from a 'Traffic generator' box, an arrow from the collector to a stack of pods, and an arrow from a Knative 'n' blue hexagon logo with 'K' Kubernetes logo, which receives from the Traffic generator downward arrow. Lines are thin white/grey with arrowheads.
Slide 28
datasource / prometheus / time_interval / 1h / Real time Power consumption (W) / serverless / serverfull / ServerfullRequests/s / Serverless Requests/s / 0 / 2001 / Requests/s / Serverless / Serverfull / Serverless real time Power consumption (W) / knative-serving / knative-serving-ingress / openshift-serverless / serverless-ns / Total serverless / Serverfull real time Power consumption (W) / istio-system / serverfull-ns / Total serverfull / Serverless Total Energy Consumption (kWh) 1h / 0.0532 kWh / Serverfull+Istio Energy Consumption (kWh) 1h / 0.0368 kWh / Energy consumption (kWh) (per 1h) / serverless / serverfull / Real time Power consumption (W) / CORE / PKG / UNCORE / DRAM / OTHER / @kevindubois @jgomezselles
Visuals: Grafana dashboard with several charts. (1) Real time Power consumption (W): filled line chart, y-axis Power (W) 20 to 100, x-axis time 08:50 to 09:45 in 5-minute ticks. Series serverless (green) about 95 W from 08:45 to 08:51, drops to about 32 W until 09:31, then returns to about 97 W to 09:45. Series serverfull (yellow) about 23 W, rises to about 62 W from 09:02 to 09:21, then returns to about 23 W. Legend top right: serverless green, serverfull yellow. (2) Gauges: ServerfullRequests/s shows 0; Serverless Requests/s shows 2001, green arc. (3) Requests/s: filled area chart, y-axis Requests/s 0 to 2000, x-axis 08:50 to 09:40. Serverless green plateau at 2000 before 08:52, zero from about 08:57 to 09:00, returns to 2000 at about 09:35 to 09:40. Serverfull yellow plateau at 2000 from about 09:05 to 09:20, zero otherwise. Legend: Serverless green, Serverfull yellow. (4) Serverless real time Power consumption (W): stacked area, y-axis Power (W) 0 to 100. Total serverless red about 95 W, then about 32 W, then about 97 W. Other series: knative-serving green, knative-serving-ingress yellow, openshift-serverless blue, serverless-ns orange about 45 W dropping to near 0. Legend lists those five series. (5) Serverfull real time Power consumption (W): y-axis Power (W) 0 to 60 plus gridlines at 20 and 40, x-axis 08:50 to 09:45. Total serverfull blue about 62 W from 09:02 to 09:21 and about 23 W elsewhere. istio-system green near 0. Legend: istio-system, serverfull-ns, Total serverfull. (6) Serverless Total Energy Consumption (kWh) 1h: stat 0.0532 kWh in green, with a rising green area sparkline. (7) Serverfull+Istio Energy Consumption (kWh) 1h: stat 0.0368 kWh in green, with a green area sparkline that falls from about 09:00 to 09:30 then rises slightly. (8) Energy consumption (kWh) (per 1h): y-axis 0.0350 to 0.0550, x-axis 08:50 to 09:45. Serverless green area about 0.0530 rising to 0.0535. Serverfull yellow line about 0.0380 falling to about 0.0368. Legend bottom: serverless green, serverfull yellow. (9) Real time Power consumption (W) at bottom right: y-axis Power (W) 0 to 80, x-axis 08:50 to 09:45. Series CORE green, PKG yellow, UNCORE blue near 1 W, DRAM orange near 1 W, OTHER red about 47 W, dropping to about 40 W. Legend: CORE, PKG, UNCORE, DRAM, OTHER. Other stacked fills are green and yellow.
Slide 29
datasource / prometheus / time_interval / 1h / Real time Power consumption (W) / 100 / 80 / 60 / 40 / 20 / Power (W) / 08:55 / 09:00 / 09:05 / 09:10 / 09:15 / 09:20 / 09:25 / 09:30 / 09:35 / 09:40 / 09:45 / serverless / serverfull / ServerfullRequests/s / Serverless Requests/s / 0 / 2001 / Requests/s / Requests/s / 2000 / 1000 / 0 / 08:50 / 09:00 / 09:10 / 09:20 / 09:30 / 09:40 / Serverless / Serverfull / Serverless real time Power consumption (W) / 100 / 50 / 0 / Power (W) / knative-serving / knative-serving-ingress / openshift-serverless / serverless-ns / Total serverless / Serverless Total Energy Consumption (kWh) 1h / 0.0532 kWh / Serverfull real time Power consumption (W) / 60 / 40 / 20 / 0 / Power (W) / istio-system / serverfull-ns / Total serverfull / Serverfull+Istio Energy Consumption (kWh) 1h / 0.0368 kWh / Energy consumption (kWh) (per 1h) / 0.0550 / 0.0500 / 0.0450 / 0.0400 / 0.0350 / serverless / serverfull / Real time Power consumption (W) / 80 / 60 / 40 / 20 / 0 / Power (W) / CORE / PKG / UNCORE / DRAM / OTHER / @kevindubois @jgomezselles
Visuals: Dashboard screenshot of a Grafana-style monitoring dashboard on a near-black background. Top-left: line chart titled Real time Power consumption (W), y-axis Power (W) from 20 to 100 in steps of 20, x-axis time 08:50 to 09:45 in 5-minute ticks; series serverless (green, fills from about 95 W at 08:50 down to about 32 W between about 08:52 and 09:01, back to about 32 W until 09:31, then up to about 95 to 98 W after 09:32) and serverfull (yellow, about 23 W until 09:00, rising to about 62 W from 09:02 to 09:21, then about 24 W to 09:45). Red annotation rectangles outline this chart's lower band at about 08:51 to 09:01 and two red double-headed arrows mark the gap between the series at about 08:55 and about 09:25 to 09:30 with red horizontal guide lines. Top right: two gauges, ServerfullRequests/s showing 0 in green and Serverless Requests/s showing 2001 in green. Below them Requests/s area chart, y-axis Requests/s 0 to 2000, x-axis 08:50 to 09:40; Serverless (green) about 2000 from 08:45 to 08:50, ramping to 0 near 09:00, then ramps back up to 2000 at about 09:35; Serverfull (yellow) ramps from 0 at about 09:00 to 2000 at about 09:05, holds to about 09:18, and falls to 0 at about 09:28. Middle left: Serverless real time Power consumption (W), y-axis 0 to 100, series knative-serving (green, about 25 W at low load), knative-serving-ingress (yellow, near 0 to 5 W), openshift-serverless (blue, near 0), serverless-ns (orange, about 45 W falling to about 0 at 08:52 and rising to about 40 W after 09:31), Total serverless (red, about 95 W, falling to about 32 W at 08:52 and rising to about 98 W after 09:31). Right middle: red-outlined box containing two stat panels. Serverless Total Energy Consumption (kWh) 1h shows 0.0532 kWh in large green text with a rising green area sparkline. Serverfull+Istio Energy Consumption (kWh) 1h shows 0.0368 kWh in large green text with a green area sparkline that falls from about 0.0368 at 09:10 to a minimum near 09:30 then rises slightly. Lower left: Serverfull real time Power consumption (W), y-axis 0 to 60 with ticks at 0, 20, 40, 60; series istio-system (green, near 0 W), serverfull-ns (yellow, about 22 W, about 60 W from 09:02 to 09:21), Total serverfull (blue, about 23 W, about 62 to 65 W from 09:02 to 09:21). Bottom left: Energy consumption (kWh) (per 1h) area chart, y-axis 0.0350 to 0.0550, series serverless (green, about 0.0525 to 0.0535) and serverfull (yellow, about 0.0380 falling to about 0.0368 by 09:20 then flat). Bottom right: Real time Power consumption (W) stacked area chart, y-axis 0 to 80, series CORE (green), PKG (yellow), UNCORE (blue, near 0), DRAM (orange, near 0), OTHER (red, about 45 to 48 W, dropping to about 40 W between 08:52 and 09:00 and 09:22 and 09:31). Lighting is flat UI glow with no photography; dominant colours are near-black #212121 background, green #73BF69 series, yellow #FADE2A series, red #F2495C annotations.
Slide 30
datasource / prometheus / time_interval / 1h / Real time Power consumption (W) / serverless / serverfull / ServerfullRequests/s / Serverless Requests/s / 0 / 2001 / Requests/s / Serverless / Serverfull / Serverless real time Power consumption (W) / knative-serving / knative-serving-ingress / openshift-serverless / serverless-ns / Total serverless / Serverless Total Energy Consumption (kWh) 1h / 0.0532 kWh / Serverfull real time Power consumption (W) / istio-system / serverfull-ns / Total serverfull / Serverfull+Istio Energy Consumption (kWh) 1h / 0.0368 kWh / Energy consumption (kWh) (per 1h) / Real time Power consumption (W) / CORE / PKG / UNCORE / DRAM / OTHER / serverless / serverfull / @kevindubois @jgomezselles
Visuals: Full-slide screenshot of a Grafana monitoring dashboard on a dark theme. Panels: (1) Real time Power consumption (W), time series, y-axis Power (W) with ticks 20, 40, 60, 80, 100, x-axis time 08:50 to 09:45 in 5-minute ticks; two series, serverless (green, about 95 W from 08:50 to 08:52, about 32 W until 09:31, then about 97 W to 09:45) and serverfull (yellow, about 23 W, rising to about 62 W from about 09:02 to 09:22, then back to about 23 W). (2) ServerfullRequests/s gauge reading 0 (dark arc, green value). (3) Serverless Requests/s gauge reading 2001 (green arc). (4) Requests/s time series, y-axis Requests/s 0 to 2000 with ticks 0, 1000, 2000; Serverless (green) ramps from 2000 to 0 around 08:50 to 09:00, rises to 2000 at 09:31 to 09:40 and stays; Serverfull (yellow) ramps from 0 at 09:00 to 2000 at about 09:05 until 09:20, then falls to 0 at about 09:28. (5) Serverless real time Power consumption (W), highlighted by a red rectangle outline; series knative-serving (green, about 22 W), knative-serving-ingress (yellow, about 5 W), openshift-serverless (blue, about 1 W), serverless-ns (orange, about 40 W before 08:52 and about 45 W after 09:31), Total serverless (red, about 95 W before 08:52 and about 98 W after 09:31, about 32 W in between); a red box around the 09:31 to 09:45 band of the orange and green traces. (6) Serverless Total Energy Consumption (kWh) 1h stat 0.0532 kWh with a rising green area sparkline. (7) Serverfull real time Power consumption (W), y-axis Power (W) 0 to 60, series istio-system (green, about 1 W), serverfull-ns (yellow, about 22 W, peaking near 60 W from 09:02 to 09:21), Total serverfull (blue, about 23 W, peaking about 65 W). (8) Serverfull+Istio Energy Consumption (kWh) 1h stat 0.0368 kWh with a declining green area sparkline. (9) Energy consumption (kWh) (per 1h) area chart, y-axis 0.0350 to 0.0550 in steps of 0.0050, serverless (green area, about 0.0525 kWh rising to 0.0535) and serverfull (yellow line, about 0.0380 falling to about 0.0368), legend serverless and serverfull bottom left. (10) Real time Power consumption (W) stacked chart, y-axis Power (W) 0 to 80, series CORE (green), PKG (yellow), UNCORE (blue), DRAM (orange), OTHER (red); legend at right. Dashboard frame: panel titles in light grey, dark panels, thin grid lines, faded fills under the lines.
Slides 31 to 59 continue in the full text file.
Download this deck
The hosted PDF of every library deck is free for readers of the SlideDeck Co newsletter. Join with your email and the viewer and download appear here.
Building a deck of your own? The SlideDeck Co Standard Deck is a slide library for business presentations: reviews, updates and plans.







