

The deck opens on a title slide for KubeCon + CloudNativeCon Europe 2024, then an introduction that frames the question of how many Kubernetes NetworkPolicy objects a cluster can handle. It explains what a NetworkPolicy is and how its scale impact depends on the namespaces and pods it references, using diagram-led slides that build up one example across several steps. Next comes the Network Policy Scale Profile, a set of seven parameters that simplify possible policy specs, followed by a slide on generating the workload with kube-burner and the k8s-netpol-scale project. Later sections cover a convergence tracker for detecting when policies are applied, monitoring and results dashboards, how to find a scale limit, and performance gains between OpenShift versions. A section with Tigera covers adding a Calico convergence tracker, a live demo, and comparative results for CIDR-heavy and selector-heavy profiles across Calico v3.26 and v3.27. The deck closes with a perspective from Tigera and a list of open questions and next steps, with a slide on how to estimate limits for custom profiles.
Slides worth studying
Questions about this deck
How many slides does the Red Hat Network Policy scale presentation have?
The Red Hat deck has 27 slides, starting with a KubeCon + CloudNativeCon Europe 2024 title slide on slide 1. It closes on slide 27 with the question of how many Network Policies can be created, along with next steps.
What are the seven parameters in the Red Hat Network Policy Scale Profile?
Slide 10 says the Red Hat team simplified all possible NetworkPolicy specs to LOCAL_PODS, SINGLE_PORTS, PORT_RANGES, POD_SELECTORS, PEER_NAMESPACES, PEER_PODS, and CIDRS. Slides 8 and 9 define these parameters in more detail.
How does the Red Hat convergence tracker detect when Network Policies are applied?
Slide 13 explains that NetworkPolicy has no Status showing when all rules are configured, so the convergence tracker is a customizable job that uses a simple Python script to track networking setup progress on every node. The cluster is considered converged when no new changes are applied and it reaches a stable state.
What performance improvements did Red Hat report between OpenShift 4.12 and 4.14?
Slide 17 reports that for a 3-node test cluster with 1 LOCAL_POD, 1 POD_SELECTOR and 1 CIDR, convergence time for 20K network policies fell from OCP 4.12 => 24 min to OCP 4.14 => 5 min. The scale limit rose from OCP 4.12 => 15K to OCP 4.14 => 60K.
Details
- Company: Red Hat
- Year: 2024
- Type: Conference talk
- Industry: Cloud infrastructure
- Pages: 27
More from Red Hat
All Red Hat decks in the library
Review score: 6 out of 10, Needs substantial work
Presentation quality, judged with the SlideDeck Co review heuristic. Ask, evidence and idea merit are not rated here.
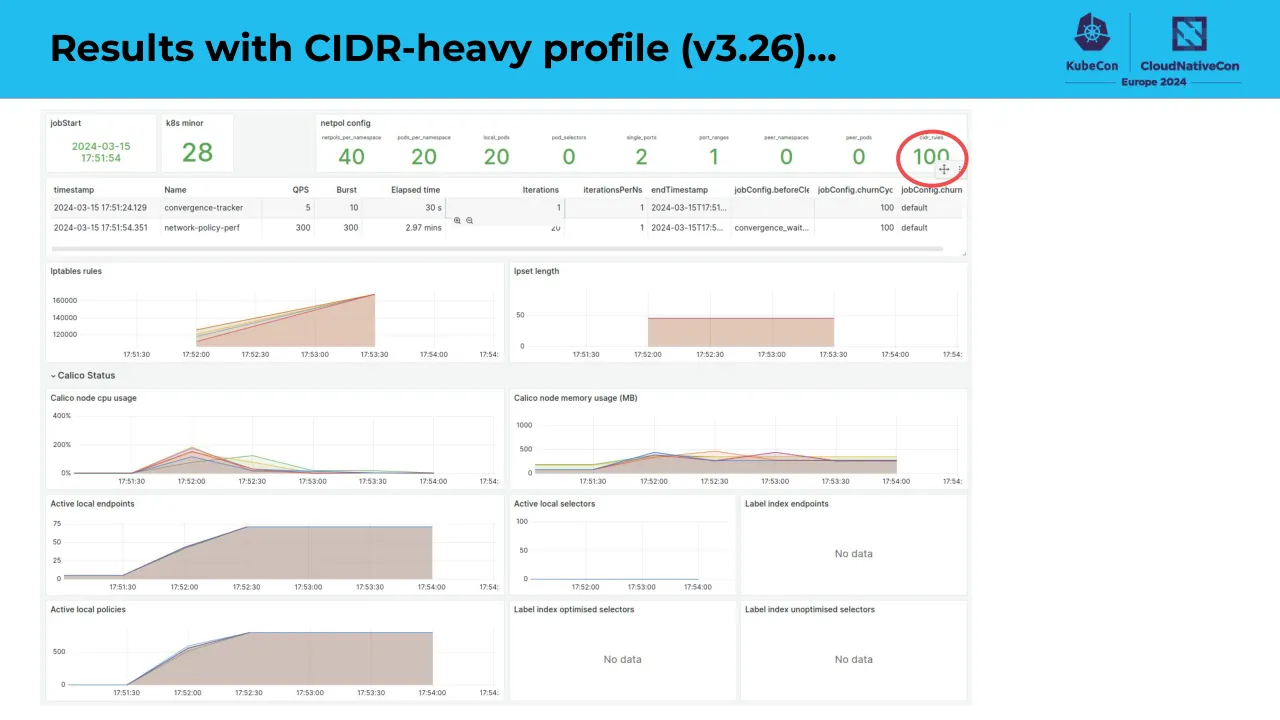
The core concept slides are strong: slides 4 to 6 build one NetworkPolicy example step by step with color-coded arrows tying the YAML to the diagram, and slides 8 to 10 reuse that color coding for the seven scale parameters. The route is sound, running from the question to the model to the tooling, the results and the open questions. However, the results section is weak: slides 22 to 25 are full-dashboard screenshots with tiny unreadable axes and only a circle, arrow or box as guidance, and none state the takeaway, so the audience cannot see what v3.27 improved. Slides 17 and 18 mix text, logos and charts without a clear point, and slides 13 to 16 have small unreadable evidence, so the deck suits a technical talk with a speaker but needs substantial revision to carry its comparisons.
Worth keeping: Keep the stepwise annotated YAML and pod diagram on slides 4 to 6 and the color-coded parameter mapping on slides 8 to 10, plus the consistent blue header band with a clear title on each slide.
Most useful repair: Replace the full-dashboard screenshots on slides 22 to 25 and the table screenshots on slides 14 to 16 with cropped or redrawn charts that show the one comparison, labeled with the result such as v3.26 versus v3.27 convergence time.
What would change the score: I would cut the text-only slides 26 and 27 down to a few lines with a visual summary, trim the stray decorative image on slide 3, and give slides 17 and 18 a single clear message each.
Confidence medium. 27 of 27 pages inspected on contact sheets, 4 at readable size. Reviewed 2026-11-08. Model-assisted review (claude-sonnet-5-5).
Full text of the slides (27 slides)
Every slide's words and a description of its charts and images, so the deck can be searched and rebuilt. Also available as Markdown.
Slide 1
KubeCon / CloudNativeCon / Europe 2024
Visuals: Illustration of a flat paper-cut style Paris skyline along the bottom right, roughly from x 40% to 100% and y 64% to 100%. Landmarks from left to right: a green domed building (Panthéon-like) at about x 42-53%, a tan Arc de Triomphe-style arch at x 54-61%, a red Grande Arche-style square frame at x 55-67% behind it, a blue Sacré-Cœur group of domes at x 63-71%, a crimson Eiffel Tower at x 71-79% with its tip near y 46%, a cream Louvre pyramid-style building at x 76-92%, and a red Notre-Dame-style cathedral at x 90-98%. The skyline sits in front of dark purple silhouettes of buildings and a pale grey cloud-like base strip along the bottom edge at y 94-100%. Four flat paper-cut clouds with light blue and white shading and soft drop shadows: one large at about x 72-91%, y 6-27%; one mid-sized at x 82-96%, y 48-58%; one small at x 41-51%, y 58-68%. The Kubernetes wheel logo is a white helm-wheel inside a white hexagonal shape at x 9-18%, y 7-30%. The CloudNativeCon logo is a white-outlined square containing a grey-and-white diagonal pattern at x 33-42%, y 15-30%. Lighting is flat and even. Dominant colours: purple #4F3A74, sky blue #5CD3F2, teal blue #43A2CB, red #E8353F, green #2DBE8A, cream #F9D9AE, grey #E6E6E6, white #FFFFFF. The illustration is full-bleed with no boxing, cropping or tint.
Slide 2
How Many Network / Policies Can I Create? / Nadia Pinaeva, Red Hat / Shaun Crampton, Tigera
Visuals: Background illustration only: a large diagonal boundary runs from top centre (about x 68%, y 0) down-left to bottom (about x 12%, y 100), splitting the slide into a bright cyan region on the left and a light grey region on the right. In the lower right, a large cyan circular/arc shape (lighter cyan #5DD5F5 block with a darker cyan #22BDEF lower band) rises from the bottom edge at about x 56% and sweeps up to the right edge near y 38%; a rectangular lighter cyan block (#5DD5F5) sits inside it from about x 75% to the right edge, y 53% to y 87%. No photographs, logos or icons.
Slide 3
Introduction / How Many Network Policies Can I Create? / ● Why that's a hard question! / ● New model/framework for scale testing Network Policies / ● Intro to kube-burner; convergence tracking / ● Sample results from OpenShift / ● Tigera team's experience adding Calico / ● Demo / ● Can we answer the question? What's next… / Measuring confusing multi-dimensional object – Dall-e / KubeCon / CloudNativeCon / Europe 2024
Visuals: One photograph (AI-generated illustration, labelled 'Measuring confusing multi-dimensional object – Dall-e') occupying the right column, about 50.9% to 100% of width and 12.6% to 100% of height, full-height and flush to the right, bottom and header edges, not boxed. Subject: a large glowing, faceted, wireframe crystalline polyhedron (cyan-white lattice on top, warm orange-gold lattice on bottom) floats in the centre, suspended above a row of about eight scientists in long white lab coats standing on a floor covered with scattered papers. They use oversized brass and chrome measuring tools: a giant ruler on the left, a set square and protractor on the right, a caliper, compass and clamp, with a tablet on a small wooden table. Above, a floating chrome clamp, a camera-like device and a tool-arm drift among handwritten equations. The background is a dark navy chalkboard covered with mathematical formulas and graphs. Composition: centred hero object, figures arranged along the bottom edge, nearly full-frame with no border. Lighting: cool cyan glow from behind the central object with warm golden light radiating from its lower tip. Dominant colours: deep navy #0E1A2E, cyan #3FC8F0, gold #D9A441, warm white #F2E8D5. A dark translucent gradient strip sits over the bottom of the photograph to hold the caption. No logos or icons other than the header logos.
Slide 4
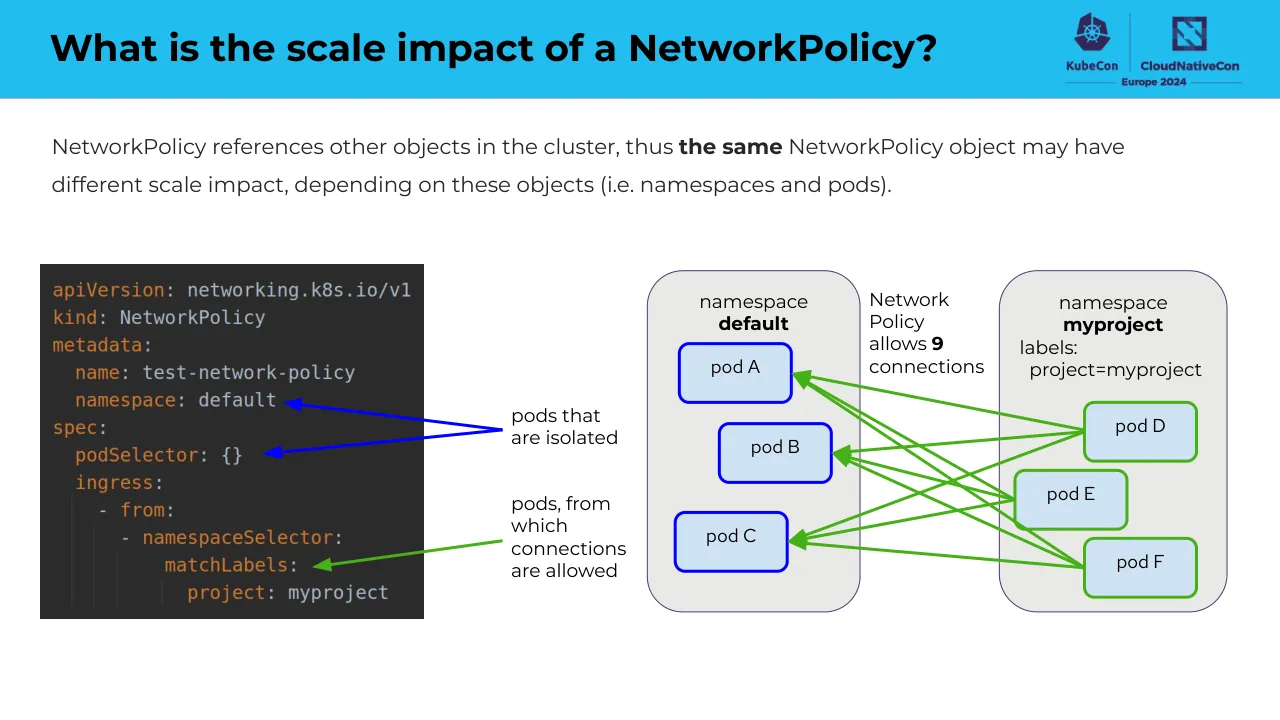
What is NetworkPolicy?
NetworkPolicy is a kubernetes API that ensures network security, by specifying connections that should be
allowed for a namespace. All the other connections for a namespace will be denied.
apiVersion: networking.k8s.io/v1
kind: NetworkPolicy
metadata:
name: test-network-policy
namespace: default
spec:
podSelector: {}
ingress:
- from:
- namespaceSelector:
matchLabels:
project: myproject
pods that
are isolated
pods, from
which
connections
are allowed
namespace
default
Network
Policy
allows 1
connection
namespace
myproject
labels:
project=myproject
pod A
pod D
Visuals: 1. Code block (illustration/screenshot of a YAML file): a near-black rectangle #2B2B2B, 616 by 568 px, placed at x 3.2%, y 36.8%, w 30.0%, h 49.1%, square corners, not cropped. Monospace font, light grey text #D4D4D4 for values, orange #CE9178 for YAML keys, light grey for the leaves, with a faint vertical indent guide on the left. Lines: apiVersion: networking.k8s.io/v1 / kind: NetworkPolicy / metadata: / name: test-network-policy / namespace: default / spec: / podSelector: {} / ingress: / - from: / - namespaceSelector: / matchLabels: / project: myproject. 2. Blue arrow 1: a thin blue #0000FF line with an arrowhead at the left end pointing at the 'namespace: default' line of the code, starting at the 'pods that are isolated' label, about 1.5 pt stroke, from about (39.2%, 59.7%) to (22.1%, 55.7%). 3. Blue arrow 2: a thin blue #0000FF line with an arrowhead pointing at the 'podSelector: {}' line, from the same origin (39.2%, 59.7%) to about (20.6%, 62.9%). 4. Green arrow 1: a thin green #3DAE2B line with an arrowhead pointing at the 'matchLabels:' line of the code, starting at the 'pods, from which connections are allowed' label at about (39.2%, 75.1%) to about (24.5%, 78.4%). 5. Green arrow 2: a thin green #3DAE2B line from pod D (left edge, about 84.6%, 59.6%) to pod A (right edge, about 62.0%, 52.3%), arrowhead at pod A. 6. Namespace default panel: a rounded rectangle, light grey #EAE9E8 fill with a thin dark indigo outline (#3C3A6B-like, about 1 pt), corner radius about 4% of slide width, at x 50.6%, y 37.6%, w 16.6%, h 47.4%. 7. Namespace myproject panel: identical style, at x 78.1%, y 37.6%, w 17.8%, h 47.4%. 8. Pod A: rounded rectangle, fill #CFE2F3 (light blue), thick blue #0000FF outline about 2.5 pt, corner radius about 1%, at x 53.1%, y 47.7%, w 8.7%, h 8.2%, containing the text 'pod A'. 9. Pod D: rounded rectangle, fill #CFE2F3, thick green #3DAE2B outline about 2.5 pt, corner radius about 1%, at x 84.7%, y 55.9%, w 8.8%, h 8.2%, containing the text 'pod D'. 10. Header band: flat sky-blue #22BFEF rectangle across the full width at the top, about 13.7% of the slide height, no shadow. 11. Logos at top right: the Kubernetes wheel mark in dark indigo #2D2A5E above the word 'KubeCon', a thin vertical divider line, the CloudNativeCon mark (a stylised square with a diagonal cut) above the word 'CloudNativeCon', and a horizontal rule with 'Europe 2024' centred beneath, all in dark indigo #2D2A5E on the blue band. Box about x 82.5%, y 1.5%, w 15.5%, h 10.0%.
Slide 5
What is the scale impact of a NetworkPolicy?
KubeCon / CloudNativeCon Europe 2024
NetworkPolicy references other objects in the cluster, thus the same NetworkPolicy object may have / different scale impact, depending on these objects (i.e. namespaces and pods).
namespace
default
Network / Policy / allows 2 / connections
namespace
myproject
labels:
project=myproject
pod A
pod D
pod B
pods that / are isolated
pods, from / which / connections / are allowed
apiVersion: networking.k8s.io/v1
kind: NetworkPolicy
metadata:
name: test-network-policy
namespace: default
spec:
podSelector: {}
ingress:
- from:
- namespaceSelector:
matchLabels:
project: myproject
Visuals: Illustration: a dark charcoal (#2B2B2B) code block, about 30% wide and 49% tall, showing a Kubernetes NetworkPolicy YAML in a monospace font. Keys (apiVersion, kind, metadata, name, namespace, spec, podSelector, ingress, from, namespaceSelector, matchLabels, project) are orange (#CC7832-like); values (networking.k8s.io/v1, NetworkPolicy, test-network-policy, default, {}, myproject) are light grey (#A9B7C6-like). Indent guides are thin dark grey vertical lines. Blue arrows (#0000FF, about 0.3% stroke) run from the text 'pods that are isolated' to the line 'namespace: default' (tip at about x 22%, y 56%) and to 'podSelector: {}' (tip at about x 21%, y 63%). A green arrow (#4CB01F, about 0.3% stroke) runs from the text 'pods, from which connections are allowed' to 'matchLabels:' (tip at about x 24.5%, y 79%). Diagram: two rounded rectangles (namespace boxes) in light grey #EAE9E8 with thin dark indigo outlines (#3C3A6B-like). Left box labelled namespace default contains pod A (top) and pod B (lower right); right box labelled namespace myproject with labels project=myproject contains pod D. Pods are light blue #CFE2F3 rounded rectangles: pod A and pod B have bold blue (#0000FF) outlines about 0.3% thick; pod D has a green (#4CB01F) outline. Green arrows point from pod D to pod A (tip at about x 62%, y 52%) and to pod B (tip at about x 65%, y 63%). Logos: a Kubernetes wheel mark in dark navy and the CloudNativeCon logo (a dark navy square with a diagonal cut, about 4% wide), separated by a thin vertical rule, with the text KubeCon and CloudNativeCon and a line reading Europe 2024 beneath; the logos are dark navy (#1F2A5A-like) on the cyan band.
Slide 6
What is the scale impact of a NetworkPolicy? / NetworkPolicy references other objects in the cluster, thus the same NetworkPolicy object may have / different scale impact, depending on these objects (i.e. namespaces and pods). / apiVersion: networking.k8s.io/v1 / kind: NetworkPolicy / metadata: / name: test-network-policy / namespace: default / spec: / podSelector: {} / ingress: / - from: / - namespaceSelector: / matchLabels: / project: myproject / pods that / are isolated / pods, from / which / connections / are allowed / namespace / Network / default / Policy / namespace / myproject / allows 9 / labels: / pod A / connections / project=myproject / pod D / pod B / pod E / pod C / pod F
Visuals: Left: a dark charcoal code block (about #2B2B2B) showing a Kubernetes YAML NetworkPolicy, monospace font, keywords in orange (#E08A3C-like) and values in light grey-blue; the block is a boxed image with square corners. Two blue arrows (#0000FF) point from the labels 'pods that are isolated' to the code line 'namespace: default' and to 'podSelector: {}'. One green arrow (#4CB020-like) points from 'pods, from which connections are allowed' to 'matchLabels:'. Right: a diagram with two light grey rounded rectangles (#EAE9E8, dark outline). The left rounded box is 'namespace default' containing pod A, pod B and pod C, each a light blue (#CFE2F3) rounded rectangle with a thick blue (#0000FF) outline, labelled 'pod A', 'pod B', 'pod C'. The right rounded box is 'namespace myproject' labels project=myproject containing pod D, pod E and pod F, each light blue (#CFE2F3) rounded rectangle with a thick green (#4CB020-like) outline. Green arrows with arrowheads connect: pod D to pod A, pod D to pod B, pod D to pod C; pod E to pod B, pod E to pod C, pod E to pod A; pod F to pod A, pod F to pod B, pod F to pod C. Arrowheads point into the default namespace pods; the text 'Network Policy allows 9 connections' sits between the two boxes. Logos: KubeCon logo (dark navy wheel mark) and CloudNativeCon Europe 2024 logo (navy geometric mark) at top right, separated by a thin vertical divider.
Slide 7
What is the scale impact of a NetworkPolicy? / KubeCon / CloudNativeCon / Europe 2024 / NetworkPolicy has lists of rules in its Spec. / Every list may have 0..N number of elements. / That is why NetworkPolicy performance impact / depends A LOT on its Spec. / apiVersion: networking.k8s.io/v1 / kind: NetworkPolicy / metadata: / name: test-network-policy / namespace: default / spec: / podSelector: {} / ingress: / - from: / - ipBlock: / cidr: 172.17.0.0/16 / except: / - 172.17.1.0/24 / - from: / - namespaceSelector: / matchLabels: / project: myproject / - podSelector: / matchLabels: / role: frontend / ports: / - protocol: TCP / port: 6379 / list of [e/in]gress rules / list of peers for ingress rule / list of ipBlock exceptions / (not implemented yet) / list of ports for [e/in]gress rule
Visuals: One dark code screenshot (photo of a YAML file in a code editor, boxed, not cropped, sharp rectangle, full text legible) occupying x 57.1 to 82.7 percent and y 17.9 to 95.6 percent of the slide. Its background is charcoal #2B2B2B; keys are orange (about #E08A3C), values and comments are light grey (about #D4D4D4) and the string value TCP and numbers are light grey, monospace typeface. Four grey arrows (#999999, about 3 px stroke, filled triangular arrowheads) point from the left labels to code lines: arrow 1 from label 'list of [e/in]gress rules' to the '- from:' line at the first ingress rule; arrow 2 from 'list of peers for ingress rule' to the '- ipBlock:' line; arrow 3 from 'list of ipBlock exceptions' to the '- 172.17.1.0/24' line; arrow 4 from 'list of ports for [e/in]gress rule' to the '- protocol: TCP' line. A tiny grey dot sits left of the first label at about x 11.8 y 50. Logos: KubeCon (ship-wheel mark in dark navy) and CloudNativeCon (navy square mark), separated by a thin vertical divider, with the words KubeCon, CloudNativeCon and Europe 2024 beneath, all in dark navy on the cyan band; no other logos.
Slide 8
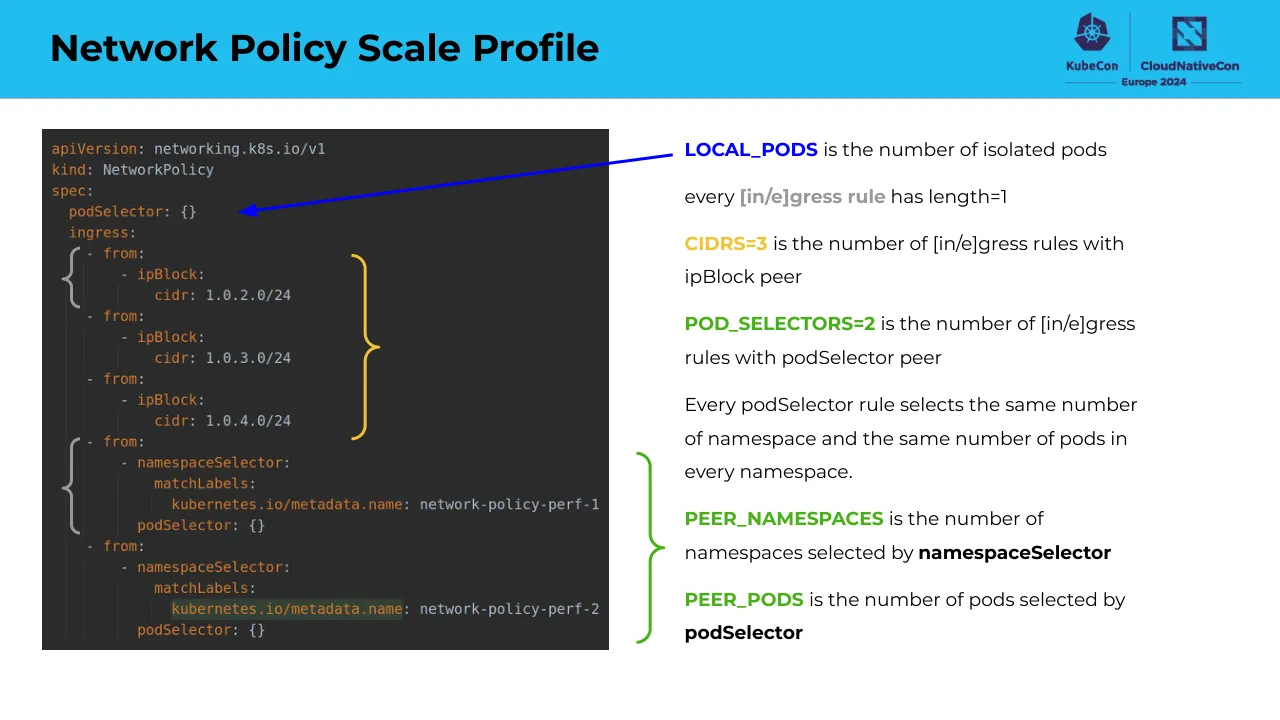
Network Policy Scale Profile
LOCAL_PODS is the number of isolated pods
every [in/e]gress rule has length=1
CIDRS=3 is the number of [in/e]gress rules with ipBlock peer
POD_SELECTORS=2 is the number of [in/e]gress rules with podSelector peer
Every podSelector rule selects the same number of namespace and the same number of pods in every namespace.
PEER_NAMESPACES is the number of namespaces selected by namespaceSelector
PEER_PODS is the number of pods selected by podSelector
Code block:
apiVersion: networking.k8s.io/v1
kind: NetworkPolicy
spec:
podSelector: {}
ingress:
- from:
- ipBlock:
cidr: 1.0.2.0/24
- from:
- ipBlock:
cidr: 1.0.3.0/24
- from:
- ipBlock:
cidr: 1.0.4.0/24
- from:
- namespaceSelector:
matchLabels:
kubernetes.io/metadata.name: network-policy-perf-1
podSelector: {}
- from:
- namespaceSelector:
matchLabels:
kubernetes.io/metadata.name: network-policy-perf-2
podSelector: {}
Visuals: Photo-like screenshot of a YAML NetworkPolicy manifest in a dark code editor, boxed at x 3.3 y 17.9 w 44.3 h 72.3 with square corners and no shadow. Monospaced syntax-highlighted text: keys in orange, values in light grey, the highlighted string kubernetes.io/metadata.name on the last matchLabels line has a dark green highlight band. Overlays: a blue arrow line from the text LOCAL_PODS pointing to the line podSelector: {} at about x 18.6 y 29.2; a yellow curly brace spanning the three ipBlock from rules at about x 27.4 y 35.3 w 2.3 h 25.9; a grey curly brace at the left of the first ipBlock group at about x 2.5 y 34.5 w 2.5 h 11.5; a grey curly brace at the left of the namespaceSelector group at about x 2.5 y 60.5 w 2.5 h 12.5; a green curly brace at the right of the text column at about x 49.6 y 62.8 w 2.4 h 26.5. Logos: KubeCon wordmark with ship wheel emblem in dark navy at about x 83.2 y 1.6 w 3.8 h 8.4; CloudNativeCon wordmark with Europe 2024 text in dark navy at about x 89.0 y 1.8 w 8.0 h 10.7, with a vertical divider line between the two logos. Blue arrow line colour #0000FF, stroke about 2 px.
Slide 9
Network Policy Scale Profile
KubeCon / CloudNativeCon / Europe 2024
Every [in/e]gress rule may have a list of ports in addition to peer, both for
CIDR and POD_SELECTOR. Ports list is the same for all rules within a
single NetworkPolicy.
SINGLE_PORTS=2 is the number of single TCP ports
PORT_RANGES=1 is the number of TCP port ranges (always includes 6
ports)
Visuals: A dark code screenshot (about 23.4% wide by 74.8% tall of the slide) showing a YAML network policy with monospace text: '- from:' / ' - ipBlock:' / ' cidr: 1.0.4.0/24' / ' ports:' / ' - port: 1001' / ' protocol: TCP' / ' - port: 1002' / ' protocol: TCP' / ' - endPort: 5005' / ' port: 5000' / ' protocol: TCP' / '- from:' / ' - namespaceSelector: {}' / ' ports:' / ' - port: 1001' / ' protocol: TCP' / ' - port: 1002' / ' protocol: TCP' / ' - endPort: 5005' / ' port: 5000' / ' protocol: TCP'. Keywords are orange, values light grey. Four curly braces are overlaid on the left and right of the code: a yellow brace spanning the first ipBlock rule down to the boundary between the two rules on the left, a green brace spanning the second rule on the left, a red brace on the right beside the two single port entries (1001 and 1002), and a purple brace on the right beside the endPort range entry (5000 to 5005). Logos: KubeCon (dark navy ship wheel icon with wordmark) and CloudNativeCon (dark navy square icon with wordmark) separated by a thin vertical divider, with 'Europe 2024' beneath, all in dark navy on the cyan band.
Slide 10
Network Policy Scale Profile
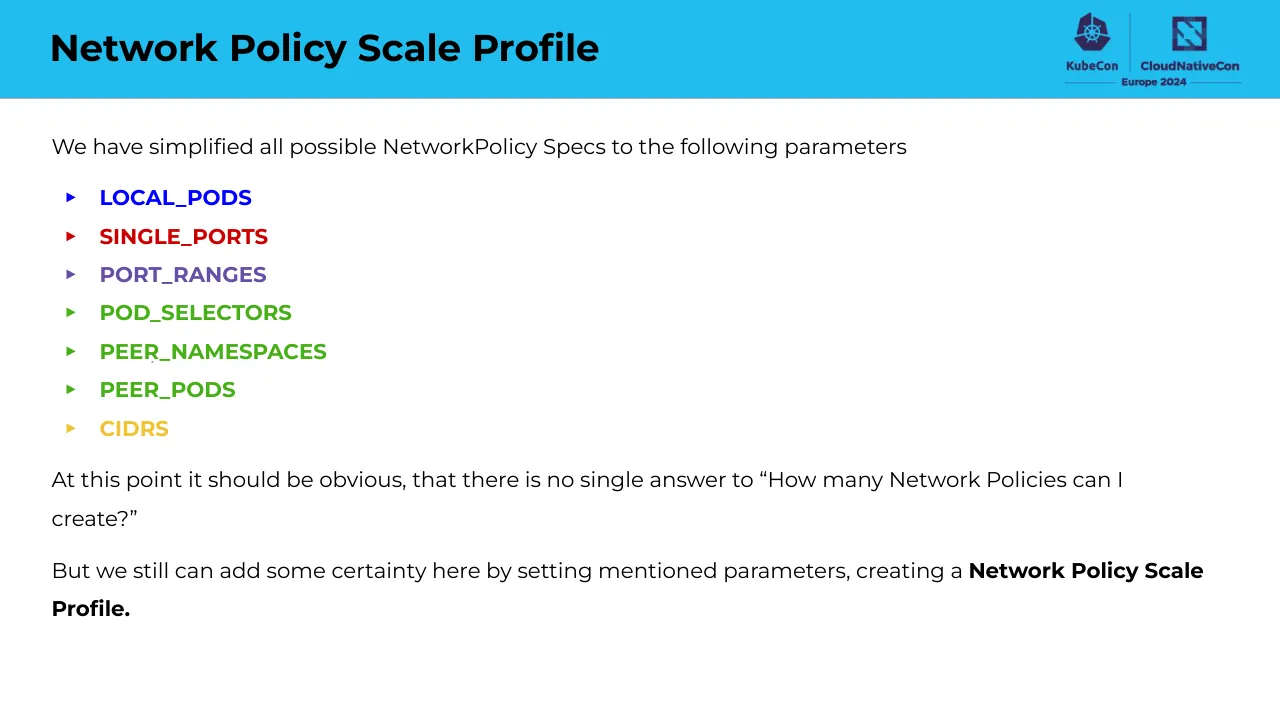
We have simplified all possible NetworkPolicy Specs to the following parameters
▸ LOCAL_PODS
▸ SINGLE_PORTS
▸ PORT_RANGES
▸ POD_SELECTORS
▸ PEER_NAMESPACES
▸ PEER_PODS
▸ CIDRS
At this point it should be obvious, that there is no single answer to “How many Network Policies can I create?”
But we still can add some certainty here by setting mentioned parameters, creating a Network Policy Scale Profile.
Visuals: Two conference logos sit in the header band at top right. First, the KubeCon logo: a dark navy #2B2A6B hexagonal emblem containing a ship's wheel (Kubernetes helm) motif, with the word KubeCon beneath it in bold navy. A thin vertical navy divider separates it from the second logo. Second, the CloudNativeCon logo: a navy #2B2A6B square outline containing a stylised diagonal N-shaped mark, with the word CloudNativeCon in bold navy beneath it, and below both logos the text Europe 2024 in bold navy flanked by two thin horizontal navy rules. No photographs, charts, tables or diagrams are present.
Slide 11
Network Policy Scale Profile / KubeCon / CloudNativeCon / Europe 2024 / An example NetworkPolicy for LOCAL_PODS=1, CIDRS=1 profile looks like this. / There are more parameters that define a namespace configuration: / ● PODS_PER_NAMESPACE / ● NETPOLS_PER_NAMESPACE / ● INGRESS / ● EGRESS / and an extra parameter NAMESPACES that defines how many namespaces with that config will be created. / There are much more parameters that affect test results, like / ● number of nodes / ● pod/node resources / ● kubeapi server performance / ● ...
Visuals: Right of the body text: a dark code editor screenshot (652 by 700 pixels source, placed at x 67.9%, y 17.9%, w 27.8%, h 53.1%) showing a Kubernetes YAML NetworkPolicy. Lines in order: apiVersion: networking.k8s.io/v1; kind: NetworkPolicy; metadata:; name: ingress-1; namespace: network-policy-perf-0; spec:; ingress:; - from:; - ipBlock:; cidr: 1.0.2.0/24; podSelector:; matchLabels:; "1": "true"; policyTypes:; - Ingress. Keys are orange, values light grey, string values green, on a near-black #2B2B2B background with monospace type. A yellow curly brace (#F1C232) brackets the lines from '- from:' through 'cidr: 1.0.2.0/24'; a blue curly brace (#0000FF) brackets the 'matchLabels:' and '"1": "true"' lines. Logos at top right: KubeCon wordmark with dark navy (#1F1F4A) Kubernetes wheel icon, and CloudNativeCon wordmark with navy icon, separated by a thin vertical rule and 'Europe 2024' beneath with thin horizontal rules.
Slide 12
Generating the workload
kube-burner is a CNCF Sandbox project, that provides Kubernetes performance and
scale test toolset.
● create, delete, read, and patch Kubernetes resources at scale
● prometheus metric collection and indexing
● alerting
k8s-netpol-scale has yamls for k8s Network Policy scale testing with kube-burner.
● generate the workload with a given Scale Profile
● visualize scale testing results with prometheus/opensearch/grafana
● static NetworkPolicy yaml analysis
Visuals: Two QR codes, each a square image of about 287 by 287 pixels, unboxed, uncropped, not rounded, placed at the left of their text blocks. Top QR code: black modules on white with a red hexagonal flame icon (the kube-burner logo, red about #E8141C) centred over the modules. Bottom QR code: black modules on white with a black GitHub Octocat mark centred over the modules. No tint or overlay on either code. Top-right logo: KubeCon wordmark with a dark navy (#2E2D57) Kubernetes helm icon above it, a thin vertical divider, and a CloudNativeCon wordmark with a dark navy stylised N-square icon above it, with 'Europe 2024' between two thin horizontal rules beneath; approximate box x83.0 y1.6 w14.0 h10.7.
Slide 13
Convergence tracker
NetworkPolicy doesn’t have a Status that would show when all networking rules are configured. How can
we say when all created Network Policies are applied?
● when no new changes are applied, cluster should come to a stable/converged state
● track networking state on every node
● convergence-tracker is a customizable job that uses a simple python script to track networking setup
progress on every node
● different network plugins may implement their own convergence trackers
convergence point
Visuals: One line chart screenshot (OVS flows) with a light grey frame. Chart title printed inside: OVS flows. Y axis: unlabelled units, tick labels 0, 10000, 20000, 30000, range 0 to about 30000. X axis: clock times 14:35, 14:40, 14:45, 14:50, 14:55, 15:00, 15:05, 15:10, 15:15, with the series starting about 14:40 and ending about 15:12. Series: a red line and a blue line that rise together from about 3000 at 14:40 to about 29000 near 15:05, then flatten; the area under them is filled in pale lavender. A brown horizontal band sits near about 4000 from 14:40 to about 15:12. A black dashed vertical line marks the convergence point at about 15:05, with a black arrow from the right pointing to it; the label convergence point is printed at the arrow tail. No legend is printed. Highlighted point: the convergence point at about 15:05 near 29000.
Slide 14
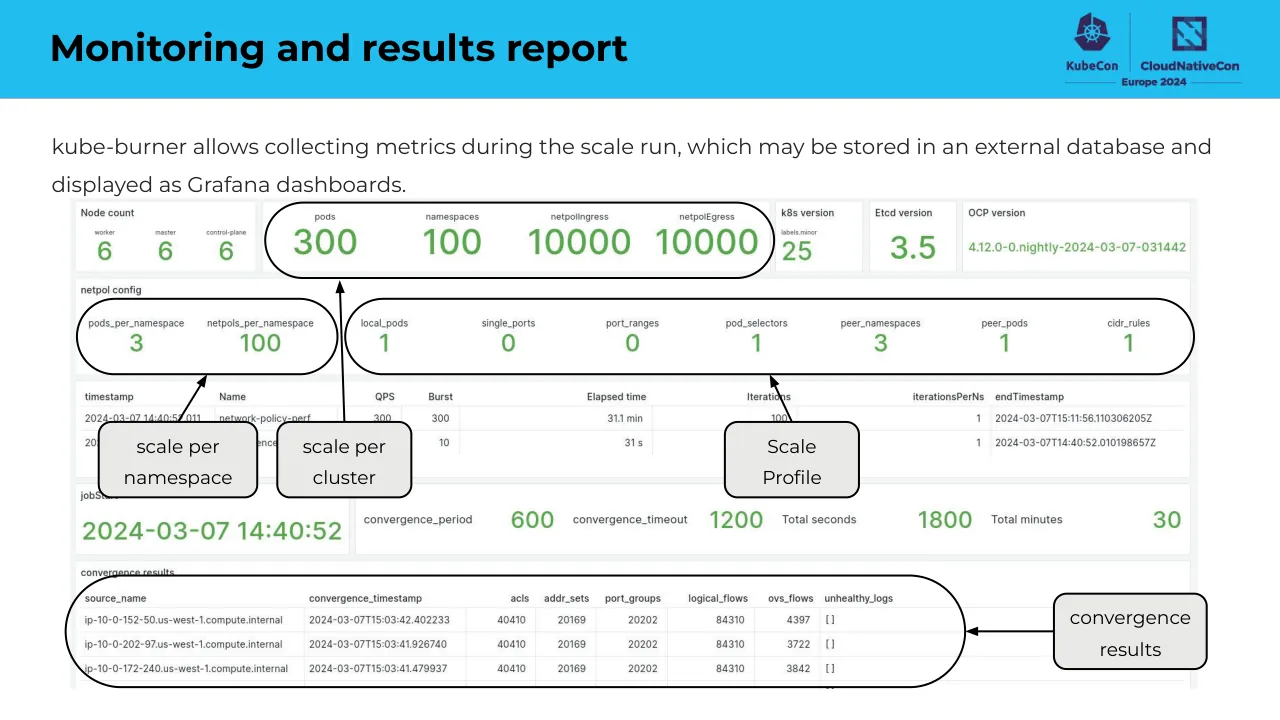
Monitoring and results report
kube-burner allows collecting metrics during the scale run, which may be stored in an external database and
displayed as Grafana dashboards.
scale per
namespace
scale per
cluster
Scale
Profile
convergence
results
Node count
worker
master
control-plane
6
6
6
pods
namespaces
netpolIngress
netpolEgress
300
100
10000
10000
k8s version
labels.minor
25
Etcd version
3.5
OCP version
4.12.0-0.nightly-2024-03-07-031442
netpol config
pods_per_namespace
netpols_per_namespace
3
100
local_pods
single_ports
port_ranges
pod_selectors
peer_namespaces
peer_pods
cidr_rules
1
0
0
1
3
1
1
timestamp
Name
QPS
Burst
Elapsed time
Iterations
iterationsPerNs
endTimestamp
2024-03-07 14:40:52.011
network-policy-perf
300
300
31.1 min
100
1
2024-03-07T15:11:56.110306205Z
(second row partly hidden by callouts: 10, 31 s, 1, 2024-03-07T14:40:52.010198657Z)
jobStart
2024-03-07 14:40:52
convergence_period
600
convergence_timeout
1200
Total seconds
1800
Total minutes
30
convergence results
source_name
convergence_timestamp
acls
addr_sets
port_groups
logical_flows
ovs_flows
unhealthy_logs
ip-10-0-152-50.us-west-1.compute.internal
2024-03-07T15:03:42.402233
40410
20169
20202
84310
4397
[ ]
ip-10-0-202-97.us-west-1.compute.internal
2024-03-07T15:03:41.926740
40410
20169
20202
84310
3722
[ ]
ip-10-0-172-240.us-west-1.compute.internal
2024-03-07T15:03:41.479937
40410
20169
20202
84310
3842
[ ]
(fourth row cut off at bottom edge)
Visuals: Dashboard screenshot (Grafana-style) placed as a boxed rectangle, not full-bleed, with a white panel background and light grey panel borders. It shows a Node count panel (worker 6, master 6, control-plane 6), a green metrics panel (pods 300, namespaces 100, netpolIngress 10000, netpolEgress 10000), k8s version panel (labels.minor 25), Etcd version panel (3.5), OCP version panel (4.12.0-0.nightly-2024-03-07-031442), a netpol config panel with values listed in text, a results table with one network-policy-perf row (QPS 300, Burst 300, Elapsed time 31.1 min, Iterations 100, iterationsPerNs 1), a jobStart panel (2024-03-07 14:40:52), a row of convergence values (convergence_period 600, convergence_timeout 1200, Total seconds 1800, Total minutes 30), and a convergence results table with columns source_name, convergence_timestamp, acls, addr_sets, port_groups, logical_flows, ovs_flows, unhealthy_logs and three visible rows (rows listed in text). Values are green #5AAE4A on white. Black hand-drawn style annotations: rounded-outline ovals around the pods/namespaces/netpolIngress/netpolEgress group (top), the pods_per_namespace/netpols_per_namespace group (left), the netpol config group (right, large), and the convergence results table (bottom-left, extending to the right edge of the panel); four black arrows with arrowheads run from the callout boxes to these outlines: from scale per namespace up to the left netpol oval, from scale per cluster up to the top metrics oval, from Scale Profile up-left to the netpol config oval, and from convergence results leftward to the convergence oval. Four light grey rounded rectangles with black outlines hold the callout labels.
Slide 15
Monitoring and results report
Performance metrics of different components, like / ovn-kubernetes, kube-apiserver, etcd, etc. may be added to / the dashboard.
KubeCon | CloudNativeCon
Europe 2024
OVNKubernetes
ovnkube-master pods CPU usage
ovnkube-master pods Memory Usage
ovnkube-master CPU usage
ovnkube-master Memory Usage
ovnkube-node pods CPU Usage
ovnkube-node pods Memory Usage
ovnkube-controller CPU Usage
ovnkube-controller Memory Usage
nbdb CPU Usage
nbdb Memory Usage
ovnkube-node pods CPU Usage
Mean / Max
ovnkube-node-srvdr 102% 250%
ovnkube-node-9zrcv 98.1% 284%
ovnkube-node-mrhb4 81.1% 276%
Visuals: A Grafana-style dashboard screenshot, cropped and boxed, shown in a left column. It contains a grid of eight panels plus a titled OVNKubernetes group: ovnkube-master pods CPU usage, ovnkube-master pods Memory Usage, ovnkube-master CPU usage, ovnkube-master Memory Usage, ovnkube-node pods CPU Usage (highlighted with a dark navy outline), ovnkube-node pods Memory Usage (covered by a light grey tint with a magnifier icon), ovnkube-controller CPU Usage, ovnkube-controller Memory Usage, nbdb CPU Usage and nbdb Memory Usage. Each panel is a line chart with time axis from 08:30 to 09:05 and legends of named series. The highlighted ovnkube-node pods CPU Usage panel has a y axis of 0%, 200% and 400%. A larger zoom panel at the right is a line chart titled ovnkube-node pods CPU Usage, with y axis 0%, 200%, 400%, time axis 08:30 to 09:05 and series ovnkube-node-srvdr (green, Mean 102%, Max 250%), ovnkube-node-9zrcv (yellow, Mean 98.1%, Max 284%) and ovnkube-node-mrhb4 (blue, Mean 81.1%, Max 276%). Series fill areas show a peak between about 08:35 and 08:42 near 400%, then decline to near 0% by about 08:45. Two thin black lines connect the corners of the highlighted panel to the corners of the zoom panel. The magnifier icon is a black ring-and-handle outline on a light grey tinted panel. The screenshots are flat, with light grey panel backgrounds and white chart areas, and no shadows.
Slide 16
Finding the scale limit
To find the scale limit we need to define the conditions for test failure. It can be
▸ cluster death: sometimes the cluster just becomes unavailable during the test run
▸ cluster health: collect metrics showing cluster health, especially for networking components, make sure that no error logs are present or that CPU usage falls back at some point
▸ convergence time: we may say, that if applying a given configuration takes more than N minutes, it is unacceptable
We can iteratively increase the workload until we reach a test failure. The easiest way to do so, is to save all parameters, expect for NETPOLS_PER_NAMESPACE. A spreadsheet template may be used to track test results.
KubeCon | CloudNativeCon Europe 2024
NODES_COUNT, job Iteration Delay, NAMESPACES, PODS_PER_NAMESPACE, NETPOLS_PER_NAMESPACE, directions ing/eg/both, local_pods, single_ports, port_ranges, pod_selectors, peer_namespaces, peer_pods, CIDRs (TODO except), netpols, peer selectors, % of diff peers, CIDRs, namesp selected, pods selected, BEST RESULT
Visuals: One screenshot of a Google Sheets style spreadsheet (table) at x 10.4%, y 63.1%, w 80.8%, h 32.5%, unboxed with a thin grey gridline frame, showing a column header row with letters A to X and row numbers 1 to 11. Row 1 group labels: 'ns config' spanning C to E, 'netpol config' spanning F to Q, 'load' spanning R to W. Row 2 group label: 'pod_selector peer config' spanning M to P. Row 3 column headers: A NODES_COUNT; B job Iteration Delay; C NAMESPACES; D PODS_PER_NAMESPACE; E NETPOLS_PER_NAMESPACE; F directions ing/eg/both; G (blank, shaded grey column); H local_pods; I (shaded grey, marked '<=' in row 4); J single_ports; K port_ranges; L pod_selectors; M peer_namespaces; N (shaded grey, '<=' in row 4); O peer_pods; P (shaded grey, '<=' in row 4); Q CIDRs (TODO except); R netpols; S peer selectors; T % of diff peers (in row 4); U CIDRs; V namesp selected; W pods selected; X BEST RESULT. Row 5 (CIDR-only 1-0-0-0-0-0-0-1 label in A to E, 'both' in F): G 2, H 1, J 0, K 0, L 0, M 0, O 0, Q 1. Row 6: 3, 0, 50, 3, 100, both, 2, 1, 3, 0, 0, 0, 0, 50, 0, 3, 1, R 10000, S 0, T 0.00%, U 10000, V 0, W 10000, X checkbox unchecked. Row 7: 3, 0, 50, 3, 200, both, 2, 1, 3, 0, 0, 0, 0, 50, 0, 3, 1, 20000, 0, 0.00%, 20000, 0, 20000, checkbox unchecked. Row 8: 3, 0, 50, 3, 300, both, 2, 1, 3, 0, 0, 0, 0, 50, 0, 3, 1, 30000, 0, 0.00%, 30000, 0, 30000, checkbox checked (black tick). Row 9: 3, 0, 50, 3, 400, both, 2, 1, 3, 0, 0, 0, 0, 50, 0, 3, 1, 40000, 0, 0.00%, 40000, 0, 40000, checkbox unchecked. Row 10: 3, 0, 50, 3, 500, both, 2, 1, 3, 0, 0, 0, 0, 50, 0, 3, 1, 50000, 0, 0.00%, 50000, 0, 50000, checkbox unchecked. Row 11 is empty. Cell fills: rows 6 to 8 columns R to W are light green #D9EAD3; row 9 is light red #F4CCCC; row 10 is unfilled white. Grey shaded columns G, I, N and P are #D9D9D9. Logo: KubeCon wordmark with a purple ship's wheel mark, and CloudNativeCon with a purple square-stylised mark, both in dark purple #3D2C6B, with text 'Europe 2024' below in dark purple between two thin lines.
Slide 17
Performance improvements / KubeCon / CloudNativeCon / Europe 2024 / Red Hat OpenShift 4 / Scale Profile with 1 LOCAL_POD, 1 POD_SELECTOR and 1 CIDR / 3-node test cluster / OVS flows / 30000 / 20000 / 10000 / 0 / 14:35 / 14:40 / 14:45 / 14:50 / 14:55 / 15:00 / 15:05 / 15:10 / 15:1 / pods / namespaces / netpolIngress / netpolEgress / 300 / 100 / 7500 / 7500 / convergence time (20K network policies) / scale limit / OCP 4.12 => 24 min / OCP 4.12 => 15K / OCP 4.14 => 5 min / OCP 4.14 => 60K / OVS flows / 30000 / 20000 / 10000 / 0 / 12:40 / 12:45 / 12:50 / 12:55 / 13:00 / 13:05 / 13:10 / 13:15 / 13:2 / pods / namespaces / netpolIngress / netpolEgress / 300 / 100 / 30000 / 30000
Visuals: Two line/area charts titled OVS flows, each with y axis labelled with values 0, 10000, 20000, 30000 (no unit printed) and x axis of clock times. Top chart: x axis 14:35 to 15:1 at 5 minute ticks (14:40, 14:45, 14:50, 14:55, 15:00, 15:05, 15:10). Series are three thin lines (red, blue, green) and an orange horizontal line near 4000 (about) at the base; each series rises from about 3000 at 14:40 to about 29000 at about 15:04, then flattens near 29000 (about) until about 15:11; filled area in light lavender under the lines. A black dashed vertical line sits at about 15:04. Bottom chart: x axis 12:40 to 13:2 at 5 minute ticks (12:45, 12:50, 12:55, 13:00, 13:05, 13:10, 13:15). Series are blue, green and a red-orange near-flat line at about 2500 (about); blue rises from about 2500 at 12:43 to about 28000 by 12:46 and stays flat (about) until about 12:58; green rises to about 28500 (about) by 12:49 and is flat until 12:58; light blue area fill under the lines. Black dashed vertical line at about 12:48. Red Hat hat logo in red #E00000 with black band and the words Red Hat in bold black and OpenShift 4 in regular black beside it. Two statistics panels, each a white box with thin light grey border containing four labelled green numbers (green about #5BA248): top panel pods 300, namespaces 100, netpolIngress 7500, netpolEgress 7500; bottom panel pods 300, namespaces 100, netpolIngress 30000, netpolEgress 30000. Black line arrows: a vertical arrow pointing up at the left above the lower chart's annotation row, joined by a horizontal line to OCP 4.12 text; a second arrow pointing down with a horizontal line to OCP 4.14 text; the same pattern on the right side pointing up and down to the scale limit rows. KubeCon and CloudNativeCon logos in dark navy #2B2E6B at top right with a thin vertical divider and the text Europe 2024 below in navy.
Slide 18
Tigera: getting involved
Tigera is company behind Calico
Nadia invited us to contribute convergence tracker for Calico
Problem resonated
We get same questions!
Costly to answer
SA team/Customers want self-service
Have our own scale testing infra but…
…it only gets *cough cough* "necessary" maintenance
Grafana 4.x anyone!?
…it's not suitable for self service
…would need polish to open source
Maybe kube-burner is the answer!
Visuals: 1) Tigera logo: orange stylised wildcat head (left) with black uppercase wordmark TIGERA, placed top right of the right column. 2) Tigera mascot illustration: a cartoon orange-and-brown tabby cat sitting in front of a blue circular badge (light blue at top fading to deeper blue at bottom, with a thick black outline), holding an orange-red yarn ball at lower right that overlaps the circle edge. The cat has white muzzle and paws, large white eyes with black pupils, and a smiling expression. The image is a square 578 by 578 px graphic placed unboxed on white with no crop, no tint and no shadow. 3) Within the body text, the phrase '*cough cough*' is set in grey italic as a sardonic aside. 4) A very faint small grey dot sits near the left of the text block just below the 'SA team/Customers want self-service' line at about x 11.8%, y 49.8%, apparently a stray mark.
Slide 19
What we did
(My colleague, Mazdak) built a Calico convergence tracker
Based on OVS approach but tracking iptables/IP sets
Calico's equivalent to OVS table entries
~200 lines of Python
Added kube-burner YAML to scrape Calico-specific Prometheus
metrics
Made a Calico Grafana *cough cough* 10.x Dashboard
All went smoothly with a lot of help from Nadia!
We ran some tests!
Had some perf improvements in v3.27
Interesting to compare Calico v3.26 to v3.27
Visuals: Photograph in the left column, boxed to x 0 to 31.6% and y 13.6 to 100%, cropped at the slide edges. Subject: a gold-rimmed shock-proof dial indicator (white face with black graduations 0 to 9 and a needle, text 'SHOCK-PROOF' and '0.02mm' printed on the face) lying across a caliper, placed on a screen showing white monospace terminal text such as '[stdout] 2024-03-07', '-A cali-OUTPUT', '-A cali-PREROUTING', '--comment "cali:..."' and '-A cali-fip'. A horizontal orange band crosses the screen behind the dial. Composition: close-up, slightly angled, the dial sits left of centre and the text fills the background; lighting is soft, even and natural from the front; dominant colours are black, white, grey steel, gold and orange. Overlay or tint: none. Logos: KubeCon and CloudNativeCon Europe 2024 logo lockup at top right, dark purple #3B2A6B with a vertical divider between the two marks and the words 'Europe 2024' flanked by horizontal rules beneath.
Slide 20
KubeCon
CloudNativeCon
Europe 2024
Running tests…
Before talk, set up:
● Test cluster in GCP with Calico
○ Prometheus metrics enabled
● Persistent results server with Grafana/ElasticSearch/OpenSearch etc.
● Install kube-burner CLI tool
● Checked out
https://github.com/npinaeva/k8s-netpol-scale
your.domain.com
ing svc pod pod pod rs deploy hpa ns netpol limits quota
Grafana
$ kube-burner init -c ./network-policy.yaml
Visuals: 1) Architecture diagram (raster image, 664 by 370 px, about x 49.8 to 78.8%, y 32.1 to 60.9%) inside a rounded rectangle with a thin blue (#3A8FE8) outline and white fill; a dashed dark-grey rounded rectangle inside marks a namespace. Its labels from left to right: 'ing' hexagon icon (blue) with 'your.domain.com' text below, arrow to 'svc' service icon, three arrows fanning out to three 'pod' icons (top, middle, bottom), grey arrows from pods back to a 'rs' replicaset icon, arrow from 'deploy' icon, arrow from 'hpa' icon. Top-left of the namespace: 'ns' icon. Top-right corner outside: Kubernetes wheel icon. Bottom-right inside: 'netpol', 'limits' and 'quota' icons in blue hexagons. Blue (#3B6FD9) icons on white. 2) Logo card (rounded rectangle, white fill, thin dark indigo #3B3B6E outline, about x 80.4 to 96.3%, y 24.9 to 58.5%) containing a dark navy (#0B3A5C) and blue S-shaped swoosh logo (about x 81.7 to 88.9%, y 27.4 to 40.2%) above the orange-to-yellow Grafana swirl logo with the word 'Grafana' in dark grey (#4D4D4D) bold sans (about x 85.2 to 95.3%, y 38.5 to 56.8%). 3) Two light grey block arrows: a vertical double-headed arrow (fill #EAE9E8, dark outline) centred at about x 73 to 76%, y 60.8 to 75.6%; a curved arrow from the diagram bottom to the logo card, grey #BBBAB9 on the left curve and #EAE9E8 on the right, with an upward arrowhead at about x 78.2 to 85.0%, y 60.8 to 76.4%. 4) Dark code bar: rectangle, fill #434343, light grey (#8C8C8C) outline about 1 pt, square corners, about x 18.4 to 94.1%, y 77.9 to 87.9%, containing the monospace command in light text.
Slide 21
DEMO…
shaun@shauns-laptop:~$ gcloud compute ssh --zone=us-central1-a mazdak-netpol-benchmark -- -L 3000:localhost:3000 -A
Welcome to Ubuntu 22.04.3 LTS (GNU/Linux 6.5.0-1015-gcp x86_64)
Last login: Mon Mar 18 19:03:25 2024 from 149.34.156.58
shaun@demo:~$ export KUBECONFIG=~/kubeconfig-v3.27
shaun@demo:~$ kubectl get no
NAME / STATUS / ROLES / AGE / VERSION
shaun-bz-uwsv-kadm-ms / Ready / control-plane / 4h31m / v1.28.8
shaun-bz-uwsv-kadm-node-0 / Ready / <none> / 4h28m / v1.28.8
shaun-bz-uwsv-kadm-node-1 / Ready / <none> / 4h28m / v1.28.8
shaun-bz-uwsv-kadm-node-2 / Ready / <none> / 4h28m / v1.28.8
shaun-bz-uwsv-kadm-node-3 / Ready / <none> / 4h28m / v1.28.8
shaun-bz-uwsv-kadm-node-4 / Ready / <none> / 4h28m / v1.28.8
shaun@demo:~$ ls
bin configure-cluster.sh google-cloud-sdk k8s-netpol-scale kubeconfig-v3.27 reset-cluster.sh snap
shaun@demo:~$ cd k8s-netpol-scale/
Visuals: One photographic screenshot of a dark terminal window, boxed (not full-bleed) and placed at x 12.6%, y 15.0%, 74.7% by 82.0% of the slide, 1439 by 888 pixels. Subject: a Linux terminal session showing SSH into a GCP instance, kubectl get no output listing one control-plane node and five worker nodes all Ready on v1.28.8, then ls output and a cd command being typed. Framing: straight-on, the whole terminal fills the frame with a thin dark grey border. Lighting: flat, even screen light. Dominant colours: near-black background #121416, white text #E0E0E0, green prompt #4CC33B, purple user prompt #B05CE0, blue directory names #2AA7D6. A white play-button triangle overlay sits at the centre-right of the terminal, partly covering the k8s-netpol-scale entry, with a small white block cursor after cd k8s-netpol-scale/. Logos: KubeCon (Kubernetes wheel emblem with wordmark) and CloudNativeCon (stylised N-square emblem with wordmark) with Europe 2024 beneath, all in dark navy.
Slide 22
Results with CIDR-heavy profile (v3.26)…
KubeCon
CloudNativeCon
Europe 2024
jobStart
2024-03-15 / 17:51:54
k8s minor
28
netpol config
netpols_per_namespace
pods_per_namespace
local_pods
pod_selectors
single_ports
port_ranges
peer_namespaces
peer_pods
cidr_rules
40
20
20
0
2
1
0
0
100
timestamp
Name
QPS
Burst
Elapsed time
Iterations
iterationsPerNs
endTimestamp
jobConfig.beforeCle
jobConfig.churnCyc
jobConfig.churn
2024-03-15 17:51:24.129
convergence-tracker
5
10
30 s
1
1
2024-03-15T17:51…
100
default
2024-03-15 17:51:54.351
network-policy-perf
300
300
2.97 mins
20
1
2024-03-15T17:5…
convergence_wait…
100
default
Iptables rules
160000
140000
120000
17:51:30
17:52:00
17:52:30
17:53:00
17:53:30
17:54:00
17:54:
Ipset length
50
0
17:51:30
17:52:00
17:52:30
17:53:00
17:53:30
17:54:00
17:54:
Calico Status
Calico node cpu usage
400%
200%
0%
17:51:30
17:52:00
17:52:30
17:53:00
17:53:30
17:54:00
17:54:
Calico node memory usage (MB)
1000
500
0
17:51:30
17:52:00
17:52:30
17:53:00
17:53:30
17:54:00
17:54:
Active local endpoints
75
50
25
0
17:51:30
17:52:00
17:52:30
17:53:00
17:53:30
17:54:00
17:54:
Active local selectors
100
50
0
17:52:00
17:53:00
17:54:00
Label index endpoints
No data
Active local policies
500
0
17:51:30
17:52:00
17:52:30
17:53:00
17:53:30
17:54:00
17:54:
Label index optimised selectors
No data
Label index unoptimised selectors
No data
Visuals: One Grafana dashboard screenshot, placed unboxed on a white field at x 3.1%, y 15.0%, w 72.7%, h 83.3%, not cropped. Top row: a jobStart panel showing 2024-03-15 17:51:54 in green; a k8s minor panel showing 28 in large green numerals; and a netpol config panel with nine stat values in green: netpols_per_namespace 40, pods_per_namespace 20, local_pods 20, pod_selectors 0, single_ports 2, port_ranges 1, peer_namespaces 0, peer_pods 0, cidr_rules 100. A red circle outline around cidr_rules 100 highlights that value. Below is a table with columns timestamp, Name, QPS, Burst, Elapsed time, Iterations, iterationsPerNs, endTimestamp, jobConfig.beforeCle…, jobConfig.churnCyc…, jobConfig.churn…. Row 1: 2024-03-15 17:51:24.129, convergence-tracker, 5, 10, 30 s, 1, 1, 2024-03-15T17:51…, blank, 100, default. Row 2: 2024-03-15 17:51:54.351, network-policy-perf, 300, 300, 2.97 mins, 20, 1, 2024-03-15T17:5…, convergence_wait…, 100, default. Charts are unlabelled-axis time series sharing x ticks 17:51:30 to 17:54:00 (about 30 s steps). Iptables rules: y 120000 to 160000, one filled area rising from about 110000 at 17:52:00 to about 165000 at 17:53:30, flat afterwards, several coloured series (orange, yellow, green, red, blue) converging near the top. Ipset length: y 0 to 50 (ticks 0, 50), one dark red line at about 47 from 17:52:00 to 17:53:30, filled tan below. Calico node cpu usage: y 0% to 400% (ticks 0%, 200%, 400%); several series peaking about 150% to 190% near 17:52:00, one green peak about 120% near 17:52:30, all near 0% after 17:53:30. Calico node memory usage (MB): y 0 to 1000 (ticks 0, 500, 1000); series between about 100 and 450 MB, peaking about 450 MB near 17:53:00, ending near 17:54:00. Active local endpoints: y 0 to 75 (ticks 0, 25, 50, 75); blue line rising from about 5 at 17:51:30 to about 71 at 17:52:30 and flat to 17:54:00, filled tan. Active local selectors: y 0 to 100 (ticks 0, 50, 100); flat line at 0 from 17:52:00 to 17:54:00. Active local policies: y 0 to 500 (tick 500 and 0); rising from 0 at 17:51:30 to about 780 at 17:52:30, flat to 17:54:00, filled tan. Three panels show No data in grey centred text: Label index endpoints, Label index optimised selectors, Label index unoptimised selectors. A 'Calico Status' collapsible row heading sits between the top section and the charts. Panels are white cards with thin light grey borders on a light grey (#F4F5F5) dashboard background.
Slide 23
Results with CIDR-heavy profile (v3.27)…
KubeCon / CloudNativeCon
Europe 2024
jobStart / 2024-03-15 17:51:54 / k8s minor / 28 / netpol config / netpols_per_namespace 40 / pods_per_namespace 20 / local_pods 20 / pod_selectors 0 / single_ports 2 / port_ranges 1 / peer_namespaces 0 / peer_pods 0 / cidr_rules 100
timestamp / Name / QPS / Burst / Elapsed time / Iterations / iterationsPerNs / endTimestamp / jobConfig.beforeCle… / jobConfig.churnCyc… / jobConfig.churn…
2024-03-15 17:51:24.129 / convergence-tracker / 5 / 10 / 30 s / 1 / 1 / 2024-03-15T17:51… / (blank) / 100 / default
2024-03-15 17:51:54.351 / network-policy-perf / 300 / 300 / 2.97 mins / 20 / 1 / 2024-03-15T17:5… / convergence_wait… / 100 / default
Iptables rules
Ipset length
Calico Status
Calico node cpu usage
Calico node memory usage (MB)
Active local endpoints
Active local selectors
Label index endpoints
Active local policies
Label index optimised selectors
Label index unoptimised selectors
Visuals: Two stacked Grafana dashboard screenshots on a light grey (#F4F5F5) dashboard background. Left image (full dashboard, 1677 by 1080 px, x 3.1 y 15.0 w 72.7 h 83.3) shows a top stat row (jobStart 2024-03-15 17:51:54; k8s minor 28; netpol config with eight green stat values 40, 20, 20, 0, 2, 1, 0, 0, 100), a table of two rows (convergence-tracker, 5 QPS, 10 burst, 30 s elapsed, 1 iteration; network-policy-perf, 300 QPS, 300 burst, 2.97 mins elapsed, 20 iterations), then a grid of time-series area charts: Iptables rules (y 120000 to 160000 ticks, rising to about 160000 near 17:53:00), Calico node cpu usage (0% to 400% axis, peak about 180% near 17:52:00), Active local endpoints (0 to 75, rising to about 70 by 17:52:30), Active local policies (0 to 500 ticks, plateau about 800 from 17:52:30). Right image (1677 by 1080 px, x 29.3 y 15.0 w 70.7 h 83.3) is the enlarged crop, boxed by a blue outline (#3D5A8E, about 3 px stroke, square corners) from about x 29.2 to 99.2 and y 35.6 to 98.2. It shows Iptables rules (50000 to 150000 ticks, plateau about 165000 from 17:58:00), Ipset length (0 to 50 axis, flat about 47 from 17:56:30 to 17:58:00), Calico node cpu usage (0% to 400%, peak about 170% near 17:57:00), Calico node memory usage (MB) (0 to 1000 axis, peak about 500 near 17:57:00, plateau about 350), Active local endpoints (0 to 75, plateau about 70 from 17:57:00), Active local selectors (0 to 100, flat near 0), Label index endpoints (0 to 400, rising to about 410 at 17:57:00), Active local policies (0 to 500 ticks, plateau about 800 from 17:57:00), Label index optimised selectors (0 to 100, flat near 0), Label index unoptimised selectors (0 to 100, flat near 0). Area fills are translucent tan/brown (#D9B8A8 approximate) with thin coloured lines (red, yellow, green, blue). Time axes run 17:51:30 to 17:53:00 on the left and 17:56:30 to 17:59:00 on the right. Orange arrow (#E69138), right-pointing block arrow at x 27.3 y 63.3 w 4.2 h 10.1, overlaps the seam between the two crops and the left Calico cpu chart.
Slide 24
Results with selector-heavy profile (v3.26)…
KubeCon | CloudNativeCon
Europe 2024
jobStart
2024-03-07 / 23:49:23
k8s minor
28
Nodes
20
netpol config
netpols_per_namespace / pods_per_namespace / local_pods / pod_selectors / single_ports / port_ranges / peer_namespaces / peer_pods / cidr_rules
1400 / 40 / 2 / 2 / 0 / 0 / 2 / 2 / 0
timestamp / Name / QPS / Burst / Elapsed time / Iterations / iterationsPerNs / endTimestamp / jobConfig.beforeCle / jobConfig.churnCyc / jobConfig.churn
2024-03-07 23:49:23.802 / network-policy-perf / 300 / 300 / 15.6 mins / 50 / 1 / 2024-03-08T00:0... / convergence_wait... / 100 / default
2024-03-07 23:48:51.537 / convergence-tracker / 5 / 10 / 32 s / 1 / 1 / 2024-03-07T23:4... / (blank) / 100 / default
iptables rules
0 / 50000 / 100000 / 0 / 23:50 / 23:55 / 00:00
ipset length
0 / 10000 / 0 / 23:50 / 23:55 / 00:00
Calico Status
Calico node cpu usage
0% / 200% / 400% / 23:50 / 23:55 / 00:00
Calico node memory usage (MB)
500 / 1000 / 23:50 / 23:55 / 00:00
Active local endpoints
0 / 50 / 100 / 23:50 / 23:55 / 00:00
Active local policies
0 / 5000 / 10000 / 23:50 / 23:55 / 00:00
Active local selectors
0 / 500 / 1000 / 23:50 / 23:55 / 00:00
Label index endpoints
No data
Label index optimised selectors
No data
Label index unoptimised selectors
No data
Visuals: A screenshot of a Grafana dashboard, unframed apart from a faint grey panel border, showing a job run for network policy performance. Top row: a jobStart card showing the time 2024-03-07 23:49:23 in green; a k8s minor card showing 28 in large green numerals; a Nodes card showing 20; and a netpol config strip with nine green stat values (1400, 40, 2, 2, 0, 0, 2, 2, 0). Below is a table with 11 columns and 2 data rows: row 1 is 2024-03-07 23:49:23.802, network-policy-perf, QPS 300, Burst 300, Elapsed time 15.6 mins, Iterations 50, iterationsPerNs 1, endTimestamp 2024-03-08T00:0..., jobConfig.beforeCle convergence_wait..., jobConfig.churnCyc 100, jobConfig.churn default; row 2 is 2024-03-07 23:48:51.537, convergence-tracker, QPS 5, Burst 10, Elapsed time 32 s, Iterations 1, iterationsPerNs 1, endTimestamp 2024-03-07T23:4..., blank, 100, default. A horizontal scrollbar sits under the table. Time-series panels: iptables rules (y axis 0 to 100000, x axis 23:50, 23:55, 00:00, many overlaid coloured filled area series rising from about 0 to about 100000 by 00:00 with purple and orange tints); ipset length (y axis 0 to 10000, about 15000 at the end, many overlaid coloured filled areas plateauing near 15000); Calico node cpu usage (y axis 0% to 400%, many spiky coloured series peaking near 400%, dropping to near 0% after about 00:00); Calico node memory usage (MB) (y axis 500 to 1000, series rising to about 800 and plateauing); Active local endpoints (y axis 0 to 100, rising to about 95 by 00:00 then flat); Active local policies (y axis 0 to 10000, rising to about 11000 then flat); Active local selectors (y axis 0 to 1000+, rising to about 1200 then flat, single brown-pink filled area with red outline); three panels showing the text No data in grey (Label index endpoints, Label index optimised selectors, Label index unoptimised selectors). Plot areas are filled with translucent brown-grey and multicoloured lines; gridlines are light grey.
Slides 25 to 27 continue in the full text file.
Download this deck
The hosted PDF of every library deck is free for readers of the SlideDeck Co newsletter. Join with your email and the viewer and download appear here.
Building a deck of your own? The SlideDeck Co Standard Deck is a slide library for business presentations: reviews, updates and plans.







