The deck opens with a title slide and then a 'strong foundation' overview of Prudential's five businesses: Group Insurance, Individual Life, Retirement, PGIM and International. It moves to a scale view with headline figures on customers, assets under management and capital returned, followed by a description of the integrated model and its distinctive advantages. Strategy is presented next, anchored on four priorities covering focus on chosen businesses, capital optimization, global scale efficiency and geographic choices. Subsequent slides examine secular demand trends, retirement market leadership by country, PGIM's credit platform, and the Group Insurance and Individual Life businesses with market share and sales forecasts. The deck then covers portfolio rotation, the redesigned financial profile with cost targets, and the multi-year path. It closes with success outcomes and a long appendix of footnotes, forward-looking statements and non-GAAP reconciliations. Slides worth studying include the strategic priorities slide, which pairs four numbered pillars with short bullets, the market-share slide for retirement, and the Individual Life sales chart.
Slides worth studying
Questions about this deck
What does the Prudential strategy update say about its strategic priorities?
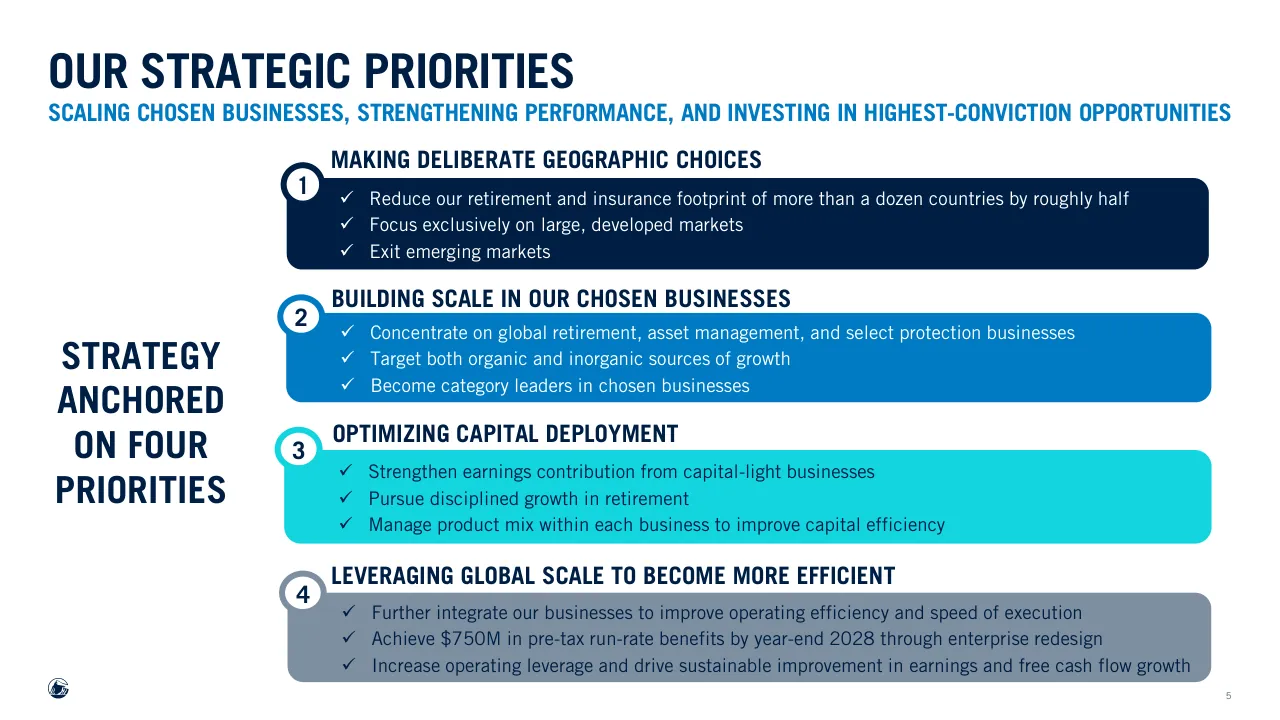
Slide 5 presents four priorities: making deliberate geographic choices, building scale in chosen businesses, optimizing capital deployment, and leveraging global scale to become more efficient. The efficiency priority targets $750M in pre-tax run-rate benefits by year-end 2028 through enterprise redesign.
How many slides does the Prudential presentation have?
The Prudential deck is listed as 23 pages in total. The slide text provided runs through slide 21, the Non-GAAP Measures page, with footnotes on slides 18 and 19 and a forward-looking statements page on slide 20.
What market share and ranking positions does Prudential report in global retirement on slide 9?
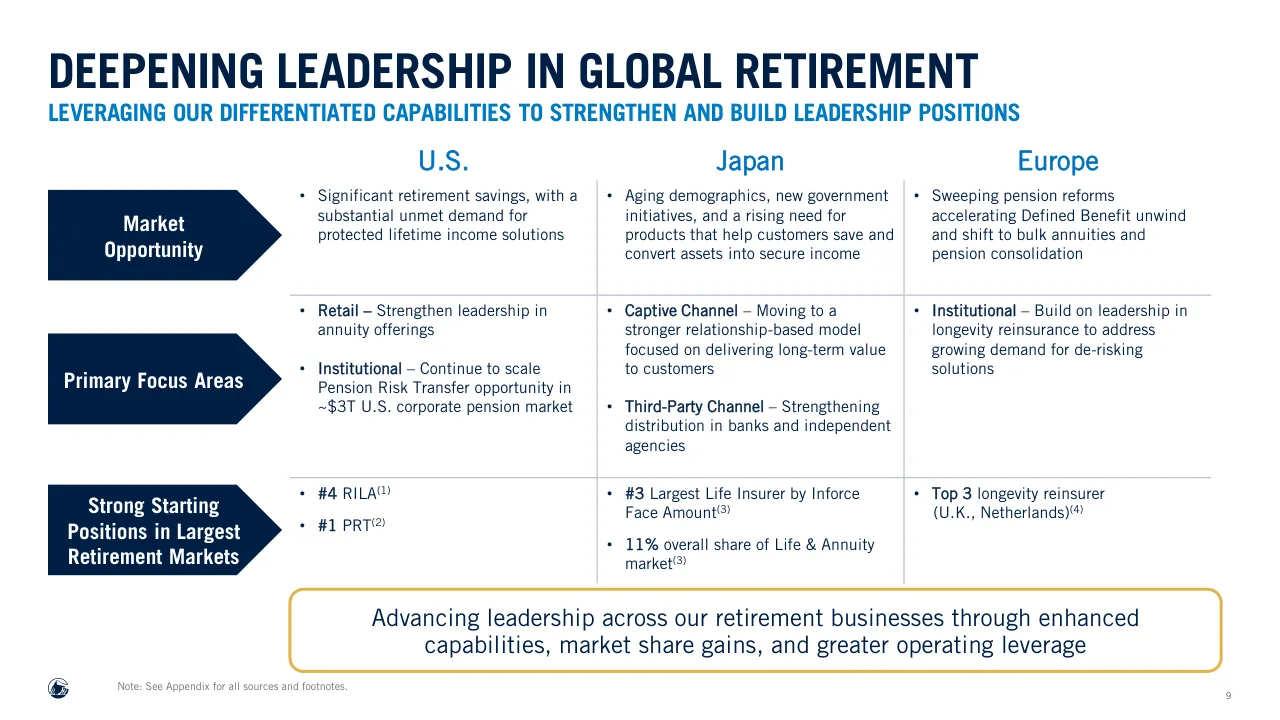
Slide 9 lists #4 in RILA, #1 in PRT, and #3 largest life insurer by inforce face amount. It also shows an 11% overall share of the Life & Annuity market and a top 3 longevity reinsurer position in the U.K. and Netherlands.
What does the Prudential deck say about the PGIM credit platform?
Slide 10 describes a Credit Platform with $1.2T in assets, including Private Credit at $270B and Public Credit at $946B. It also lists 5,400+ lending relationships and a top 5 active fixed income manager ranking globally.
Details
- Company: Prudential
- Year: 2026
- Type: Strategy presentation
- Industry: Financial Services
- Pages: 23
Review score: 7 out of 10, Effective
Presentation quality, judged with the SlideDeck Co review heuristic. Ask, evidence and idea merit are not rated here.
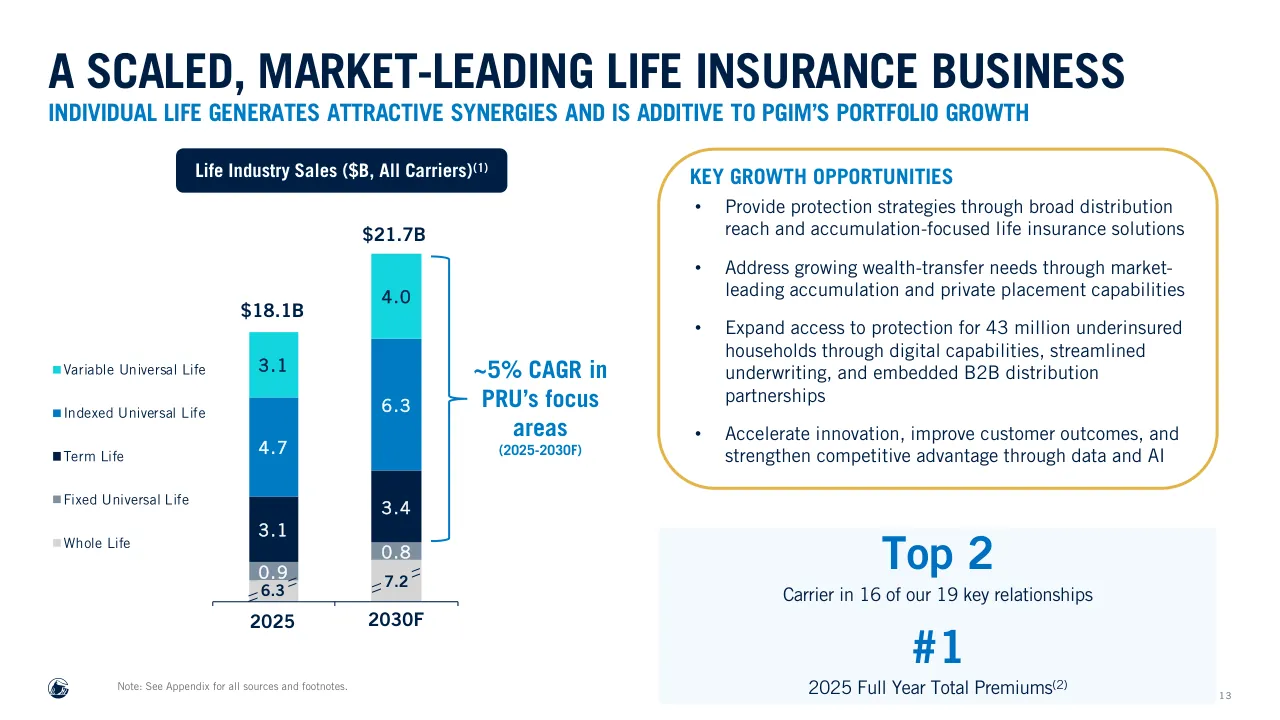
The deck has a consistent, disciplined template with action-style titles and subtitles, strong navy and blue contrast, and a clear route from foundation to priorities to business detail to success outcomes. Slides 5, 9 and 13 are readable and well organized, with the four numbered priorities on slide 5 an effective anchor and the stacked chart on slide 13 labeled directly with a clear growth callout. Weaknesses are consequential: several slides, such as 3, 10, 12 and 14, run small text and tiny chart labels that would be hard to read in a room, slide 9 is a dense text grid, and some slides rely on repeated gold boxes and generic claims rather than a single clear visual takeaway. The appendix is long, with small, dense text that is fine as reference, but the main body of 16 slides is only partly memorable.
Worth keeping: Keep the consistent navy and blue template, the numbered four-priority layout on slide 5, and the labeled stacked bar with CAGR bracket on slide 13.
Most useful repair: Enlarge the small text and chart labels on slides 3, 10, 12 and 14 and cut the dense bullet grid on slide 9 to fewer, larger statements.
What would change the score: I would make each body slide lead with one visual proof point rather than text boxes plus a gold summary box, and the sector charts on slides 7 and 12 should state their takeaway in the title.
Confidence medium. 23 of 23 pages inspected on contact sheets, 4 at readable size. Reviewed 2026-11-08. Model-assisted review (claude-sonnet-5-5).
Full text of the slides (23 slides)
Every slide's words and a description of its charts and images, so the deck can be searched and rebuilt. Also available as Markdown.
Slide 1
STRATEGY UPDATE / August 2026 / Prudential
Visuals: One decorative illustration: a large tonal Prudential emblem occupying the right side of the slide. It shows a thick circular ring (outer edge around x 46 to 100, y 12 to 100) enclosing a stylised angular silhouette of a rock-like or bird-like form with sharp facets and feather-like stripes, all in tonal blues. The emblem is cropped by the right and bottom slide edges and is rendered as flat fills with no shadow or gradient. It sits behind the title. The Prudential logo (a circular emblem with a stylised figure plus the wordmark 'Prudential' in a white serif) appears top-left in white.
Slide 2
A STRONG FOUNDATION
SIGNIFICANT REACH ACROSS BUSINESSES AND MARKETS WITH FAVORABLE STRUCTURAL GROWTH RATES
PGIM
Leading public and
private asset manager by
scale and performance
for institutions;
significant growth
opportunities across
global and retail channels
RETIREMENT
Helping individuals build,
protect, and convert
retirement savings into
lifelong financial security
while helping institutions
fulfill pension
commitments, manage
longevity risk, and support
retirement outcomes
GROUP INSURANCE
Delivering industry leading
workplace benefits and
absence solutions that help
employers and associations
support the financial
security, well-being, and
productivity of their
workforce and members
INDIVIDUAL LIFE
Providing protection,
accumulation, and
wealth planning
solutions to customers
across all life stages
INTERNATIONAL
Providing retirement and
longevity solutions to
millions of new retirees,
while continuing to protect
families and help
customers build long-term
financial security
Starting from a position of strength, anchored in a set of distinctive advantages
2
Visuals: Five white line icons, each centred in its column header band at about y 31% to 36%. PGIM: a banknote with a circle and a second note behind it, in white on navy. RETIREMENT: a shield outline with a check mark, in white on blue. GROUP INSURANCE: four stylised standing figures in a row, in navy on cyan. INDIVIDUAL LIFE: an open umbrella with a curved handle, in white on violet. INTERNATIONAL: a globe with meridian and latitude lines on a stand, in navy on grey. Below the columns, a gold (#E3B449) double-headed block arrow spans almost the full slide width, with pointed tips at both ends and a rectangular shaft. A small navy circular logo mark sits bottom-left. No photographs or charts.
Slide 3
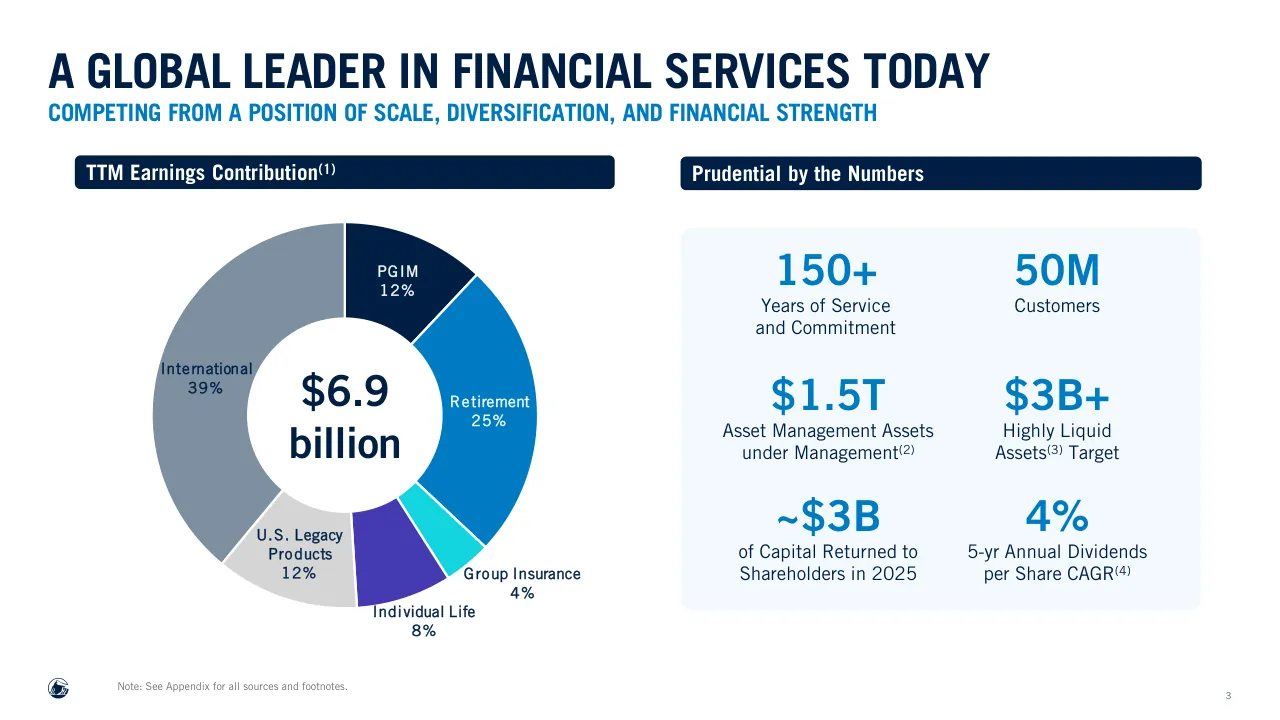
A GLOBAL LEADER IN FINANCIAL SERVICES TODAY / COMPETING FROM A POSITION OF SCALE, DIVERSIFICATION, AND FINANCIAL STRENGTH / TTM Earnings Contribution(1) / PGIM / 12% / Retirement / 25% / Group Insurance / 4% / Individual Life / 8% / U.S. Legacy / Products / 12% / International / 39% / $6.9 / billion / Prudential by the Numbers / 150+ / Years of Service / and Commitment / 50M / Customers / $1.5T / Asset Management Assets / under Management(2) / $3B+ / Highly Liquid / Assets(3) Target / ~$3B / of Capital Returned to / Shareholders in 2025 / 4% / 5-yr Annual Dividends / per Share CAGR(4) / Note: See Appendix for all sources and footnotes. / 3
Visuals: Donut chart with title TTM Earnings Contribution(1) in the navy header bar. Type: donut chart with a white centre hole. Centre label reads $6.9 billion. Values are printed on each segment as percentages of TTM earnings, clockwise from top: PGIM 12% (dark navy #001F45), Retirement 25% (blue #007BC3), Group Insurance 4% (cyan #14D6E0), Individual Life 8% (indigo #443BB2), U.S. Legacy Products 12% (light grey #D6D6D6), International 39% (slate grey #7E8FA1). The six values sum to 100 percent. No axes, no legend, no highlighted points; labels sit directly on or beside each segment. Segments are separated by thin white gaps. Right panel: six statistics in a light blue rounded panel, arranged in a 2 by 3 grid with no icons or photographs: 150+ Years of Service and Commitment; 50M Customers; $1.5T Asset Management Assets under Management; $3B+ Highly Liquid Assets Target; ~$3B of Capital Returned to Shareholders in 2025; 4% 5-yr Annual Dividends per Share CAGR. One small navy logo at bottom-left.
Slide 4
WHAT SETS PRUDENTIAL APART
OUR UNIQUELY INTEGRATED MODEL CREATES A POWERFUL COMPETITIVE MOAT
Retirement
Asset Management
Protection
United States
Japan
Select Retirement Markets in Europe
Distinctive Advantages
✓ Formidable global brand
✓ Trust earned over a century
✓ Industry-leading liability generation capabilities across retirement, protection, and savings products globally
✓ World class asset management platform capable of sourcing, managing, and allocating capital across public and private markets
✓ Breadth of customer relationships and distribution reach
4
Visuals: Circular diagram on the left: a ring of three arc arrows around a two-lobed figure. The gold (#E3B449) Retirement arc runs up the left side from bottom-left to an arrowhead at top-centre-left, with the word Retirement set along it rotated. The navy (#001F45) Asset Management arc runs from top-centre clockwise down the right side to an arrowhead at lower-right, with the words Asset Management set along it rotated. The grey (#7E8FA1) Protection arc runs along the bottom from lower-right to an arrowhead at lower-left, with the word Protection set along it. The arcs are arranged clockwise Retirement, Asset Management, Protection. Inside the ring are two overlapping lobes: a mid-blue (about #3F8FCB) lobe labelled United States at upper-left, a light cyan (about #66DDE5) lobe labelled Japan at right, and a navy (#001F45) lobe at lower-left labelled Select Retirement Markets in Europe in white. The lobes overlap in a yin-yang style, and a white circle with the navy Prudential rock logo sits at the centre. Flat fills, no shadows, no gradients. Right side: a pale-blue (#F3F9FE) rounded rectangle panel with a gold (#E3B449) rounded-rectangle outline containing five navy check-mark bullet items. Small navy Prudential logo at bottom-left.
Slide 5
OUR STRATEGIC PRIORITIES
SCALING CHOSEN BUSINESSES, STRENGTHENING PERFORMANCE, AND INVESTING IN HIGHEST-CONVICTION OPPORTUNITIES
MAKING DELIBERATE GEOGRAPHIC CHOICES
1
✓ Reduce our retirement and insurance footprint of more than a dozen countries by roughly half
✓ Focus exclusively on large, developed markets
✓ Exit emerging markets
BUILDING SCALE IN OUR CHOSEN BUSINESSES
2
✓ Concentrate on global retirement, asset management, and select protection businesses
✓ Target both organic and inorganic sources of growth
✓ Become category leaders in chosen businesses
OPTIMIZING CAPITAL DEPLOYMENT
3
✓ Strengthen earnings contribution from capital-light businesses
✓ Pursue disciplined growth in retirement
✓ Manage product mix within each business to improve capital efficiency
LEVERAGING GLOBAL SCALE TO BECOME MORE EFFICIENT
4
✓ Further integrate our businesses to improve operating efficiency and speed of execution
✓ Achieve $750M in pre-tax run-rate benefits by year-end 2028 through enterprise redesign
✓ Increase operating leverage and drive sustainable improvement in earnings and free cash flow growth
STRATEGY ANCHORED ON FOUR PRIORITIES
5
Visuals: None photographic. Four flat rounded-rectangle bands, stacked vertically with equal gaps, each with a numbered circle badge (1, 2, 3, 4) overlapping its top-left corner. Band 1 is dark navy #001F45, band 2 is process blue #007BC3, band 3 is bright cyan #14D6E0, band 4 is slate grey #7E8FA1. Each badge is a white circle with a coloured ring matching its band (navy, blue, cyan, grey) and the number printed in the same colour. Check marks are Wingdings tick glyphs. A small circular navy logo mark sits at the bottom-left corner.
Slide 6
WHAT SUCCESS LOOKS LIKE
THE OUTCOMES OUR STRATEGY IS DESIGNED TO DELIVER
1
Deliver top-quartile earnings growth excluding the
earnings from our legacy variable annuity business
2
Increase free cash flow conversion
through a greater contribution from fee-based earnings
and highly cash generative businesses
3
Continue to deliver strong returns on capital
by concentrating investment where we have a clear edge –
and moving away from areas that dilute performance
6
Visuals: Three numbered rows, each made of a solid navy rounded square containing a white bold numeral (1, 2, 3) beside an outlined rounded rectangle containing the outcome text. There are no charts, photographs or illustrations. Bottom-left is a small navy circular emblem logo (a stylised ship/rock mark) at about x 3.6%, y 94.5%, roughly 2.5% wide. Position is estimated because no measurement was supplied for the logo.
Slide 7
CAPITALIZING ON LARGE AND DURABLE SECULAR TRENDS
POSITIONED AT THE INTERSECTION OF LARGE, DEVELOPED MARKETS AND ENDURING DEMOGRAPHIC AND SAVINGS TRENDS
More than Three-Quarters of OECD(1) Retirement Assets…
…are in Our Focus Markets
$75T
19%
81%
$63T
20%
80%
4%
$55T
21%
79%
2020
2024
2029P
U.S., Japan, Select Countries in Europe(2) Remaining Countries in the OECD(3)
U.S.
Japan
Select Countries
in Europe
Note: See Appendix for all sources and footnotes.
7
Visuals: Chart: stacked column chart with a trend arrow. Title: none printed, the navy header bar above it serves as its label. Columns (left to right): 2020, 2024, 2029P. Total labels above each column: $55T, $63T, $75T. Each column has a navy bottom segment and a blue top segment. Navy segment labels: 79% (2020), 80% (2024), 81% (2029P). Blue segment labels: 21% (2020), 20% (2024), 19% (2029P). Shares of total sum to 100% in each column. Y axis: none shown; no units or range printed. X axis: years 2020, 2024, 2029P, printed under the baseline. A thin light grey baseline runs under the columns. Annotation: a navy straight arrow line rises from just above the 2020 column to just below the top of the 2029P column, with an oval outline labelled 4% on the line above the 2024 column. Legend below the chart: navy square labelled U.S., Japan, Select Countries in Europe(2); blue square labelled Remaining Countries in the OECD(3). Highlighted points: none. Right-side graphic: a large grey (#7E8FA1) right-pointing chevron between the two columns. Three gold-outlined rounded rectangles stacked vertically, each containing a thin navy outline map: top, a map of the contiguous U.S.; middle, a map of Japan; bottom, a map of Europe with Scandinavia, the British Isles and the Mediterranean shown. Each map sits to the left of its label inside its card. Logo: a small navy circular emblem at bottom left.
Slide 8
GROWING NEED FOR RETIREMENT INCOME AND ADVICE
PUTTING THE DURABLE DEMAND INTO CONTEXT…
Demographic shifts in U.S. / fueling a growing retirement gap…
30M
Americans will turn 65 by 2030(1)
$137T
U.S. Retirement Savings Gap by 2050, / up from $28T in 2015(2)
54%
U.S. pre-retirees worry about / outliving their savings(3)
Growing need for financial advice as Japanese / households shift assets to investments…
39M
65+ segment by 2050, projected to / grow despite shrinking population(4)
~40%
Household financial assets in investments / by 2034, up from 20% in 2024(5)
<5%
Households have access to holistic / financial advice(6)
Note: See Appendix for all sources and footnotes.
8
Visuals: No photographs, charts, tables or diagrams. Only non-text elements are two pale rounded panels behind the stat columns, two navy header bars, and a small navy logo mark at bottom left. The logo is a small navy emblem with curved strokes, about 1.6 percent of slide width, with no other logos on the slide.
Slide 9
DEEPENING LEADERSHIP IN GLOBAL RETIREMENT
LEVERAGING OUR DIFFERENTIATED CAPABILITIES TO STRENGTHEN AND BUILD LEADERSHIP POSITIONS
U.S. / Japan / Europe
Market / Opportunity
• Significant retirement savings, with a / substantial unmet demand for / protected lifetime income solutions
• Aging demographics, new government / initiatives, and a rising need for / products that help customers save and / convert assets into secure income
• Sweeping pension reforms / accelerating Defined Benefit unwind / and shift to bulk annuities and / pension consolidation
Primary Focus Areas
• Retail – Strengthen leadership in / annuity offerings / • Institutional – Continue to scale / Pension Risk Transfer opportunity in / ~$3T U.S. corporate pension market
• Captive Channel – Moving to a / stronger relationship-based model / focused on delivering long-term value / to customers / • Third-Party Channel – Strengthening / distribution in banks and independent / agencies
• Institutional – Build on leadership in / longevity reinsurance to address / growing demand for de-risking / solutions
Strong Starting / Positions in Largest / Retirement Markets
• #4 RILA(1) / • #1 PRT(2)
• #3 Largest Life Insurer by Inforce / Face Amount(3) / • 11% overall share of Life & Annuity / market(3)
• Top 3 longevity reinsurer / (U.K., Netherlands)(4)
Advancing leadership across our retirement businesses through enhanced / capabilities, market share gains, and greater operating leverage
Note: See Appendix for all sources and footnotes.
9
Visuals: No photographs, charts or tables. Three navy right-pointing chevron shapes (arrow tabs with a point on the right side) label the rows: Market Opportunity, Primary Focus Areas, and Strong Starting Positions in Largest Retirement Markets. Thin light grey grid rules divide the columns and rows. A gold rounded-rectangle outline frames the takeaway sentence. A small navy circular corporate logo sits at bottom left.
Slide 10
PGIM OFFERS UNIQUE VALUE TODAY
SCALED CREDIT PLATFORM FOUNDATIONAL TO HOW WE WIN IN OUR CHOSEN BUSINESSES
Credit Platform – $1.2T in Assets(1)
Private Credit – $270B
Public Credit – $946B
Large global sourcing network drives differentiated origination across direct, indirect, sponsored, and non-sponsored markets
Industry-leading position across key asset classes provides broad market access and information advantage
Key Strategies
Key Strategies
• Real Estate Debt (Investment Grade, Senior Debt, High Yield, Agriculture)
• Corporate Credit (IG, High Yield, Direct Lending, Mezzanine)
• Infrastructure Debt (Core Infrastructure, Power, Energy)
• Asset Backed Finance (Consumer, Commercial, Mortgage, Fund, Specialty)
• IG Corporates
• Securitized Products (CLOs, ABS, CMBS, RMBS)
• Government Debt
• Leveraged Finance (High Yield, Bank Loans)
• Emerging Market Debt
• Mortgages
• Money Markets
• Multi-Sector
• Municipals
Top 5
Active Fixed Income Manager Globally(2)
5,400+
Lending Relationships
2nd Largest
Real Estate Manager(2)
#2
Player in Private Placements(2)
Top 10
Global CLO Manager(3)
Note: See Appendix for all sources and footnotes.
10
Visuals: Non-text elements: (a) a solid navy horizontal bar (#001F45) with white bold heading 'Credit Platform – $1.2T in Assets' and a superscript (1); (b) a solid blue box (#007BC3) with white heading 'Private Credit – $270B'; (c) a solid bright cyan box (#14D6E0) with navy heading 'Public Credit – $946B'; (d) a large rounded rectangle with gold outline (#E7B33B approx., about 3 pt stroke, corner radius about 8% of panel width) and no fill, enclosing five statistics: 'Top 5' over 'Active Fixed Income Manager Globally(2)', '5,400+' over 'Lending Relationships', '2nd Largest' over 'Real Estate Manager(2)', '#2' over 'Player in Private Placements(2)', 'Top 10' over 'Global CLO Manager(3)'; (e) a small circular navy logo emblem (PGIM mark) at bottom-left. No photographs, charts or tables.
Slide 11
FURTHER ADVANCE PGIM'S MARKET-LEADING FRANCHISE
BUILD ON STRENGTHS AND EXPAND INTO NEW ASSET CLASSES, GEOGRAPHIES, AND CLIENT CHANNELS
Scale and Broaden Capabilities
Grow leadership in credit and real assets,
scale asset-backed finance and direct lending, and
expand into primary private equity and infrastructure equity
Expand International Footprint
Roughly half of the $147T(1) global asset pool sits outside North America,
compared to only a quarter of PGIM's third-party AUM today
Diversify Client Base
Expanding where demand for private market solutions is accelerating
including insurance, sovereign wealth, and family office channels
Growing origination advantage to broaden investor base and drive
differentiated deal flow, third-party capital growth, and syndication earnings
Note: See Appendix for all sources and footnotes.
11
Visuals: Three horizontal rows, each with a dark navy rounded rectangle (label) at left, a solid bright blue right-pointing triangle in the middle, and a white rounded rectangle with a blue outline at right. Row 1 label: Scale and Broaden Capabilities; right box: Grow leadership in credit and real assets, scale asset-backed finance and direct lending, and expand into primary private equity and infrastructure equity. Row 2 label: Expand International Footprint; right box: Roughly half of the $147T(1) global asset pool sits outside North America, compared to only a quarter of PGIM's third-party AUM today. Row 3 label: Diversify Client Base; right box: Expanding where demand for private market solutions is accelerating including insurance, sovereign wealth, and family office channels. Below the rows is a white rounded rectangle with a gold outline containing the callout sentence. Also a small navy circular PGIM-style logo at bottom left. No charts, photographs or icons beyond the logo.
Slide 12
GROUP INSURANCE STRATEGY ANCHORED IN DIVERSIFICATION / INCREASING PRESENCE IN A LARGE AND GROWING ADDRESSABLE MARKET / Industry Product Mix / Other / Vision / Life / Disability / $200B(1) / Dental / Supp Health / Medical Stop Loss / Products we offer / Products we do not offer / Industry Segment Mix / Association / <500 lives / 5,000+ / lives / $200B(1) / 500 - 4,999 / lives / Pru segment maturity: / Significant / Moderate / Limited / #3 / Group Life and AD&D(2) / #6 / Group Disability(2) / KEY GROWTH OPPORTUNITIES / • Retaining our leadership position in the National market segment (5,000+ lives) while expanding in the Premier market / segment (100-5,000 lives) and in disability, absence management, and supplemental health / • Deepening employer and participant relationships to better cross-sell our expanding product portfolio / Note: See Appendix for all sources and footnotes. / 12
Visuals: Chart 1, donut, titled Industry Product Mix, centre label $200B(1). Seven segments clockwise from top: Life (navy #001F45, about 15% of ring), Disability (navy, about 12%), Supp Health (navy, about 5%), Medical Stop Loss (navy, about 15%), Dental (blue #007BC3, about 25%), Vision (blue, about 7%), Other (blue, about 5%). No values are printed; shares are estimates marked about. Navy means Products we offer, blue means Products we do not offer. Legend below the chart: navy swatch Products we offer, blue swatch Products we do not offer. Chart 2, donut, titled Industry Segment Mix, centre label $200B(1). Segments clockwise from top: Association (navy, about 1%), 5,000+ lives (navy, about 37%), 500 - 4,999 lives (blue #007BC3, about 47%), <500 lives (cyan #19D3DE, about 13%). No values printed; shares are estimates marked about. Legend in one row: Pru segment maturity: then navy swatch Significant, blue swatch Moderate, cyan swatch Limited. Highlight panel at right with two large statistics: #3 in blue #0070C0 above Group Life and AD&D(2), and #6 in blue above Group Disability(2). No photographs, logos other than the small footer mark, or icons other than that mark.
Slide 13
A SCALED, MARKET-LEADING LIFE INSURANCE BUSINESS
INDIVIDUAL LIFE GENERATES ATTRACTIVE SYNERGIES AND IS ADDITIVE TO PGIM’S PORTFOLIO GROWTH
Life Industry Sales ($B, All Carriers)(1)
$21.7B
$18.1B
Variable Universal Life
Indexed Universal Life
Term Life
Fixed Universal Life
Whole Life
4.0
3.1
6.3
4.7
3.4
3.1
0.8
0.9
7.2
6.3
~5% CAGR in
PRU’s focus
areas
(2025-2030F)
2025
2030F
KEY GROWTH OPPORTUNITIES
Provide protection strategies through broad distribution
reach and accumulation-focused life insurance solutions
Address growing wealth-transfer needs through market-
leading accumulation and private placement capabilities
Expand access to protection for 43 million underinsured
households through digital capabilities, streamlined
underwriting, and embedded B2B distribution
partnerships
Accelerate innovation, improve customer outcomes, and
strengthen competitive advantage through data and AI
Top 2
Carrier in 16 of our 19 key relationships
#1
2025 Full Year Total Premiums(2)
Note: See Appendix for all sources and footnotes.
13
Visuals: Stacked column chart titled Life Industry Sales ($B, All Carriers)(1) with two columns, 2025 (total $18.1B) and 2030F (total $21.7B); no y-axis or gridlines are shown, values are in $B printed inside segments. 2025 segments from bottom to top: Whole Life 6.3, Fixed Universal Life 0.9, Term Life 3.1, Indexed Universal Life 4.7, Variable Universal Life 3.1. 2030F segments from bottom to top: Whole Life 7.2, Fixed Universal Life 0.8, Term Life 3.4, Indexed Universal Life 6.3, Variable Universal Life 4.0. Legend at left, top to bottom: Variable Universal Life (cyan), Indexed Universal Life (blue), Term Life (navy), Fixed Universal Life (grey-blue), Whole Life (light grey). Small diagonal white break marks cross the Whole Life segments of both columns. A blue curly brace to the right of the 2030F column spans from its top to the top of its Fixed Universal Life segment, annotated ~5% CAGR in PRU’s focus areas (2025-2030F). A thin navy horizontal baseline runs under both columns with short tick ends. Also a rounded gold-outlined box, a navy label box, a pale blue callout panel with Top 2 and #1, and a navy Prudential rock logo at bottom-left. No photographs.
Slide 14
ROTATING CAPITAL TO HIGHEST CONVICTION OPPORTUNITIES
MAKING INTENTIONAL CHOICES TO REDUCE OUR FOOTPRINT
Focus Markets
U.S.
Japan
Select Countries
in Europe
Asset
Management
PGIM
Retirement
PRT
Annuities
Retirement &
Investment
Products
PRT &
Longevity
Reinsurance
Protection
Group Insurance
Individual Life
Life Insurance
14
Visuals: A matrix diagram (not a chart) with no photographs. Top row: three solid blue rounded rectangles labelled U.S., Japan and Select Countries in Europe, each about 14.4% wide and 10% tall at y 32.0%, x positions 32.0%, 51.5% and 71.0%. Left column: three solid navy rounded rectangles labelled Asset Management (y 45.4%), Retirement (y 60.2%) and Protection (y 74.9%), each 14.4% wide and 10% tall at x 13.6%. Grid cells: one wide white outlined rounded rectangle spanning x 32.0% to 85.4% at y 45.4% labelled PGIM; in the Retirement row (y 60.2%) three white outlined rounded rectangles labelled PRT Annuities (x 32.0%), Retirement & Investment Products (x 51.5%) and PRT & Longevity Reinsurance (x 71.0%); in the Protection row (y 74.9%) two white outlined rounded rectangles labelled Group Insurance Individual Life (x 32.0%) and Life Insurance (x 51.5%), with the x 71.0% cell empty. The outer gold rounded rectangle has no fill, a gold stroke and a very large corner radius. No arrows or connectors, no icons, no photographs.
Slide 15
REDESIGNING THE FINANCIAL PROFILE
ACHIEVING OUR OBJECTIVES WILL REQUIRE CONSISTENT EXECUTION AND DISCIPLINED CAPITAL ALLOCATION
~$750M in pre-tax
run-rate benefits
by year-end 2028, with the
full benefit reflected in 2029
operating results
150 basis points
improvement
to adjusted operating expense
ratio(1) over the next 3 years
Stronger Earnings Growth
and a Higher Quality Mix
Structural Efficiency
Better Balance Between
Capital-Intensive
and Capital-Light
Businesses
15
Visuals: Two white rounded-rectangle callout cards with gold outlines (about #E5B43A, thin stroke) containing centred figures, and a pale blue panel (#E5F1FF at about 39% opacity) behind three rounded boxes: navy #001F45 box, blue #007BC3 box and cyan #14D6E0 box, all same height and aligned at the top of the row, with the cyan box slightly higher. No charts, photographs or icons; one small navy circular logo emblem at bottom left.
Slide 16
A MULTI-YEAR JOURNEY, BUT THE PATH IS CLEAR / POSITIONING PRUDENTIAL TO DRIVE GREATER VALUE CREATION / Strengthening our financial profile and reinforcing the / AA ratings position we maintain today / Repositioning Prudential to be a more focused and / resilient company across market cycles / Creating strong financial outcomes, including top-quartile / earnings growth, excluding the earnings from our legacy variable / annuity business, and improving free cash flow conversion / 16
Visuals: Three filled rounded-square icon tiles, each about 12.9% wide and 15.2% tall, containing white line icons. Tile 1 (navy #001F45) holds a balance scale: a vertical post with a pivot circle on top, a horizontal beam, two hanging pans and a flat base. Tile 2 (blue #007BC3) holds a strategy board: a square clipboard-like frame with a spiral binding on its left edge, containing an X mark, an upward arrow, a circle and a second X connected by a curved path. Tile 3 (teal #14D6E0) holds a bar chart: an L-shaped axis frame with an upward diagonal arrow and three vertical bars of different heights. Icons are white, thin-stroked (about 2px), outline style. No photographs, charts or tables.
Slide 17
APPENDIX
17
Visuals: Illustration: a large stylised marlin or swordfish silhouette, with its bill pointing up-left, set inside a thick circular ring. It is rendered tone-on-tone in two blues (#00315E on #001F45) and is cropped by the right and bottom slide edges. Composition is right-weighted, with the ring's top sitting near 12% of height. There is no photographic lighting, overlay or gradient. Logo: one small white circular emblem with a stylised fish or wave mark at the bottom-left corner (about 1.6% wide), with no other logos on the slide.
Slide 18
FOOTNOTES / Slide / 3 / 1Based on last twelve months of pre-tax adjusted operating income through 2Q26. Pie chart percentages exclude Corporate & Other operations loss / of $1,488 million. See reconciliation of non-GAAP measures in Appendix for more information. / 2As of June 30, 2026. Reflects ~$1.49T of PGIM AUM. / 3Highly liquid assets predominantly include cash, short-term investments, U.S. Treasury securities, obligations of other U.S. government / authorities and agencies, and/or foreign government bonds. / 4From 2020 to 2025; based on annual dividend per share. / 7 / 1Organization for Economic Co-operation and Development, Pensions at a Glance, 2020 & 2024: Assets earmarked for retirement (pillar 2 and / pillar 3 assets) in OECD countries. 2029 estimates based on Prudential analysis and should not be relied upon as predictions of future industry / performance. Actual results may differ significantly. / 2Select Countries in Europe include U.K. and Netherlands. / 3Remaining OECD Countries: Australia, Austria, Belgium, Canada, Chile, Colombia, Costa Rica, Czechia, Denmark, Estonia, Finland, France, / Germany, Greece, Hungary, Iceland, Ireland, Israel, Italy, Korea, Latvia, Lithuania, Luxembourg, Mexico, New Zealand, Poland, Portugal, Slovak / Republic, Slovenia, Spain, Sweden, Switzerland, Türkiye. / 8 / 1LIMRA / Alliance for Lifetime Income ‘Peak 65’ Research. / 2World Economic Forum – “Investing in (and for) Our Future” White Paper, June 2019. / 3Alliance for Lifetime Income – Protected Retirement Income and Planning (PRIP) Study 2025. / 4United Nations World Population Prospects 2022. / 5Bank of Japan Flow of Funds Statistics, BCG Analysis. / 6Nomura Research Institute, BCG Analysis. / 9 / 1LIMRA U.S. FY25 Sales Data. / 2Largest manager of pension risk assets based on LIMRA, U.S. Group Annuity Risk Transfer Survey, fourth quarter 2024. / 3Based on Inforce excluding Japan Post as of March 31, 2025. Data published by LIAJ. / 4Lane Clark & Peacock LLP. / 18
Visuals: Table with two columns and four body rows plus a header row. Header: column 1 reads Slide; column 2 is blank. Row 1: slide 3, four numbered footnotes (1 to 4) on pre-tax adjusted operating income, AUM and dividend per share. Row 2: slide 7, three numbered footnotes (1 to 3) on OECD pension assets, European countries and the list of remaining OECD countries. Row 3: slide 8, six numbered footnotes (1 to 6) on research sources. Row 4: slide 9, four numbered footnotes (1 to 4) on LIMRA, pension risk assets, Inforce data and Lane Clark & Peacock. Rules: a thick navy rule under the header; thin navy rules between rows; a thin navy vertical rule separating the columns. Small navy circular logo at bottom left (emblem with a ship or wave motif).
Slide 19
FOOTNOTES (CONTINUED)
Slide
10
Note: PGIM sourced data as June 30, 2026 (unless otherwise noted). Assets represent gross AUM/AUA unless otherwise noted. Asset totals may
not sum due to rounding. AUM/AUA are based on company estimates and subject to change.
1Includes public credit, private credit (includes corporate credit, infrastructure debt, and asset-backed finance), and private real estate debt.
2Pension & Investments. 'Top Money Managers' June 2025.
3CreditFlux, March 2026.
11
12026 Boston Consulting Group Global Asset Management Report.
12
1LIMRA and EY.
2LIMRA 2Q25 In Force Rankings.
13
1Life Insurance coverage includes both individual and workplace group life insurance, based on LIMRA. 2030 estimates are provided for strategic
planning purposes only, do not represent LIMRA projections, and should not be relied upon as predictions of future industry performance. Actual
results may differ significantly.
2LIMRA.
15
1Adjusted Operating Expense Ratio excludes PGIM and is calculated on a constant exchange rate basis. Reflects general and administrative
expenses excluding variable expenses and certain other items as a percentage of revenues excluding Pension Risk Transfer premiums and certain
other items.
19
Visuals: Table with two columns and five data rows plus a header row. Header row: column 1 'Slide', column 2 blank. Row 1: slide 10, footnote text 'Note: PGIM sourced data...' followed by footnotes 1, 2 and 3 on separate lines. Row 2: slide 11, footnote 1 '2026 Boston Consulting Group Global Asset Management Report.' Row 3: slide 12, footnotes 1 'LIMRA and EY.' and 2 'LIMRA 2Q25 In Force Rankings.' Row 4: slide 13, footnote 1 (a long life insurance coverage note) and footnote 2 'LIMRA.' Row 5: slide 15, footnote 1 'Adjusted Operating Expense Ratio ...'. Rules: one thick dark navy horizontal rule under the header row, thin dark navy horizontal rules between rows, a thin vertical navy rule separating the two columns. Small monochrome navy logo at bottom-left, no photographs.
Slide 20
FORWARD-LOOKING STATEMENTS
Certain of the statements included in this presentation, the 2Q26 Earnings Call presentation, and made during the earnings and strategy call, including those regarding our strategy, objectives, goals, priorities, expectations, plans, initiatives, or anticipated future performance, financial targets and objectives and capital priorities, planned transactions, actions to reduce costs and the expected impacts thereof, PGIM margin expansion, expected impacts to AOI of our annual assumption updates, our expectations for the pension risk transfer business, our expectations for earnings growth in the Individual Life business, the expected full year 2026 loss for our Corporate & Other segment, those under the heading “Seasonality of Key Financial Items,” trends and opportunities, the durability of our earnings profile, the expected duration, financial impact, including the expected impact to adjusted operating income, capital, economic solvency ratio and cash flow, and outcome of the Prudential of Japan sales suspension and the related remediation efforts, constitute forward-looking statements within the meaning of the U.S. Private Securities Litigation Reform Act of 1995. Words such as “expects”, “believes”, “anticipates”, “includes”, “plans”, “assumes”, “estimates”, “projects”, “intends”, “should”, “will”, “shall”, or variations of such words are generally part of forward-looking statements. Forward-looking statements are made based on management’s current expectations and beliefs concerning future developments and their potential effects upon Prudential Financial, Inc. and its subsidiaries. Prudential Financial, Inc.’s actual results may differ, possibly materially, from expectations or estimates reflected in such forward-looking statements. Certain important factors that could cause actual results to differ, possibly materially, from expectations or estimates reflected in such forward-looking statements include, among others, that our remediation efforts in Japan may be unsuccessful or take longer than we expect, that we may uncover additional misconduct, that the sales suspension at Prudential of Japan may continue for longer than we expect, losses on investments or financial contracts due to deterioration in credit quality or value, or counterparty default; losses on insurance products due to mortality experience, morbidity experience or policyholder behavior experience that differs significantly from our expectations when we price our products. Additional factors and uncertainties that could cause actual results to differ can be found in the “Risk Factors” and “Forward-Looking Statements” sections included in Prudential Financial, Inc.’s Annual Reports on Form 10-K and Quarterly Reports on Form 10-Q. Each of our forward-looking statements contained herein is subject to the risk that we will be unable to execute our strategy and other risks. In addition, our statements under the heading “Seasonality of Key Financial Items” are subject to the risk that different earnings and expense patterns will emerge. Prudential Financial, Inc. does not undertake to update any particular forward-looking statement included in this presentation.
____________________________________________________________________________
Prudential Financial, Inc. of the United States is not affiliated with Prudential plc which is headquartered in the United Kingdom.
20
Slide 21
NON-GAAP MEASURES / This presentation includes references to adjusted operating income. Consolidated adjusted operating income is not calculated based on accounting principles generally accepted / in the United States of America (GAAP). For additional information about adjusted operating income and adjusted book value and the comparable GAAP measures, including / reconciliations between the comparable measures, please refer to our quarterly results news releases, which are available on our website at investor.prudential.com. / Reconciliations are also included as part of this presentation. / We believe that our use of these non-GAAP measures helps investors understand and evaluate the Company’s performance and financial position. The presentation of adjusted / operating income as we measure it for management purposes enhances the understanding of the results of operations by highlighting the results from ongoing operations and the / underlying profitability of our businesses. Trends in the underlying profitability of our businesses can be more clearly identified without the fluctuating effects of the items / described below. Adjusted book value augments the understanding of our financial position by providing a measure of net worth that is primarily attributable to our business / operations separate from the portion that is affected by capital and currency market conditions, and by isolating the accounting impact associated with insurance liabilities that / are generally not marked to market and the supporting investments that are marked to market through accumulated other comprehensive income under GAAP. However, these / non-GAAP measures are not substitutes for income and equity determined in accordance with GAAP, and the adjustments made to derive these measures are important to an / understanding of our overall results of operations and financial position. The schedules accompanying this presentation provide reconciliations of non-GAAP measures with the / corresponding measures calculated using GAAP. Additional historic information relating to our financial performance is located on our website at investor.prudential.com. / Adjusted operating income is a non-GAAP measure used by the Company to evaluate segment performance and to allocate resources. Adjusted operating income excludes / “Realized investment gains (losses), net, and related charges and adjustments”. A significant element of realized investment gains and losses are impairments and credit-related / and interest rate-related gains and losses. Impairments and losses from sales of credit-impaired securities, the timing of which depends largely on market credit cycles, can vary / considerably across periods. The timing of other sales that would result in gains or losses, such as interest rate-related gains or losses, is largely subject to our discretion and / influenced by market opportunities as well as capital and other factors. / 21
Visuals: None, apart from the small navy Prudential logo mark at the bottom left corner.
Slide 22
NON-GAAP MEASURES (CONTINUED)
Realized investment gains (losses) within certain businesses for which such gains (losses) are a principal source of earnings, and those associated with terminating hedges of foreign currency earnings and current period yield adjustments, are included in adjusted operating income. Adjusted operating income generally excludes realized investment gains and losses from products that contain embedded derivatives, and from associated derivative portfolios that are part of an asset-liability management program related to the risk of those products. Adjusted operating income also excludes gains and losses from changes in value of certain assets and liabilities relating to foreign currency exchange movements that have been economically hedged or considered part of our capital funding strategies for our international subsidiaries, as well as gains and losses on certain investments that are designated as trading. Adjusted operating income also excludes investment gains and losses on assets supporting experience-rated contractholder liabilities and changes in experience-rated contractholder liabilities due to asset value changes, because these recorded changes in asset and liability values are expected to ultimately accrue to contractholders. Additionally, adjusted operating income excludes the changes in fair value of equity securities that are recorded in net income. Additionally, adjusted operating income excludes the impact of annual assumption updates and other refinements included in the above items.
Adjusted operating income excludes “Change in value of market risk benefits, net of related hedging gains (losses)”, which reflects the impact from changes in current market conditions, and market experience updates, reflecting the immediate impacts in current period results from changes in current market conditions on estimates of profitability, which we believe enhances the understanding of underlying performance trends. Adjusted operating income also excludes the results of Divested and Run-off Businesses, which are not relevant to our ongoing operations, and discontinued operations and earnings attributable to noncontrolling interests, each of which is presented as a separate component of net income under GAAP. Additionally, adjusted operating income excludes other items, such as certain components of the consideration for acquisitions, which are recognized as compensation expense over the requisite service periods, and goodwill impairments. Earnings attributable to noncontrolling interests is presented as a separate component of net income under GAAP and excluded from adjusted operating income. The tax effect associated with pre-tax adjusted operating income is based on applicable IRS and foreign tax regulations inclusive of pertinent adjustments.
Adjusted operating income does not equate to “Net income” as determined in accordance with U.S. GAAP. Adjusted operating income is not a substitute for income determined in accordance with U.S. GAAP, and our definition of adjusted operating income may differ from that used by other companies. The items above are important to an understanding of our overall results of operations. However, we believe that the presentation of adjusted operating income as we measure it for management purposes enhances the understanding of our results of operations by highlighting the results from ongoing operations and the underlying profitability of our businesses. Trends in the underlying profitability of our businesses can be more clearly identified without the fluctuating effects of the items described above.
22
Slide 23
RECONCILIATIONS BETWEEN ADJUSTED OPERATING INCOME
AND THE COMPARABLE GAAP MEASURE
($ millions, except per share data)
Twelve Months
Ended
6/30/2026
Net income (loss) attributable to Prudential Financial, Inc.
$ 3,918
Income (loss) attributable to noncontrolling interests and redeemable noncontrolling interests
148
Net income (loss)
4,066
Less: Earnings attributable to noncontrolling interests and redeemable noncontrolling interests
148
Income (loss) attributable to Prudential Financial, Inc.
3,918
Less: Equity in earnings of joint ventures and other operating entities, net of taxes and earnings attributable
to noncontrolling interests and redeemable noncontrolling interests
9
Income (loss) before equity in earnings of joint ventures and other operating entities
3,909
Less: Reconciling Items:
Realized investment gains (losses), net, and related charges and adjustments
(2,132)
Change in value of market risk benefits, net of related hedging gains (losses)
(64)
Market experience updates
(18)
Divested and Run-off Businesses:
Closed Block division
(51)
Other Divested and Run-off Businesses
345
Equity in earnings of joint ventures and other operating entities, and earnings attributable to noncontrolling
interests and redeemable noncontrolling interests
(72)
Other adjustments(1)
(6)
Total reconciling items, before income taxes
(1,998)
Less: Income taxes, not applicable to adjusted operating income
(502)
Total reconciling items, after income taxes
(1,496)
After-tax adjusted operating income
5,405
Income taxes, applicable to adjusted operating income
1,500
Adjusted operating income (loss) before income taxes
$ 6,905
After-tax adjusted operating income per share
$ 15.25
(1) Represents adjustments not included in the above reconciling items, including certain components of consideration for business acquisitions, which are recognized as compensation expense over the
requisite service periods.
23
Visuals: One table, no chart or photograph. Columns: (1) row label column, left-aligned, containing the line-item descriptions; (2) a narrow dollar-sign column showing $ before selected totals; (3) a single value column headed Twelve Months Ended 6/30/2026, right-aligned. Rows in order with values: Net income (loss) attributable to Prudential Financial, Inc. $ 3,918; Income (loss) attributable to noncontrolling interests and redeemable noncontrolling interests 148; Net income (loss) 4,066; Less: Earnings attributable to noncontrolling interests and redeemable noncontrolling interests 148; Income (loss) attributable to Prudential Financial, Inc. 3,918; Less: Equity in earnings of joint ventures and other operating entities, net of taxes and earnings attributable to noncontrolling interests and redeemable noncontrolling interests 9; Income (loss) before equity in earnings of joint ventures and other operating entities 3,909; Less: Reconciling Items: (no value); Realized investment gains (losses), net, and related charges and adjustments (2,132); Change in value of market risk benefits, net of related hedging gains (losses) (64); Market experience updates (18); Divested and Run-off Businesses: (no value); Closed Block division (51); Other Divested and Run-off Businesses 345; Equity in earnings of joint ventures and other operating entities, and earnings attributable to noncontrolling interests and redeemable noncontrolling interests (72); Other adjustments(1) (6); Total reconciling items, before income taxes (1,998); Less: Income taxes, not applicable to adjusted operating income (502); Total reconciling items, after income taxes (1,496); After-tax adjusted operating income 5,405; Income taxes, applicable to adjusted operating income 1,500; Adjusted operating income (loss) before income taxes $ 6,905; After-tax adjusted operating income per share $ 15.25. Rules: thin navy horizontal lines under the column header and under the subtotal figures, plus a double rule under the $ 6,905 total. Small navy logo mark at bottom left. No highlighted rows and no colour fills.
Download this deck
The hosted PDF of every library deck is free for readers of the SlideDeck Co newsletter. Join with your email and the viewer and download appear here.
Preparing a strategy presentation of your own? The SlideDeck Co Consulting Deck is a slide library with a statement of work and a worked client case.