
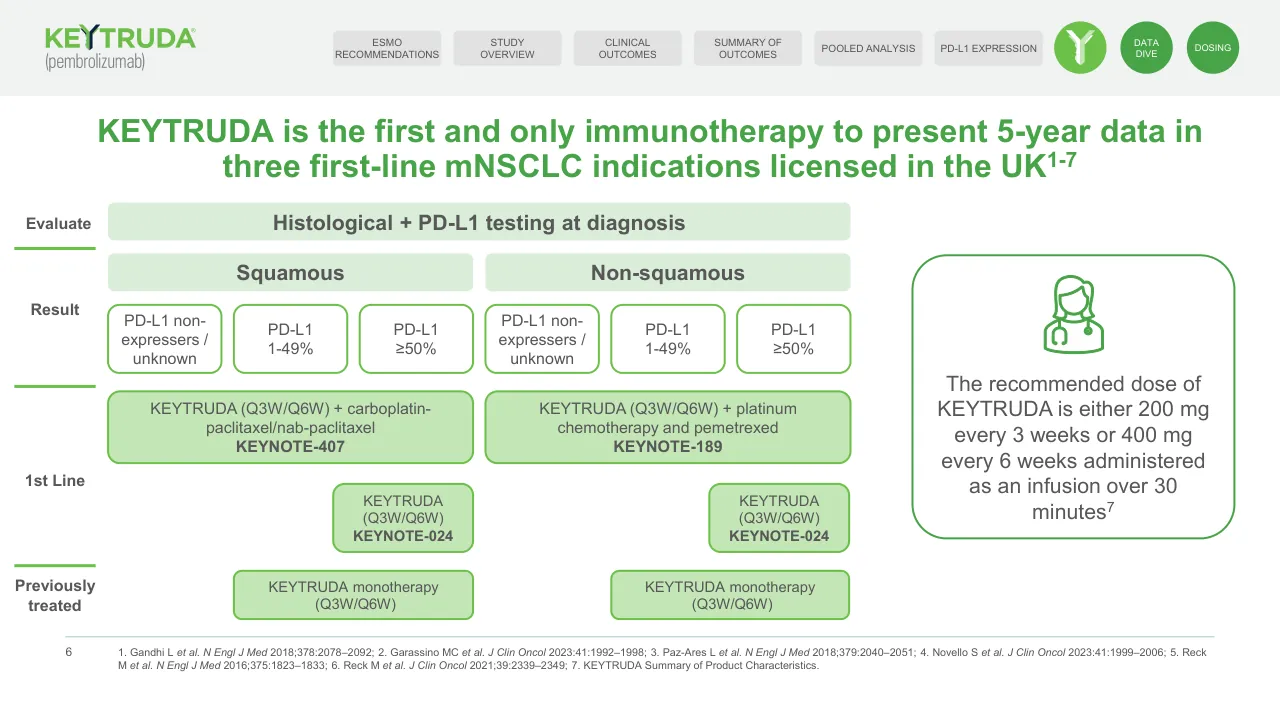
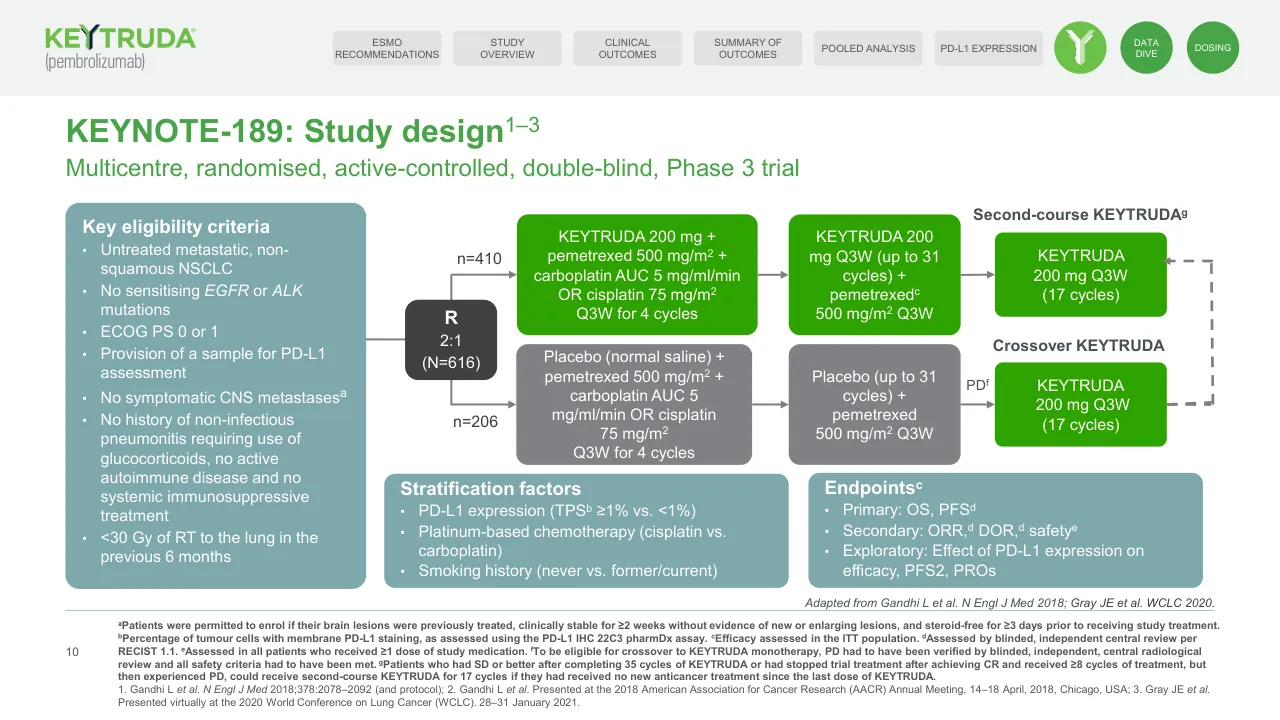
This is a healthcare professional education deck from MSD Oncology about KEYNOTE-189, a Phase 3 trial of KEYTRUDA (pembrolizumab) plus chemotherapy as first-line treatment for metastatic non-squamous NSCLC. It opens with a regulatory and prescribing title slide, followed by a note on external links and abbreviations, then the clinical rationale, the current guideline position and the licensed UK indications. The middle of the deck covers the trial itself: study design, definitions of analyses, statistical considerations, patient baseline characteristics and PD-L1 subgroups. Efficacy then follows through overall survival, progression-free survival, response rates and duration of response, first at the original analysis and then in the 5-year update. Safety data, including adverse events, immune-mediated events and renal events, come next, followed by post-hoc analyses in patients with liver or brain metastases and quality-of-life results. The deck closes with efficacy and safety summary slides and a health-related quality of life summary. Slides worth studying include the timeline-style indications graphic on slide 6, the study design flow chart on slide 10, and the subgroup forest plots, which are built as clear comparison visuals.
Slides worth studying
Questions about this deck
How many slides does the Merck & Co. KEYNOTE-189 deck have?
The deck has 89 pages, and slide 1 is the title slide for KEYNOTE-189 with KEYTRUDA (pembrolizumab) plus chemotherapy. Slide 10 covers the study design.
What are the primary endpoint outcomes in the Merck & Co. KEYNOTE-189 deck?
On slide 16, the original analysis (median follow-up 10.5 months) reported OS with HR 0.49 (95% CI 0.38–0.64; p<0.001) and PFS with HR 0.52 (95% CI 0.43–0.64; p<0.001) for KEYTRUDA plus platinum and pemetrexed versus placebo. The slide also gives updated and 5-year update results for both endpoints.
What is the study design of the Merck & Co. KEYNOTE-189 trial?
Slide 10 describes KEYNOTE-189 as a multicentre, randomised, active-controlled, double-blind, Phase 3 trial, with randomisation shown as 2:1 and N=616. The primary endpoints are OS and PFS.
What are the analysis cut-off dates and median follow-up times in the Merck & Co. KEYNOTE-189 deck?
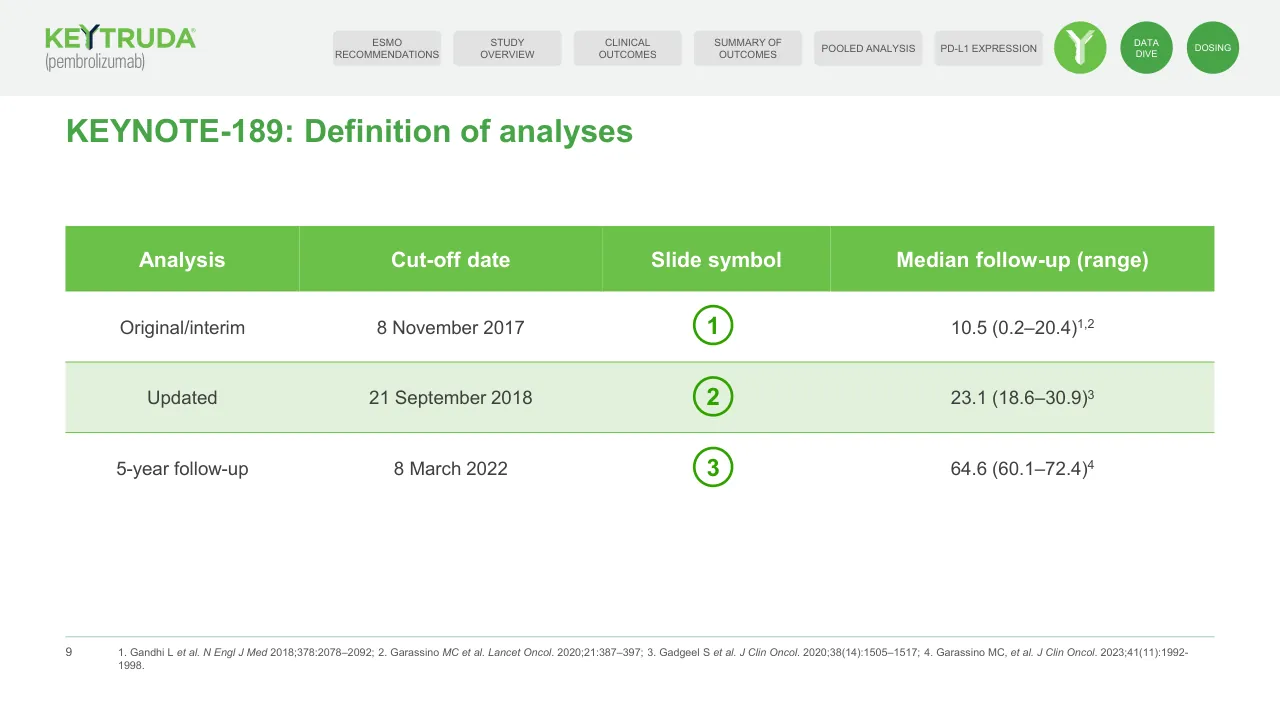
Slide 9 lists the original/interim analysis with a cut-off date of 8 November 2017 and median follow-up of 10.5 (0.2–20.4) months. The updated analysis has a cut-off of 21 September 2018 with 23.1 (18.6–30.9) months, and the 5-year follow-up has a cut-off of 8 March 2022 with 64.6 (60.1–72.4) months.
Details
- Company: Merck & Co. (MSD outside the US and Canada)
- Year: 2024
- Type: Course deck
- Industry: Pharmaceuticals
- Pages: 89
Review score: 7 out of 10, Effective
Presentation quality, judged with the SlideDeck Co review heuristic. Ask, evidence and idea merit are not rated here.
This is a competent reference deck for healthcare professionals. A consistent template, a persistent navigation bar and a numbered analysis symbol (defined on slide 9) keep the long data sequence navigable, and slides 6 and 10 turn the indications and the trial design into clear diagrams. The weaknesses are consequential: most data slides use titles that name the analysis rather than state the finding, the Kaplan-Meier, subgroup and AE charts on slides 19 to 28 and 43 to 47 are small with tiny tables and axis text, and footnotes are very small throughout. The 89-page route repeats slides (the design, OS and PFS pages recur around slides 58 to 63), which suits a lookup resource more than a sequential presentation.
Worth keeping: Keep the consistent green and grey arm colouring, the persistent section navigation bar, the analysis symbols from slide 9, and the diagram work on slides 6 and 10.
Most useful repair: Enlarge the plots and embedded summary tables on slides 19 to 28 and 43 to 47 so axis labels and statistics are readable at the back of a room.
What would change the score: Rewrite data slide titles as findings and add a short takeaway line, and cut the duplicated slides 58 to 63 or replace them with links.
Confidence medium. 72 of 89 pages inspected on contact sheets, 4 at readable size. Reviewed 2026-11-08. Model-assisted review (claude-sonnet-5-5).
Full text of the slides (89 slides)
Every slide's words and a description of its charts and images, so the deck can be searched and rebuilt. Also available as Markdown.
Slide 1
MSD Oncology / KEYNOTE-189: / KEYTRUDA® (pembrolizumab) / plus chemotherapy for the / first-line treatment of / metastatic, non-squamous, / EGFR/ALK-wild-type NSCLC / Including 5-year pooled / analysis for squamous and / non-squamous PD-L1 TPS / <1% mNSCLC / These slides are provided to UK healthcare professionals as a data / resource for personal education. To ensure compliance with all relevant / codes and regulations, these slides must not be amended. / Adverse events should be reported. Reporting forms and information can be found at https://yellowcard.mhra.gov.uk/ or search for / MHRA Yellow Card in the Google Play or Apple App Store. Adverse events should also be reported to MSD (Tel: 0208 1548000). By / clicking this link, you will be redirected to the MHRA website. / GB prescribing information can be found by clicking this link. / NI prescribing information can be found by clicking this link. / If using a downloaded version of this material, please ensure that you are accessing the most recent version of the prescribing information. / GB-PDO-03207 Date of preparation September 2024 / Legal Category: POM / Copyright © 2024 Merck & Co., Inc., Rahway, NJ, USA and its affiliates. All rights reserved. / Merck Sharp & Dohme (UK) Limited, 120 Moorgate London, EC2M 6UR.
Visuals: Photograph of a boat-building workshop (full-bleed on the left 66% of the slide, full height). Subject: a white-hulled wooden boat on stands with its bow toward the left, and a man in a dark long-sleeved shirt working on the hull at right with a tool raised, while stacked blue barrels, shelving and tools fill the background. Composition: wide shot, boat occupying the centre-left, worker at centre-right, cluttered workshop behind. Lighting: warm, low-key, diffuse light from the back of the shed. Dominant colours: brown, tan and rust with white hull and blue barrels. Overlay: a white hand-drawn line illustration (sun rays, mountains, clouds, birds, trees, a figure, waves) drawn over the photo across the upper and middle area and the boat's waterline. A dark gradient or tint darkens the lower part of the photo behind the white text. Logos: KEYTRUDA (pembrolizumab) wordmark in green with a navy Y accent, lower right panel; MSD logo (teal hexagonal knot symbol with grey MSD wordmark), lower right panel. Green horizontal rule under the main title. Thin white rectangular outline around the adverse-event notice.
Slide 2
KEYTRUDA® / (pembrolizumab) / ESMO RECOMMENDATIONS / STUDY OVERVIEW / CLINICAL OUTCOMES / SUMMARY OF OUTCOMES / POOLED ANALYSIS / PD-L1 EXPRESSION / DATA DIVE / DOSING / External websites and abbreviations / Links to external websites / The links in this slide deck will redirect you to third-party websites. / Please note that: / ● MSD does not review or control the content of any third-party website / ● MSD does not endorse and is not responsible for the accuracy, / content, practices or standards of any third-party sources / Abbreviations / Definitions of all abbreviations used in this deck can be found / at the end of the presentation / 2
Visuals: One line-art illustration of a single-masted sailboat on water, drawn in black ink with white fill. The boat is seen from the side, heading right: a tall mast with a mainsail and a jib, a cabin with four round portholes, a small figure with a cap seated at the stern steering, and wave lines under the hull. It is unboxed on a white background, not cropped, with generous white space around it. Dominant colour is black on white. Above the header there is no photo. Also present: the KEYTRUDA logo (green wordmark with a navy and green Y-shaped antibody glyph replacing the Y, with '(pembrolizumab)' in lighter green beneath) and three circular icon buttons: a green circle with a white Y glyph, a green circle with 'DATA DIVE' in white, and a green circle with 'DOSING' in white. A thin horizontal grey rule at about 88% height.
Slide 3
KEYTRUDA
(pembrolizumab)
ESMO RECOMMENDATIONS
STUDY OVERVIEW
CLINICAL OUTCOMES
SUMMARY OF OUTCOMES
POOLED ANALYSIS
PD-L1 EXPRESSION
DATA DIVE
DOSING
There is an urgent unmet need for treatment options for patients with mNSCLC and low PD-L1 expression
Patient outcomes remain suboptimal with standard chemotherapeutics and durable disease control is rarely achieved1
The median OS is 8–12 months for patients receiving supportive care in addition to induction platinum-based chemotherapy2
Many patients may not survive long enough to receive second-line therapy3
When patients are treated first-line with chemotherapy alone, they have lower chances of survival compared to those treated with chemotherapy plus immunotherapy, chemotherapy plus bevacizumab, or immunotherapy alone3
High expressers (TPS ≥50%) with no contraindications
to use of immunotherapy:
KEYTRUDA monotherapy is a standard first-line option4
3
1. Leonetti A et al. Drug Resist Updat 2019;46:100644; 2. Chen R et al. J Hematol Oncol 2020;13:58. 3. Bazhenova L et al Cancer Treat Res Commun 2022;33:100637; 4. ESMO Guidelines. Available at: https://www.esmo.org/content/download/227453/3874538.
Visuals: Logo: KEYTRUDA wordmark in bright green (#6CBD45) with a dark navy Y-shaped antibody glyph replacing the letter Y, a small registered mark at top right of the wordmark, and '(pembrolizumab)' in grey #585858 condensed sans beneath it; located at about x 3.5 y 2.8 w 12.5 h 7.5. Icons: three round header buttons. First is a light green (#6CBD45) filled circle at about x 82.3 y 3.0 w 4.3 h 7.6 containing a white stylised Y-shaped antibody glyph. Second is a mid green (#3FA34D) filled circle at about x 87.5 y 3.0 w 4.2 h 7.6 labelled DATA DIVE in white. Third is a mid green (#3FA34D) filled circle at about x 92.7 y 3.0 w 4.2 h 7.6 labelled DOSING in white. Navigation: six rounded grey rectangles, fill #E3E3E3, each labelled in uppercase grey text. No photographs, charts or diagrams.
Slide 4
KEYTRUDA (pembrolizumab)
ESMO RECOMMENDATIONS
STUDY OVERVIEW
CLINICAL OUTCOMES
SUMMARY OF OUTCOMES
POOLED ANALYSIS
PD-L1 EXPRESSION
DATA DIVE
DOSING
2023 ESMO guidelines recommended KEYTRUDA in combination with chemotherapy for the first-line treatment of non-oncogene-addicted mNSCLC irrespective of PD-L1 expression 1
● Highest level of evidence (I) and recommendation grade (A)
● Established as a standard treatment option for patients with any PD-L1 score and PS 0–1, and without contraindications to IO
● Magnitude of clinical benefit recognised with an ESMO-MCBS score of 4
4
1. Hendriks LE, et al. Ann Oncol. 2023;24(4):339–357.
Visuals: Logo: KEYTRUDA wordmark in bold green capitals with the Y letter stylised in dark navy, and '(pembrolizumab)' in lighter green lowercase beneath it, at top left. Icons: three green circular buttons at top right; the first (about 82% from left) shows a white stylised Y glyph on light green #6CBE45; the second (about 87.5% from left) reads DATA DIVE in white on green #48A548; the third (about 92.7% from left) reads DOSING in white on green #48A548. Illustration: three black-outlined line drawings of birds in flight (gulls or pigeons, wings spread) on white, one small bird at upper left (about 81% to 88% x, 18% to 23% y), one larger bird at upper right (about 88% to 97% x, 14% to 26% y), and one bird with wings folded down at right (about 92% to 97% x, 30% to 38% y). Birds are not cropped, not tinted and have no overlay. No photograph. Rule: thin light blue-grey line across the content width.
Slide 5
KEYTRUDA® (pembrolizumab) mNSCLC indications¹
KEYTRUDA, in combination with carboplatin and either paclitaxel or nab-paclitaxel, is indicated for the first-line treatment of
metastatic, squamous NSCLC in adults
KEYTRUDA, in combination with pemetrexed and platinum chemotherapy, is indicated for the first-line treatment of metastatic,
non-squamous NSCLC in adults whose tumours have no EGFR- or ALK-positive mutations
KEYTRUDA as monotherapy is indicated for the first-line treatment of metastatic NSCLC in adults whose tumours express
PD-L1 with a ≥50% TPS with no EGFR- or ALK-positive tumour mutations
KEYTRUDA as monotherapy is indicated for the treatment of locally advanced or metastatic NSCLC in adults whose tumours
express PD-L1 with a ≥1% TPS and who have received at least one prior chemotherapy regimen. Patients with EGFR- or
ALK-positive tumour mutations should also have received targeted therapy before receiving KEYTRUDA
The recommended dose of KEYTRUDA in adults is either 200 mg Q3W or 400 mg Q6W administered intravenously over 30
minutes. For the use of KEYTRUDA as part of combination therapy, see the Summary of Product Characteristics (SmPC) for
the concomitant therapies
Refer to the Summary of Product Characteristics and Risk Minimisation materials available on the EMC website before
prescribing, in order to help reduce the risks associated with KEYTRUDA
5
1. KEYTRUDA (pembrolizumab) Summary of Product Characteristics. Available from: https://www.medicines.org.uk/emc/product/2498/smpc
Please note that clicking these links will redirect you to external websites, for which MSD does not review or control the content.
ESMO RECOMMENDATIONS
STUDY OVERVIEW
CLINICAL OUTCOMES
SUMMARY OF OUTCOMES
POOLED ANALYSIS
PD-L1 EXPRESSION
DATA DIVE
DOSING
Visuals: Logo: KEYTRUDA wordmark in bright green letters with a dark navy Y-shaped stroke in the middle of the Y, with '(pembrolizumab)' in grey lowercase beneath, and a small registered mark at top right of the wordmark, top left of slide. Three round icon buttons at top right: first a light green circle (about #6DBE45) containing a white stylised Y-shaped antibody icon; second a mid green circle (about #4AA843) labelled DATA DIVE in white; third a mid green circle (about #4AA843) labelled DOSING in white. Illustration: black line drawing (no fill, thin outlines) of a man in a hard hat and safety goggles, with a beard, in a long-sleeved shirt, using a hammer at a workbench to strike a small object; a toolbox/case sits on the bench and a vise is under the bench top; the bench is a long horizontal table with two legs at left and right; the figure stands at right of the bench, full figure visible, boxed in its own placed area with no crop and no tint over a transparent background. Rule: thin grey horizontal line across the footer area. Nav tabs are rectangles, not images.
Slide 6
KEYTRUDA (logo) (pembrolizumab)
ESMO RECOMMENDATIONS
STUDY OVERVIEW
CLINICAL OUTCOMES
SUMMARY OF OUTCOMES
POOLED ANALYSIS
PD-L1 EXPRESSION
DATA DIVE
DOSING
KEYTRUDA is the first and only immunotherapy to present 5-year data in three first-line mNSCLC indications licensed in the UK 1-7
Evaluate
Histological + PD-L1 testing at diagnosis
Squamous
Non-squamous
Result
PD-L1 non-expressers / unknown
PD-L1 1-49%
PD-L1 ≥50%
PD-L1 non-expressers / unknown
PD-L1 1-49%
PD-L1 ≥50%
1st Line
KEYTRUDA (Q3W/Q6W) + carboplatin-paclitaxel/nab-paclitaxel KEYNOTE-407
KEYTRUDA (Q3W/Q6W) + platinum chemotherapy and pemetrexed KEYNOTE-189
KEYTRUDA (Q3W/Q6W) KEYNOTE-024
KEYTRUDA (Q3W/Q6W) KEYNOTE-024
Previously treated
KEYTRUDA monotherapy (Q3W/Q6W)
KEYTRUDA monotherapy (Q3W/Q6W)
The recommended dose of KEYTRUDA is either 200 mg every 3 weeks or 400 mg every 6 weeks administered as an infusion over 30 minutes 7
6
1. Gandhi L et al. N Engl J Med 2018;378:2078–2092; 2. Garassino MC et al. J Clin Oncol 2023:41:1992–1998; 3. Paz-Ares L et al. N Engl J Med 2018;379:2040–2051; 4. Novello S et al. J Clin Oncol 2023:41:1999–2006; 5. Reck M et al. N Engl J Med 2016;375:1823–1833; 6. Reck M et al. J Clin Oncol 2021;39:2339–2349; 7. KEYTRUDA Summary of Product Characteristics.
Visuals: Logo: KEYTRUDA wordmark in bright green with a dark navy Y-shaped stem device over the E, and a registered mark; '(pembrolizumab)' in green beneath. Icons: three circular green buttons at top right, the first with a white Y-shaped icon on bright green #6CC04A-like fill, the second dark-green circle with 'DATA DIVE' and the third mid-green circle with 'DOSING'. Diagram: a flow-style grid of rounded rectangles. Row 'Evaluate' has one wide light green bar with 'Histological + PD-L1 testing at diagnosis'. Row 'Result' has two header bars (Squamous, Non-squamous) above six white outlined boxes with green borders: PD-L1 non-expressers / unknown, PD-L1 1-49%, PD-L1 ≥50% in each column. Row '1st Line' has two wide pale green boxes (KEYTRUDA (Q3W/Q6W) + carboplatin-paclitaxel/nab-paclitaxel, KEYNOTE-407; and KEYTRUDA (Q3W/Q6W) + platinum chemotherapy and pemetrexed, KEYNOTE-189) above two smaller boxes (KEYTRUDA (Q3W/Q6W), KEYNOTE-024) placed under the PD-L1 1-49% column of... specifically under the right-hand boxes of each column. Row 'Previously treated' has two boxes reading KEYTRUDA monotherapy (Q3W/Q6W) under the PD-L1 1-49% position of each column. No arrows or connecting lines. Callout: rounded rectangle with green outline containing a green line icon of a clinician with stethoscope (a woman in a white coat with a stethoscope) above the dose text. No photographs.
Slide 7
KEYTRUDA (pembrolizumab) / ESMO RECOMMENDATIONS / STUDY OVERVIEW / CLINICAL OUTCOMES / SUMMARY OF OUTCOMES / POOLED ANALYSIS / PD-L1 EXPRESSION / DATA DIVE / DOSING / KEYNOTE-189 / KEYTRUDA (pembrolizumab) plus chemotherapy for the first-line treatment of metastatic, non-squamous, EGFR/ALK-wild-type NSCLC / Post-hoc exploratory pooled analysis / Including KEYNOTE-189 and KEYNOTE-407, 5-year survival with KEYTRUDA (pembrolizumab) plus chemotherapy for mNSCLC with PD-L1 TPS <1% / 7
Visuals: Two rounded rectangular panels: left panel solid green #6CC04A with a large rounded corner radius (about 15% of slide height) containing a centred bold white heading KEYNOTE-189 and a centred white body paragraph; right panel solid navy #2A3166 with the same corner radius containing a centred bold white heading 'Post-hoc exploratory pooled analysis' and a centred white body paragraph. Header: KEYTRUDA (pembrolizumab) logo at top left (green wordmark KEYTRUDA with a stylised Y-shaped antibody glyph in navy and green, and '(pembrolizumab)' beneath in grey-green). Three round icons at top right: first is a light green #6CC04A circle with a white Y-shaped antibody glyph, second is a medium green circle #4CA84A with white text DATA DIVE, third is a medium green circle with white text DOSING. Six light grey #E3E3E3 rounded rectangular tabs with dark grey #585858 uppercase labels ESMO RECOMMENDATIONS, STUDY OVERVIEW, CLINICAL OUTCOMES, SUMMARY OF OUTCOMES, POOLED ANALYSIS, PD-L1 EXPRESSION. A thin grey horizontal line across the slide above the page number.
Slide 8
KEYTRUDA® (pembrolizumab) / ESMO / RECOMMENDATIONS / STUDY / OVERVIEW / CLINICAL / OUTCOMES / SUMMARY OF / OUTCOMES / POOLED ANALYSIS / PD-L1 EXPRESSION / DATA / DIVE / DOSING / KEYNOTE-189: KEYTRUDA / (pembrolizumab) plus chemotherapy for / the first-line treatment of metastatic, / non-squamous, EGFR/ALK-wild-type NSCLC¹ / 1. Gandhi L et al. N Engl J Med 2018;378:2078–2092 (and supplementary appendix).
Visuals: Illustration: a white line-drawn sailboat on calm water at the lower right, with a single mast, a mainsail and jib, a hull with three oval portholes or hatches, a small seated figure with a cap at the stern, and wavy water lines beneath the hull. Four white line-drawn seabirds in flight sit above and to the right of the mast, two in profile with wings spread and two smaller ones further apart. The drawing is unboxed and not cropped, has a flat white stroke on the green with no shading, and no overlay or tint. Logo: the green KEYTRUDA wordmark with a navy Y-shaped stroke in the letter Y, a registered mark at the top right, and the lowercase word (pembrolizumab) beneath it in grey. Icons: a light green circle containing a white Y-shaped glyph, and two green circles with white text. Navigation: six light grey rounded rectangles, each with grey uppercase label text.
Slide 9
KEYTRUDA (pembrolizumab) / ESMO RECOMMENDATIONS / STUDY OVERVIEW / CLINICAL OUTCOMES / SUMMARY OF OUTCOMES / POOLED ANALYSIS / PD-L1 EXPRESSION / DATA DIVE / DOSING / KEYNOTE-189: Definition of analyses / Analysis / Cut-off date / Slide symbol / Median follow-up (range) / Original/interim / 8 November 2017 / 1 / 10.5 (0.2–20.4) 1,2 / Updated / 21 September 2018 / 2 / 23.1 (18.6–30.9) 3 / 5-year follow-up / 8 March 2022 / 3 / 64.6 (60.1–72.4) 4 / 9 / 1. Gandhi L et al. N Engl J Med 2018;378:2078–2092; 2. Garassino MC et al. Lancet Oncol. 2020;21:387–397; 3. Gadgeel S et al. J Clin Oncol. 2020;38(14):1505–1517; 4. Garassino MC, et al. J Clin Oncol. 2023;41(11):1992- / 1998.
Visuals: Table, not a chart. Columns: Analysis; Cut-off date; Slide symbol; Median follow-up (range). Row 1: Original/interim | 8 November 2017 | circled numeral 1 | 10.5 (0.2–20.4) with superscript 1,2. Row 2 (shaded): Updated | 21 September 2018 | circled numeral 2 | 23.1 (18.6–30.9) with superscript 3. Row 3: 5-year follow-up | 8 March 2022 | circled numeral 3 | 64.6 (60.1–72.4) with superscript 4. Each slide symbol is a green outlined circle (about 3.2% wide) containing a bold green numeral. Header row is solid green with white bold text. Thin green horizontal rules separate rows. Logo: the KEYTRUDA wordmark in green with a stylised Y in dark navy, with '(pembrolizumab)' in green lowercase beneath. Three round icons in the header: a light green circle with a white stylised Y glyph, a mid green circle with white text DATA DIVE, and a deeper green circle with white text DOSING.
Slide 10
KEYNOTE-189: Study design1–3 / Multicentre, randomised, active-controlled, double-blind, Phase 3 trial / Key eligibility criteria / Untreated metastatic, non-squamous NSCLC / No sensitising EGFR or ALK mutations / ECOG PS 0 or 1 / Provision of a sample for PD-L1 assessment / No symptomatic CNS metastasesa / No history of non-infectious pneumonitis requiring use of glucocorticoids, no active autoimmune disease and no systemic immunosuppressive treatment / <30 Gy of RT to the lung in the previous 6 months / R / 2:1 / (N=616) / n=410 / KEYTRUDA 200 mg + pemetrexed 500 mg/m² + carboplatin AUC 5 mg/ml/min OR cisplatin 75 mg/m² Q3W for 4 cycles / KEYTRUDA 200 mg Q3W (up to 31 cycles) + pemetrexed c 500 mg/m² Q3W / Second-course KEYTRUDAg / KEYTRUDA 200 mg Q3W (17 cycles) / n=206 / Placebo (normal saline) + pemetrexed 500 mg/m² + carboplatin AUC 5 mg/ml/min OR cisplatin 75 mg/m² Q3W for 4 cycles / Placebo (up to 31 cycles) + pemetrexed 500 mg/m² Q3W / PDf / Crossover KEYTRUDA / KEYTRUDA 200 mg Q3W (17 cycles) / Stratification factors / PD-L1 expression (TPSb ≥1% vs. <1%) / Platinum-based chemotherapy (cisplatin vs. carboplatin) / Smoking history (never vs. former/current) / Endpointsc / Primary: OS, PFSd / Secondary: ORRd DORd safetye / Exploratory: Effect of PD-L1 expression on efficacy, PFS2, PROs / Adapted from Gandhi L et al. N Engl J Med 2018; Gray JE et al. WCLC 2020. / 10 / a Patients were permitted to enrol if their brain lesions were previously treated, clinically stable for ≥2 weeks without evidence of new or enlarging lesions, and steroid-free for ≥3 days prior to receiving study treatment. / b Percentage of tumour cells with membrane PD-L1 staining, as assessed using the PD-L1 IHC 22C3 pharmDx assay. c Efficacy assessed in the ITT population. d Assessed by blinded, independent central review per RECIST 1.1. e Assessed in all patients who received ≥1 dose of study medication. f To be eligible for crossover to KEYTRUDA monotherapy, PD had to have been verified by blinded, independent, central radiological review and all safety criteria had to have been met. g Patients who had SD or better after completing 35 cycles of KEYTRUDA or had stopped trial treatment after achieving CR and received ≥8 cycles of treatment, but then experienced PD, could receive second-course KEYTRUDA for 17 cycles if they had received no new anticancer treatment since the last dose of KEYTRUDA. / 1. Gandhi L et al. N Engl J Med 2018;378:2078–2092 (and protocol); 2. Gandhi L et al. Presented at the 2018 American Association for Cancer Research (AACR) Annual Meeting, 14–18 April, 2018, Chicago, USA; 3. Gray JE et al. Presented virtually at the 2020 World Conference on Lung Cancer (WCLC). 28–31 January 2021.
Visuals: Flow diagram (consort-style). Shapes and labels: (1) a dark charcoal #404040 rounded rectangle labelled R / 2:1 / (N=616) at the left-centre, connected by a short horizontal grey line from the teal eligibility box. (2) Two elbow arrows leave the R box: the upper one labelled n=410 goes up and right to a green #2FA301 box 'KEYTRUDA 200 mg + pemetrexed 500 mg/m² + carboplatin AUC 5 mg/ml/min OR cisplatin 75 mg/m² Q3W for 4 cycles'; the lower one labelled n=206 goes down and right to a grey #808285 box 'Placebo (normal saline) + pemetrexed 500 mg/m² + carboplatin AUC 5 mg/ml/min OR cisplatin 75 mg/m² Q3W for 4 cycles'. (3) Straight grey arrows link each arm's first box to its second box: green box to green box 'KEYTRUDA 200 mg Q3W (up to 31 cycles) + pemetrexed 500 mg/m² Q3W'; grey box to grey box 'Placebo (up to 31 cycles) + pemetrexed 500 mg/m² Q3W'. (4) The green arm's second box has an arrow to a green box 'KEYTRUDA 200 mg Q3W (17 cycles)' titled 'Second-course KEYTRUDAg' above it. (5) The grey arm's second box has an arrow labelled PDf to a green box 'KEYTRUDA 200 mg Q3W (17 cycles)' titled 'Crossover KEYTRUDA'. (6) A grey dashed arrow leaves the right side of the crossover box, runs right and up, and ends at the right side of the second-course box. No photographs, logos other than the KEYTRUDA wordmark and the three header icons, or charts are present.
Slide 11
KEYNOTE-189: Statistical considerations (original analysis)1
ESMO
RECOMMENDATIONS
STUDY
OVERVIEW
CLINICAL
OUTCOMES
SUMMARY OF
OUTCOMES
POOLED ANALYSIS
PD-L1 EXPRESSION
DATA
DIVE
DOSING
Planned enrolment: 570 patients
Actual enrolment: 616 patients
Overall alpha for the study: strictly controlled at one-sided α=0.025
The study had 90% power to show an HR of 0.70 for PFS at one-sided α=0.0095 (based on
468 events) and an HR of 0.70 for OS at one-sided α=0.0155 (based on 416 deaths) for the comparison
between the KEYTRUDA combination and placebo combination groups
The protocol specified two interim analyses before the final analysis
First interim analysis (reviewed by an external, independent data monitoring committee)
Planned to occur after enrolment was complete and ~370 PFS events had been observeda
Analysis cut-off date: 8 November 2017
Results published: 16 April 2018
Median follow-up: 10.5 months (range: 0.2–20.4 months)
Observed number of events: 410 for PFS; 235 for OS
One-sided α levels:b 0.00559 for PFS; 0.00128 for OS
11
a It was anticipated that there would be ~242 OS events at that time. Multiplicity adjusted based on the observed number of events using the
O’Brien-Fleming spending function.2
1. Gandhi L et al. N Engl J Med 2018;378:2078–2092; 2. Gandhi L et al. Presented at the 2018 American Association for Cancer Research (AACR) Annual
Meeting, 14–18 April, 2018, Chicago, USA.
Visuals: One line-art illustration in the lower right (about x 74–95%, y 65–94%): a bearded man in a headband with one hand raised to his head, seated behind a dashboard or console with a steering wheel and four round gauges or dials, drawn in black outlines with no colour fill, on a light green ground with no frame. Its box coincides with two solid #000000 filled rectangles (x 75.3, y 65.6, w 18.4, h 26.8 and x 75.5, y 90.2, w 18.6, h 3.1) which are not visibly apparent in the rendered slide. No charts, tables or photographs. A stylised KEYTRUDA (pembrolizumab) logo sits top left and two green circular buttons with white labels sit at top right.
Slide 12
KEYNOTE-189: Statistical considerations (updated analyses) / Updated analysis1 / Analysis cut-off date: 21 September 2018 / Results presented: ASCO 2019 / Median follow-up (study):a 23.1 months (range: 18.6–30.9 months) / Median follow-up (survival):b 18.7 months (range: 0.2–30.9 months) / This analysis was not subjected to further significance testing / 5-year efficacy and safety outcomes update2 / Analysis cut-off date: 8 March 2022 / Results presented: ESMO 2022 / Median follow-up: 64.6 months (range: 60.1–72.4 months) / This analysis was not subject to further significance testing / 12 / a Time from randomisation to death or database cut off, whichever occurred first. b Time from randomisation to database cut-off. / 1. Gadgeel S et al. J Clin Oncol 2020;38(14):1505–1517; 2. Garassino MC, et al. J Clin Oncol 2023;41(11):1992-1998. / ESMO RECOMMENDATIONS / STUDY OVERVIEW / CLINICAL OUTCOMES / SUMMARY OF OUTCOMES / POOLED ANALYSIS / PD-L1 EXPRESSION / DATA DIVE / DOSING / KEYTRUDA (pembrolizumab)
Visuals: One illustration: a monochrome black line-art drawing of a mountain range, lower right (x about 68 to 96%, y about 74 to 93%). It shows three peaks with hatched shading on their slopes, small outlined clouds above (two above the left and central peaks, one at the upper right), dense scribbled shrub or forest undergrowth along the base, and horizontal wavy water lines at the bottom edge. Drawn in thin black ink on the pale green background, unboxed, not cropped, no tint or overlay. A logo (KEYTRUDA (pembrolizumab) wordmark, top left) and three circular icons in the header: a light green circle containing a white stylised Y-shaped symbol, and two darker green circles labelled DATA DIVE and DOSING. No charts or tables. A measured black-filled rectangle sits at about x 70.9, y 77.8, w 23.7, h 11.1 behind the illustration region.
Slide 13
KEYNOTE-189: Disposition of study treatment1
Median follow-up: 10.5 months
ESMO RECOMMENDATIONS
STUDY OVERVIEW
CLINICALOUTCOMES
SUMMARY OFOUTCOMES
POOLED ANALYSIS
PD-L1 EXPRESSION
DATA DIVE
DOSING
616 patients randomly allocated
KEYTRUDA + platinum + pemetrexed
410 allocated (ITT population)
405 treated (as-treated population)a
137 (33.8%) ongoing
268 (66.2%) discontinued
150 (37.0%) radiographic PD
78 (19.3%) AEs
16 (4.0%) withdrawal of consent
11 (2.7%) clinical PD
9 (2.2%) physician decision
4 (1.0%) new anti-cancer treatment
≥1 subsequent therapy
30.5% of ITT (45.8% excluding those still on therapy)d
Placebo + platinum + pemetrexed
206 allocated (ITT population)
202 treated (as-treated population)b
36 (17.8%) ongoing
Crossoverc
67 in-study KEYTRUDA
+
18 off-study anti-PD-1/PD-L1
=
Effective crossover (ITT): 41.3%
(50.0% excluding those still on therapy)
166 (82.2%) discontinued
119 (58.9%) radiographic PDa
21 (10.4%) AEs
8 (4.0%) withdrawal of consent
13 (6.4%) clinical PD
3 (1.5%) physician decision
2 (1.0%) new anti-cancer treatment
Adapted from Gandhi L et al. N Engl J Med 2018 (and supplementary appendix).
13
Data cut-off date: 8 November 2017.
a Two AEs, one clinical PD, one death and one protocol violation. b Two withdrawals of consent, one protocol violation and one physician decision. c An additional 13 patients received other subsequent therapy (6.3% of ITT [7.6% excluding those still on therapy])2. d 45.8%=125/273, where 273 is derived from the ITT population (410) minus the number of patients with ongoing treatment (137), and 125 is derived from subsequent treatment in 30.5% of the ITT population (410).2
1. Gandhi L et al. N Engl J Med 2018;378:2078–2092 (and supplementary appendix); 2. Gandhi L et al. Presented at the 2018 American Association for Cancer Research (AACR) Annual Meeting, 14–18 April, 2018, Chicago, USA.
1
Visuals: Flow diagram, no chart. Top: teal rounded box '616 patients randomly allocated' with a grey (#808285) horizontal bar connector splitting into three down-pointing arrowheads. Left column: green box 'KEYTRUDA + platinum + pemetrexed' with two bullets, a short down arrow to a larger green box listing 137 ongoing and 268 discontinued with four dash sub-items. Centre column: green box '≥1 subsequent therapy' with one bullet; a diagonal grey arrow runs from the lower-left green box up to this box; below it an outlined box 'Crossover' with a centred text stack. Right column: grey box 'Placebo + platinum + pemetrexed' with two bullets, a short down arrow to a grey pill '36 (17.8%) ongoing', then a white outlined box with a bullet and five dash sub-items; a grey horizontal arrow points left from this box into the Crossover box. Logo: KEYTRUDA wordmark in green with a navy Y and '(pembrolizumab)' beneath. Icons: green circle with a white stylised Y; green circle 'DATA DIVE'; green circle 'DOSING'. Green outlined circle with bold green '1' bottom right.
Slide 14
KEYNOTE-189: Key baseline characteristics1 / Median follow-up: 10.5 months / Characteristic, n (%)a / Pembro–plat–pem (n=410) / Placebo–plat–pem (n=206) / Age, median (range), years / 65.0 (34.0–84.0) / 63.5 (34.0–84.0) / <65 years / 197 (48.0) / 115 (55.8) / Male sexb / 254 (62.0) / 109 (52.9) / ECOG PSc / 0 / 186 (45.4) / 80 (38.8) / 1 / 221 (53.9) / 125 (60.7) / 2 / 1 (0.2) / 0 / Brain metastases / 73 (17.8) / 35 (17.0) / Smoking status / Former/current / 362 (88.3) / 181 (87.9) / Never / 48 (11.7) / 25 (12.1) / Characteristic, n (%)a / Pembro–plat–pem (n=410) / Placebo–plat–pem (n=206) / PD-L1 TPSd / <1% / 127 (31.0) / 63 (30.6) / ≥1% / 260 (63.4) / 128 (62.1) / 1–49% / 128 (31.2) / 58 (28.2) / ≥50% / 132 (32.2) / 70 (34.0) / NEe / 23 (5.6) / 15 (7.3) / Prior thoracic radiotherapy / 28 (6.8) / 20 (9.7) / Prior neoadjuvant therapy / 5 (1.2) / 6 (2.9) / Prior adjuvant therapy / 25 (6.1) / 14 (6.8) / Adapted from Gandhi L et al. N Engl J Med 2018. / 14 / Data cut-off date: 8 November 2017. / a Unless otherwise stated. b There was a significant between-group difference in the proportion of men (p=0.04). c Data regarding ECOG PS status were missing for two patients (0.5%) in the KEYTRUDA + platinum + pemetrexed group, and in one patient (0.5%) in the placebo + platinum + pemetrexed arm. / d PD-L1 TPS was defined as the percentage of tumour cells with membranous PD-L1 expression. / e PD-L1 expression could not be evaluated because specimens had an inadequate number of tumour cells or no tumour cells. For stratification purposes, patients with PD-L1 expression that could not be evaluated were included in the subgroup with PD-L1 TPS <1%; these patients were excluded from analyses of efficacy according to PD-L1 TPS. / 1. Gandhi L et al. N Engl J Med 2018;378:2078–2092. / 1 / ESMO RECOMMENDATIONS / STUDY OVERVIEW / CLINICAL OUTCOMES / SUMMARY OF OUTCOMES / POOLED ANALYSIS / PD-L1 EXPRESSION / DATA DIVE / DOSING
Visuals: Two tables and one logo. Table 1 has 3 columns: Characteristic, n (%)a; Pembro–plat–pem (n=410) on green #2FA301 header; Placebo–plat–pem (n=206) on grey #808285 header. Rows: Age, median (range), years | 65.0 (34.0–84.0) | 63.5 (34.0–84.0); <65 years | 197 (48.0) | 115 (55.8); Male sexb | 254 (62.0) | 109 (52.9); ECOG PSc (no values, sub-rows indented); 0 | 186 (45.4) | 80 (38.8); 1 | 221 (53.9) | 125 (60.7); 2 | 1 (0.2) | 0; Brain metastases | 73 (17.8) | 35 (17.0); Smoking status (dark grey #585858 full-width bar, white bold text, no values); Former/current | 362 (88.3) | 181 (87.9); Never | 48 (11.7) | 25 (12.1). Table 2 has the same column headers and rows: PD-L1 TPSd (no values); <1% | 127 (31.0) | 63 (30.6); ≥1% | 260 (63.4) | 128 (62.1); 1–49% | 128 (31.2) | 58 (28.2); ≥50% | 132 (32.2) | 70 (34.0); NEe | 23 (5.6) | 15 (7.3); Prior thoracic radiotherapy | 28 (6.8) | 20 (9.7); Prior neoadjuvant therapy | 5 (1.2) | 6 (2.9); Prior adjuvant therapy | 25 (6.1) | 14 (6.8). Rows alternate white and light grey #F2F2F2 with thin green #2FA301 horizontal rules between rows. The KEYTRUDA (pembrolizumab) logo is top left: the wordmark in bright green with a navy Y-shaped letter and the word (pembrolizumab) beneath. Three icons at top right: a light green circle with a white Y glyph, a green circle reading DATA DIVE, and a green circle reading DOSING. Nav buttons are plain rectangles with no icons. No photographs or charts.
Slide 15
KEYTRUDA (pembrolizumab)
ESMO RECOMMENDATIONS
STUDY OVERVIEW
CLINICAL OUTCOMES
SUMMARY OF OUTCOMES
POOLED ANALYSIS
PD-L1 EXPRESSION
DATA DIVE
DOSING
KEYNOTE-189: Baseline characteristics – Frequency of PD-L1 TPS subgroups1
Median follow-up: 10.5 months
100
90
80
70
60
Frequency, %
50
40
30
20
10
0
32.2
34.0
31.2
28.2
31.0
30.6
5.6
7.3
(n=132)
(n=70)
(n=128)
(n=58)
(n=127)
(n=63)
(n=23)
(n=15)
Pembro–plat–pem (n=410)
Placebo–plat–pem (n=206)
PD-L1 TPS ≥50%
PD-L1 TPS 1%–49%
PD-L1 TPS <1%
NEa
Adapted from Gandhi L et al. N Engl J Med 2018.
15
Data cut-off date: 8 November 2017.
aNE refers to specimens with an inadequate number of tumour cells or no tumour cells seen; these patients were included in the PD-L1 TPS <1% group for randomisation stratification but excluded from the analysis of efficacy by TPS.
1. Gandhi L et al. N Engl J Med 2018;378:2078–2092.
1
Visuals: Chart: grouped vertical column chart titled by slide headline, with y-axis labelled 'Frequency, %' running 0 to 100 in steps of 10 (labels 0,10,20,30,40,50,60,70,80,90,100), no gridlines, dark grey axis lines. X-axis has four categories: 'PD-L1 TPS ≥50%', 'PD-L1 TPS 1%–49%', 'PD-L1 TPS <1%', 'NEa'. Two series per category. Series 1 'Pembro–plat–pem (n=410)' in green #2FA301; Series 2 'Placebo–plat–pem (n=206)' in dark grey #585858. Labelled values (green/grey): ≥50%: 32.2 / 34.0; 1%–49%: 31.2 / 28.2; <1%: 31.0 / 30.6; NE: 5.6 / 7.3. Sample sizes printed white inside the bar bases: ≥50% (n=132) / (n=70); 1%–49% (n=128) / (n=58); <1% (n=127) / (n=63); NE (n=23) / (n=15). Legend at upper right: green square 'Pembro–plat–pem (n=410)' above grey square 'Placebo–plat–pem (n=206)'. No highlighted points. Bars are approximately: green ≥50% x 12.5 y 63.2 w 7.0 h 16.7; grey ≥50% x 19.5 y 62.2 w 7.1 h 17.7; green 1%–49% x 33.7 y 63.7 w 7.0 h 16.2; grey 1%–49% x 40.8 y 65.2 w 7.0 h 14.7; green <1% x 54.9 y 63.8 w 7.0 h 16.1; grey <1% x 62.0 y 64.0 w 7.0 h 15.9; green NE x 76.1 y 77.1 w 7.0 h 2.8; grey NE x 83.2 y 76.2 w 7.0 h 3.7 (all in % of slide).
Slide 16
KEYNOTE-189: Primary endpoint outcomes
a
ESMO RECOMMENDATIONS
STUDY OVERVIEW
CLINICAL OUTCOMES
SUMMARY OF OUTCOMES
POOLED ANALYSIS
PD-L1 EXPRESSION
DATA DIVE
DOSING
Primary outcomes with KEYTRUDA + platinum + pemetrexed in the ITT population were as follows:
Original analysis
(median follow-up: 10.5 months)1
● OS: 51% reduced risk of death vs. placebo +
platinum + pemetrexed
● HR: 0.49; 95% CI: 0.38–0.64; p<0.001
● PFS: 48% reduced risk of progression or death
vs. placebo + platinum + pemetrexed
● HR: 0.52; 95% CI: 0.43–0.64; p<0.001
Updated analysis
(median follow-up: 23.1 months)2
● OS: 44% reduced risk of death vs. placebo +
platinum + pemetrexed
● HR: 0.56; 95% CI: 0.45–0.70; p = not tested
● PFS: 52% reduced risk of progression or death
vs. placebo + platinum + pemetrexed
● HR: 0.48; 95% CI: 0.40–0.58; p = not tested
5-year update
(median follow-up: 64.6 months)3
● OS: 40% reduced risk of death vs. placebo +
platinum + pemetrexed
● HR: 0.60; 95% CI: 0.50–0.72; p = not tested
● PFS: 50% reduced risk of progression vs.
placebo + platinum + pemetrexed
● HR: 0.50; 95% CI: 0.42–0.60; p = not tested
16
aOS and PFS were both primary endpoints.
1. Gandhi L et al. N Engl J Med 2018;378:2078–2092; 2. Gadgeel S et al. J Clin Oncol 2020;38(14):1505–1517; 3. Garassino MC, et al. J Clin Oncol 2023;41(11):1992-1998.
1
2
3
Visuals: Logo: KEYTRUDA wordmark in green #48A548 with a stylised Y-shaped mark over the E, and '(pembrolizumab)' in grey beneath it. Navigation: six light-grey rounded rectangles labelled ESMO RECOMMENDATIONS, STUDY OVERVIEW, CLINICAL OUTCOMES, SUMMARY OF OUTCOMES, POOLED ANALYSIS, PD-L1 EXPRESSION. Icons: three green circles at top right, the first a light-green circle (#6CBE45) with a white Y-shaped icon, the second a green circle (#4BA84B) labelled DATA DIVE, the third a green circle (#4BA84B) labelled DOSING. Footer: three green outline circles (#2FA301) containing 1, 2 and 3. No photographs or charts.
Slide 17
KEYNOTE-189: 1-year landmark OS in the ITT population (original analysis)1,2,a,b
Median follow-up: 10.5 months
KEYTRUDA (pembrolizumab)
ESMO RECOMMENDATIONS
STUDY OVERVIEW
CLINICAL OUTCOMES
SUMMARY OF OUTCOMES
POOLED ANALYSIS
PD-L1 EXPRESSION
DATA DIVE
DOSING
Treatment arm
Events, %
Median, months (95% CI)
HR (95% CI)
p value
Pembro–plat–pem
31.0
NR (NE–NE)
0.49 (0.38–0.64)
<0.001
Placebo–plat–pem
52.4
11.3 (8.7–15.1)
—
—
OS, %
100
90
80
70
60
50
40
30
20
10
0
12-month OS: 69.2%
12-month OS: 49.4%
0
3
6
9
12
15
18
21
Time, months
No. at risk
Pembro–plat–pem
410
377
347
278
163
71
18
0
Placebo–plat–pem
206
183
149
104
59
25
8
0
Adapted from Gandhi L et al. N Engl J Med 2018; Gandhi L et al. AACR 2018.
17
Data cut-off date: 8 November 2017.
aOS and PFS were both primary endpoints. bKaplan-Meier estimate.
1. Gandhi L et al. N Engl J Med 2018;378:2078–2092; 2. Gandhi L et al. Presented at the 2018 American Association for Cancer Research (AACR) Annual Meeting, 14–18 April, 2018, Chicago, USA.
1
Visuals: One Kaplan-Meier survival chart (image of 1536 by 767 pixels, showing the table above it, the chart and the no-at-risk table below). Chart type: Kaplan-Meier step curves. X-axis titled Time, months, range 0 to 21, ticks every 3 months. Y-axis titled OS, %, range 0 to 100, ticks every 10. Series 1: Pembro–plat–pem, bright green line (about #3AA000), with censoring tick marks; printed value 12-month OS 69.2%; curve about 100 at 0 months, about 80 at 8.5 months, about 70 at 12 months, about 62 from 15 months to about 20.5 months. Series 2: Placebo–plat–pem, mid grey line (about #707070), censoring ticks; printed value 12-month OS 49.4%; curve about 100 at 0 months, about 72 at 6 months, about 50 at 10 months, about 42 from 15 months to about 20 months. Highlighted points: two callout boxes, a green box (#3AA000) reading 12-month OS: 69.2% above the curve, and a dark grey box (#707070) reading 12-month OS: 49.4% below the curve, both with white bold text; a thin dashed grey vertical line at 12 months joins them to the curves. Legend: none as a separate box; series identified by green and grey table labels. Table above chart: columns Treatment arm, Events %, Median, months (95% CI), HR (95% CI), p value; rows Pembro–plat–pem | 31.0 | NR (NE–NE) | 0.49 (0.38–0.64) | <0.001 (green text); Placebo–plat–pem | 52.4 | 11.3 (8.7–15.1) | — | — (grey text). No-at-risk table below x-axis: Pembro–plat–pem (green) 410, 377, 347, 278, 163, 71, 18, 0 at 0, 3, 6, 9, 12, 15, 18, 21 months; Placebo–plat–pem (grey) 206, 183, 149, 104, 59, 25, 8, 0. Corner logo: KEYTRUDA (pembrolizumab) wordmark, green with dark navy Y, top left. Icons: three circles at top right, a light green circle with white Y-shaped mark, a green circle labelled DATA DIVE, and a green circle labelled DOSING. Page number element: green outlined circle with the number 1 in green.
Slide 18
KEYNOTE-189: Exploratory analysis – OS in the ITT population / (5-year update)1,a–c / Median follow-up: 64.6 months. No statistical conclusions can be drawn from this analysis / KEYTRUDA® / (pembrolizumab) / ESMO / RECOMMENDATIONS / STUDY / OVERVIEW / CLINICAL / OUTCOMES / SUMMARY OF / OUTCOMES / POOLED ANALYSIS / PD-L1 EXPRESSION / DATA / DIVE / DOSING / Events, n (%) / Median, months / (95% CI) / HR (95% CI) / Pembro–plat–pem / 329 (80.2) / 22.0 (19.5–24.5) / 0.60 / (0.50–0.72) / p = not tested / Placebo–plat–pem / 183 (88.8) / 10.6 (8.7–13.6) / 69.8% / 48.0% / 45.7% / 27.3% / 31.3% / 17.4% / 23.6% / 13.8% / 5-y OS / 19.4% / 11.3% / 100 / 90 / 80 / 70 / 60 / 50 / 40 / 30 / 20 / 10 / 0 / OS (%) / 0 / 12 / 24 / 36 / 48 / 60 / 72 / Time (months) / No. at risk / Pembro–plat–pem 410 283 184 126 95 77 0 / Placebo–plat–pem 206 98 55 34 27 22 0 / Adapted from Garassino MC et al. J Clin Oncol 2023. / 18 / Data cut-off date: 8 March 2022. / aOS and PFS were both primary endpoints. bKaplan-Meier estimate. cStatistical significance was met for the primary endpoints in IA1 (2018). / 1. Garassino MC, et al. J Clin Oncol. 2023;41(11):1992-1998. / 3
Visuals: Chart: Kaplan-Meier overall survival curve, line chart. Y-axis titled OS (%), range 0 to 100 with ticks every 10. X-axis titled Time (months), range 0 to 72 with ticks every 12. Two step-line series with small vertical censoring tick marks: Pembro–plat–pem in green #2FA301 and Placebo–plat–pem in grey about #8C8C8C. Dotted black vertical reference lines at 12, 24, 36, 48 and 60 months and a dotted horizontal line at 50 percent. Labelled values in the plot: at 12 months green 69.8% and grey 48.0%; at 24 months green 45.7% and grey 27.3%; at 36 months green 31.3% and grey 17.4%; at 48 months green 23.6% and grey 13.8%. A rounded callout box at about 71 to 78 percent x and 55 to 64 percent y, white fill with green outline about 2 px, reads 5-y OS in black, 19.4% in green and 11.3% in grey. Number-at-risk table below the x-axis: Pembro–plat–pem 410, 283, 184, 126, 95, 77, 0 at 0, 12, 24, 36, 48, 60, 72 months; Placebo–plat–pem 206, 98, 55, 34, 27, 22, 0. Green curve ends near 18 percent and grey near 9 to 10 percent after 70 months, with dense censoring ticks between 60 and 70 months. Table: columns blank label, Events n (%), Median months (95% CI), HR (95% CI). Rows: Pembro–plat–pem, 329 (80.2), 22.0 (19.5–24.5), 0.60 (0.50–0.72) and p = not tested; Placebo–plat–pem, 183 (88.8), 10.6 (8.7–13.6), merged HR cell shared with the first row. Logo: KEYTRUDA wordmark in green with a navy Y letterform and (pembrolizumab) below in grey. Icons: a white Y glyph in a lighter green circle, plus text-only green circles labelled DATA DIVE and DOSING.
Slide 19
KEYNOTE-189: Exploratory endpoint – 1-year landmark OS by PD-L1 TPS (original analysis)1,2,a
Median follow-up: 10.5 months. No statistical conclusions can be drawn from exploratory endpoints
KEYTRUDA® (pembrolizumab)
ESMO RECOMMENDATIONS
STUDY OVERVIEW
CLINICAL OUTCOMES
SUMMARY OF OUTCOMES
POOLED ANALYSIS
PD-L1 EXPRESSION
DATA DIVE
DOSING
PD-L1 TPS ≥50%
Treatment arm Events, % Median, months (95% CI) HR (95% CI) p valueb
Pembro–plat–pem 25.8 NR (NE–NE) 0.42 (0.26–0.68) 0.0001
Placebo–plat–pem 51.4 10.0 (7.5–NE) — —
OS, %
Time, months
12-month OS: 73.0%
12-month OS: 48.1%
No. at risk
Pembro–plat–pem 132 122 114 96 56 25 6 0
Placebo–plat–pem 70 64 50 35 19 13 4 0
PD-L1 TPS 1–49%
Events, % Median, months (95% CI) HR (95% CI) p value b
Pembro–plat–pem 28.9 NR (NE–NE) 0.55 (0.34–0.90) 0.0081
Placebo–plat–pem 48.3 12.9 (8.7–NE) — —
OS, %
Time, months
12-month OS: 71.5%
12-month OS: 50.9%
Pembro–plat–pem 128 119 108 84 52 21 5 0
Placebo–plat–pem 58 54 47 32 17 5 2 0
PD-L1 TPS <1%
Events, % Median, months (95% CI) HR (95% CI) p valueb
Pembro–plat–pem 38.6 15.2 (12.3–NE) 0.59 (0.38–0.92) 0.0095
Placebo–plat–pem 55.6 12.0 (7.0–NE) — —
OS, %
Time, months
12-month OS: 61.7%
12-month OS: 52.2%
Pembro–plat–pem 127 113 104 79 42 20 6 0
Placebo–plat–pem 63 54 45 32 21 6 1 0
Adapted from Gandhi L et al. N Engl J Med 2018; Gandhi L et al. AACR 2018.
19
Data cut-off date: 8 November 2017.
aKaplan-Meier estimate. bNominal and one-sided.
1. Gandhi L et al. N Engl J Med 2018;378:2078–2092; 2. Gandhi L et al. Presented at the 2018 American Association for Cancer Research (AACR) Annual Meeting, 14–18 April, 2018, Chicago, USA.
1
Visuals: Three Kaplan-Meier survival charts side by side, each with a results table above it. Each chart: y-axis 'OS, %' from 0 to 100 in steps of 10; x-axis 'Time, months' from 0 to 21 in steps of 3; dashed vertical reference line at 12 months; two step curves: green = Pembro–plat–pem, grey = Placebo–plat–pem with tick marks for censored patients. Left panel (PD-L1 TPS ≥50%): labelled 12-month OS green 73.0% (curve about 73 at 12 months) and grey 48.1%; highlighted by green and dark grey callout boxes on the dashed line. Middle panel (PD-L1 TPS 1–49%): green 71.5%, grey 50.9%. Right panel (PD-L1 TPS <1%): green 61.7%, grey 52.2%. Results tables: PD-L1 TPS ≥50%: Pembro 25.8 events %, median NR (NE–NE), HR 0.42 (0.26–0.68), p 0.0001; Placebo 51.4, 10.0 (7.5–NE). PD-L1 TPS 1–49%: Pembro 28.9, NR (NE–NE), 0.55 (0.34–0.90), 0.0081; Placebo 48.3, 12.9 (8.7–NE). PD-L1 TPS <1%: Pembro 38.6, 15.2 (12.3–NE), 0.59 (0.38–0.92), 0.0095; Placebo 55.6, 12.0 (7.0–NE). Number at risk rows (Pembro / Placebo) at 0,3,6,9,12,15,18,21 months: left 132 122 114 96 56 25 6 0 / 70 64 50 35 19 13 4 0; middle 128 119 108 84 52 21 5 0 / 58 54 47 32 17 5 2 0; right 127 113 104 79 42 20 6 0 / 63 54 45 32 21 6 1 0. Logos: KEYTRUDA wordmark with pembrolizumab sub-line at top left; green Y-shaped icon circle, DATA DIVE and DOSING circles at top right; green circled numeral 1 at bottom right.
Slide 20
KEYTRUDA (pembrolizumab)
ESMO RECOMMENDATIONS
STUDY OVERVIEW
CLINICAL OUTCOMES
SUMMARY OF OUTCOMES
POOLED ANALYSIS
PD-L1 EXPRESSION
DATA DIVE
DOSING
KEYNOTE-189: Exploratory analysis – OS by PD-L1 TPS (5-year update)1,a
Median follow-up: 64.6 months. No statistical conclusions can be drawn from this analysis
PD-L1 TPS ≥50%
Treatment group Events, n (%) HR (95% CI) 5-year OS rate, %
Pembro–plat–pem 92 (69.7) 0.68 (0.49–0.96) 29.6 (22.0–37.6)
Placebo–plat–pem 56 (80.0) 21.4 (12.7–31.6)
Median (95% CI) 27.7 months (20.4–38.2) 10.1 months (7.5–22.0)
PD-L1 TPS 1–49%
Treatment group Events, n (%) HR (95% CI) 5-year OS rate, %
Pembro–plat–pem 104 (81.3) 0.65 (0.46–0.90) 19.8 (13.4–27.1)
Placebo–plat–pem 54 (93.1) 7.7 (2.5–16.6)
Median (95% CI) 21.8 months (17.7–25.6) 12.1 months (8.7–19.4)
PD-L1 TPS <1%
Treatment group Events, n (%) HR (95% CI) 5-year OS rate, %
Pembro–plat–pem 113 (89.0) 0.55 (0.39–0.76) 9.6 (5.3–15.6)
Placebo–plat–pem 58 (92.1) 5.3 (1.4–13.2)
Median (95% CI) 17.2 months (13.8–22.8) 10.2 months (7.0–13.5)
OS (%) Time (months) (chart axis labels 0 to 100 and 0 to 72, with 12-month ticks; percentage labels 73.3 48.6 52.2 37.1 43.7 30.0 34.3 27.1 29.6 21.4 / 71.1 50.0 44.3 31.0 28.5 17.2 22.1 9.6 19.8 7.7 / 63.4 47.5 39.3 14.2 23.3 5.3 16.0 5.3 9.6 5.3)
Pembro–plat–pem 132 95 67 56 44 37 0 128 91 56 36 28 25 0 127 79 49 29 20 12 0
Placebo–plat–pem 70 34 26 21 19 15 0 58 29 18 9 5 4 0 63 29 8 3 3 3 0
Adapted from Garassino MC et al. J Clin Oncol 2023.
20
Data cut-off date: 8 March 2022.
a Kaplan-Meier estimate.
1. Garassino MC, et al. J Clin Oncol. 2023;41(11):1992-1998.
3
Visuals: Chart: three Kaplan-Meier overall survival plots drawn as a single raster image, one per PD-L1 group. Left panel PD-L1 TPS ≥50%; middle panel PD-L1 TPS 1–49%; right panel PD-L1 TPS <1%. Each plot: y-axis 'OS (%)' 0 to 100 in steps of 10; x-axis 'Time (months)' 0 to 72 in steps of 12; dotted horizontal reference at 50% and dotted vertical lines at 12, 24, 36, 48 and 60 months. Series: green line = Pembro–plat–pem (#2FA301), grey line = Placebo–plat–pem (#8C8C8C); step curves with tick marks for censored patients. Labelled values, green/grey: left panel at 12 months 73.3/48.6, 24 months 52.2/37.1, 36 months 43.7/30.0, 48 months 34.3/27.1, 60 months 29.6/21.4 (values at 60 and 72 months of about 30 and 21 are printed as labels); middle panel 71.1/50.0, 44.3/31.0, 28.5/17.2, 22.1/9.6, 19.8/7.7; right panel 63.4/47.5, 39.3/14.2, 23.3/5.3, 16.0/5.3, 9.6/5.3. No separate legend; colour is identified by the row labels in the tables below. Highlighted points: none beyond the printed labels. Tables above the plots: three column tables with columns Treatment group, Events n (%), HR (95% CI), 5-year OS rate % (95% CI); rows Pembro–plat–pem and Placebo–plat–pem; Pembro values green, placebo values grey. Number-at-risk table below the plots: two rows (Pembro–plat–pem in green, Placebo–plat–pem in grey) with values at 0, 12, 24, 36, 48, 60 and 72 months for each plot. Logo: KEYTRUDA wordmark in green with a registered mark, a dark stylised Y in the O position, and '(pembrolizumab)' beneath in grey. Icons: a green circle with a white stylised Y-shaped mark, a green circle labelled DATA DIVE, and a darker green circle labelled DOSING; a green circled number 3 at bottom right.
Slide 21
KEYTRUDA
(pembrolizumab)
ESMO RECOMMENDATIONS
STUDY OVERVIEW
CLINICAL OUTCOMES
SUMMARY OF OUTCOMES
POOLED ANALYSIS
PD-L1 EXPRESSION
DATA DIVE
DOSING
KEYNOTE-189: Exploratory endpoint – OS in key subgroups (original analysis)1
Median follow-up: 10.5 months. No statistical conclusions can be drawn from exploratory endpoints
No. of events/ No. of patients
Subgroup
Overall
Age
<65 years
≥65 years
Sex
Male
Female
ECOG PS
0
1
Smoking status
Current/former
Never
0.1
0.5
1.0
Favours pembrolizumab–platinum–pemetrexed
Favours placebo–platinum–pemetrexed
HR for death (95% CI)
No. of events/ No. of patients
Subgroup
Overall
Baseline brain metastases
Yes
No
PD-L1 TPS
<1%
≥1%
1–49%
≥50%
Platinum
Carboplatin
Cisplatin
0.1
0.5
1.0
Favours pembrolizumab–platinum–pemetrexed
Favours placebo–platinum–pemetrexed
HR for death (95% CI)
Adapted from Gandhi L et al. N Engl J Med 2018.
21
Data cut-off date: 8 November 2017.
1. Gandhi L et al. N Engl J Med 2018;378:2078–2092.
1
Visuals: Two forest plots (HR for death, 95% CI) side by side. Left plot: Subgroup / No. of events/No. of patients / HR (95% CI) rows: Overall 235/616 0.49 (0.38–0.64); Age: <65 years 133/312 0.43 (0.31–0.61), ≥65 years 102/304 0.64 (0.43–0.95); Sex: Male 143/363 0.70 (0.50–0.99), Female 92/253 0.29 (0.19–0.44); ECOG PS: 0 74/266 0.44 (0.28–0.71), 1 159/346 0.53 (0.39–0.73); Smoking status: Current/former 211/543 0.54 (0.41–0.71), Never 24/73 0.23 (0.10–0.54). Right plot: Overall 235/616 0.49 (0.38–0.64); Baseline brain metastases: Yes 51/108 0.36 (0.20–0.62), No 184/508 0.53 (0.39–0.71); PD-L1 TPS: <1% 84/190 0.59 (0.38–0.92), ≥1% 135/388 0.47 (0.34–0.66), 1–49% 65/186 0.55 (0.34–0.90), ≥50% 70/202 0.42 (0.26–0.68); Platinum: Carboplatin 176/445 0.52 (0.39–0.71), Cisplatin 59/171 0.41 (0.24–0.69). Each row has a green square marker (about 1.2% of slide width) at the point estimate with a dark grey horizontal line for the CI. Dashed vertical reference line at HR 0.5 (grey) and solid black vertical line at HR 1.0. X-axis: HR scale ticks labelled 0.1, 0.5, 1.0 (log-type spacing as printed, no unit), baseline dark grey. Beneath each axis a double-headed arrow: left arrow labelled Favours pembrolizumab–platinum–pemetrexed, right arrow labelled Favours placebo–platinum–pemetrexed, both dark grey #404040. Axis title HR for death (95% CI) in bold. No photographs, logos beyond the KEYTRUDA wordmark and nav icons, or icons other than the Y-shaped symbol inside the green circle at top right.
Slide 22
KEYNOTE-189: 1-year landmark PFS in the ITT population (original analysis)1,2,a–c / Median follow-up: 10.5 months / Treatment arm / Events, % / Median, months (95% CI) / HR (95% CI) / p value / Pembro–plat–pem 59.5 8.8 (7.6–9.2) 0.52 (0.43–0.64) <0.001 / Placebo–plat–pem 80.6 4.9 (4.7–5.5) — — / 12-month PFS: 34.1% / 12-month PFS: 17.3% / PFS, % / Time, months / No. at risk / Pembro–plat–pem 410 322 256 149 60 17 5 0 / Placebo–plat–pem 206 141 80 40 16 3 1 0 / Adapted from Gandhi L et al. N Engl J Med 2018; Gandhi L et al. AACR 2018. / 22 / Data cut-off date: 8 November 2017. / aOS and PFS were both primary endpoints. bKaplan-Meier estimate. cAssessed using RECIST v1.1 by blinded, independent, central radiological review. / 1. Gandhi L et al. N Engl J Med 2018;378:2078–2092; 2. Gandhi L et al. Presented at the 2018 American Association for Cancer Research (AACR) Annual Meeting, 14–18 April, 2018, Chicago, USA. / 1 / KEYTRUDA (pembrolizumab) logo / ESMO RECOMMENDATIONS / STUDY OVERVIEW / CLINICAL OUTCOMES / SUMMARY OF OUTCOMES / POOLED ANALYSIS / PD-L1 EXPRESSION / DATA DIVE / DOSING
Visuals: One Kaplan-Meier survival chart (embedded picture, 1536 by 906 pixels) with an overlaid summary table and an at-risk table. Chart title: none printed beyond the slide title. Y-axis: 'PFS, %', range 0 to 100, labelled every 10. X-axis: 'Time, months', range 0 to 21, labelled every 3. Series 1, Pembro–plat–pem (green line, about #2FA301): 12-month PFS 34.1%, median 8.8 months (95% CI 7.6–9.2), events 59.5%, HR 0.52 (0.43–0.64), p<0.001. Series 2, Placebo–plat–pem (grey line, about #6E6E6E): 12-month PFS 17.3%, median 4.9 months (95% CI 4.7–5.5), events 80.6%, HR and p value shown as dashes. Highlighted points: a dashed vertical grey line at 12 months with green callout label '12-month PFS: 34.1%' (white text on green box #2FA301) and grey callout label '12-month PFS: 17.3%' (white text on grey box #6E6E6E) at the curve ends near 12 months. Summary table columns: Treatment arm, Events %, Median months (95% CI), HR (95% CI), p value; rows as listed in text. At-risk table below the x-axis, rows Pembro–plat–pem (green) and Placebo–plat–pem (grey), with values at 0, 3, 6, 9, 12, 15, 18 and 21 months as listed in text. Legend: none beyond the row labels. No photographs.
Slides 23 to 89 continue in the full text file.
Download this deck
The hosted PDF of every library deck is free for readers of the SlideDeck Co newsletter. Join with your email and the viewer and download appear here.
Building a deck of your own? The SlideDeck Co Standard Deck is a slide library for business presentations: reviews, updates and plans.