The deck opens with a title slide reading 'Discover | Develop | Deliver: IGO's path to 2035', followed by a contents page that lists the sections. It moves through a market context section on the energy transition, EV adoption and battery raw materials, with separate slides on lithium, copper and nickel. A purpose and strategy section follows, covering the company's purpose, its strategy on a page, its 2035 portfolio, strategic themes, objectives over three time horizons and a capital allocation framework. The delivery section covers safety, sustainability, leadership, the TLEA joint venture, Greenbushes, Kwinana, the nickel business, exploration and commercial capability, with financial performance and dividend history after. It closes with a summary slide, a unique value proposition and a cautionary statement, and an appendix holds the board and the partnership, technical and playbook pillars. Several slides are worth studying: the market context slides use a single headline per slide with a chart that carries the argument, and the Greenbushes and Kwinana slides pair operating data with plain takeaways.
Slides worth studying
Questions about this deck
What does the IGO Limited strategy deck say about lithium demand to 2035?
Slide 11 states that lithium demand is expected to grow 3x by 2035, which will require new supply equivalent to ~80 new unfunded projects. The slide also notes that long-term fundamentals remain intact with demand expected to continue growing at a rapid, albeit disjointed, pace.
What battery raw materials market value pool figures does the IGO Limited deck give for lithium?
Slide 7 shows the battery raw materials market value pool for lithium at US$28bn p.a. in 2023A and US$98bn p.a. in 2035E. The slide's source is listed as Project Blue, SC Insights, LME, Bloomberg.
What shareholder return target does the IGO Limited deck set out in its capital allocation framework?
Slide 23 sets a target of returns between 20-40% of underlying FCF when liquidity is under $1.0 billion. It adds that the Board will consider higher returns when liquidity is above $1.0 billion.
How is the IGO Limited strategy deck structured?
Slide 3 is the contents page, listing Market Context (page 4), Purpose & Strategy (page 14), Delivering the Strategy (page 21), Summary (page 41) and Appendix (page 45). The sections move from market context through purpose and strategy to delivery, then close with a summary and appendix.
Details
- Company: IGO Limited
- Year: 2024
- Type: Strategy presentation
- Industry: Mining
- Pages: 55
Review score: 7 out of 10, Effective
Presentation quality, judged with the SlideDeck Co review heuristic. Ask, evidence and idea merit are not rated here.
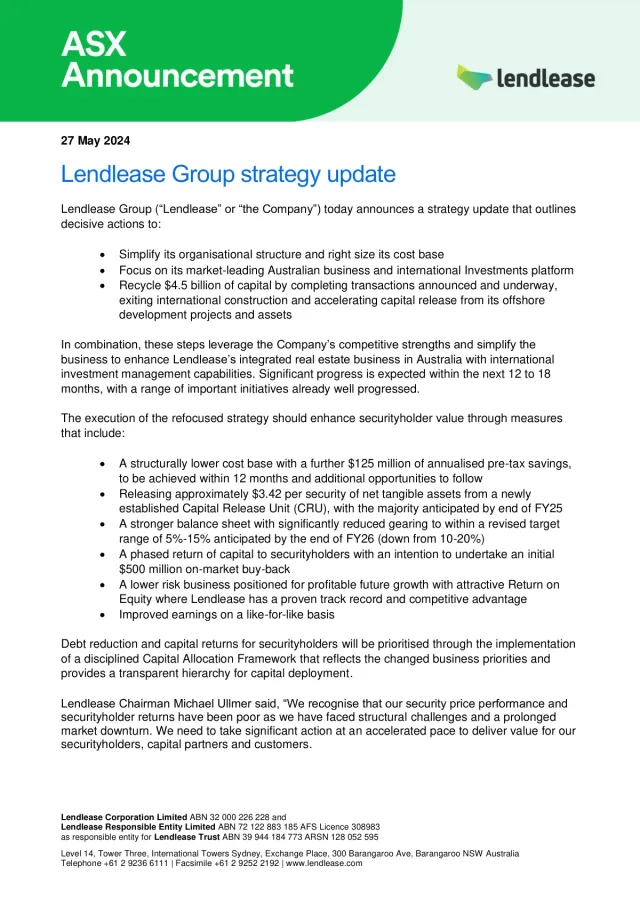
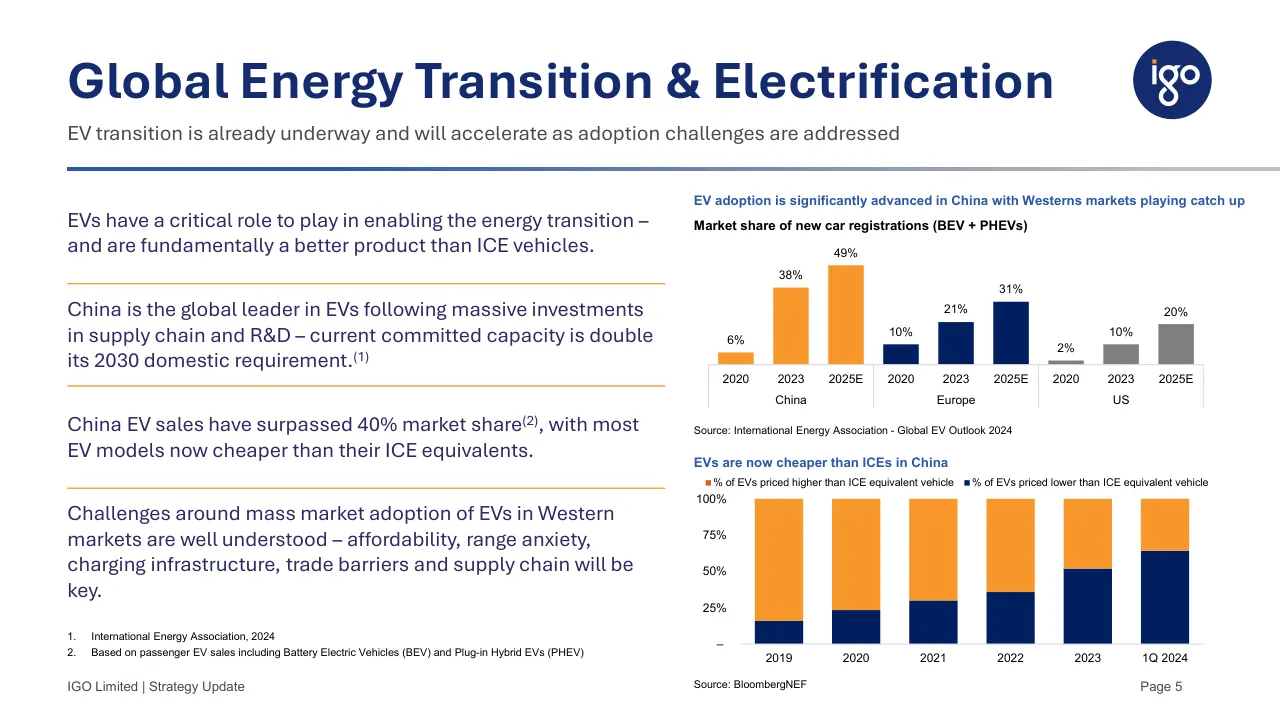
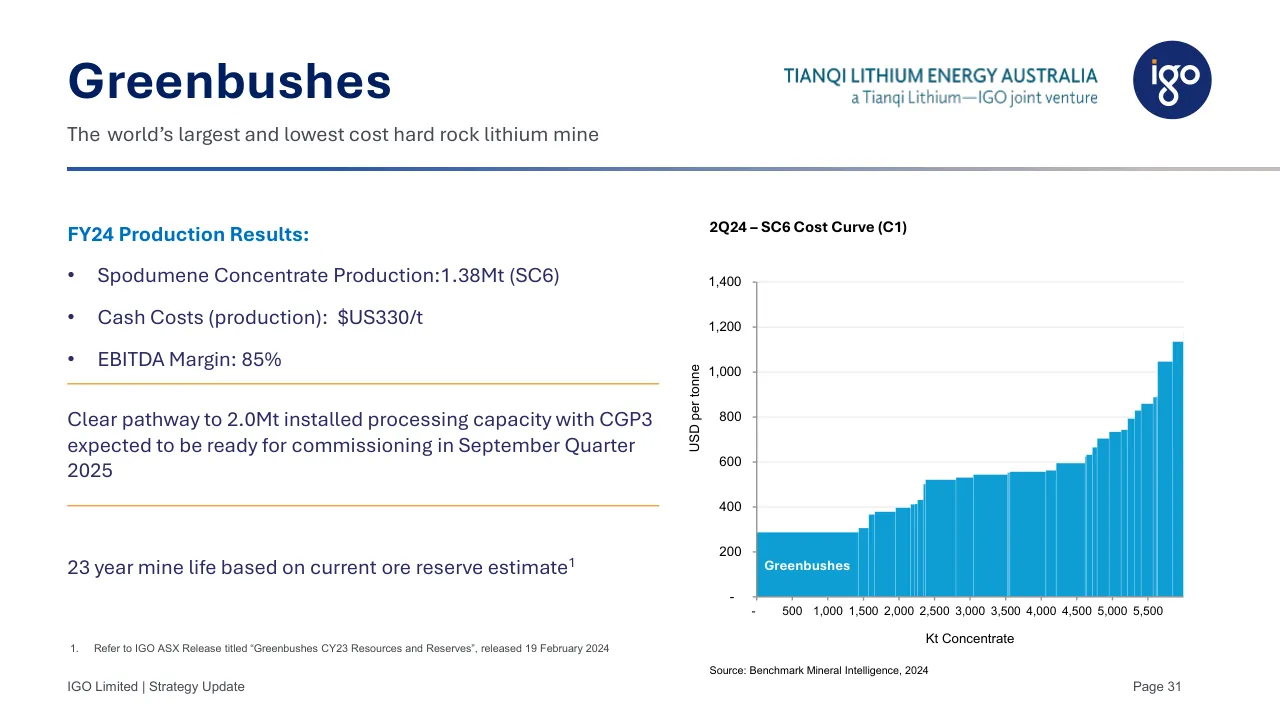
The deck has a clear route (market context, purpose and strategy, delivery, summary, appendix), a consistent template and well-built chart slides: slide 6 pairs four plain statements with two readable charts, and slide 32 shows Greenbushes at the bottom of a cost curve. Weaknesses are consequential: slide 1 is a plain-text ASX release page that opens the file, slides 7 to 14 and 19 to 24 rely on long titles or dense small text, and the 2035 argument on slides 19 to 24 is thin next to the market section. Several pages run too small for reading in a room, notably slide 9's wheel diagram, slide 47's disclaimer, slide 55's small text on a pale background, and parts of slides 22 and 37.
Worth keeping: Keep the chart-led market slides such as 6 and 32, the consistent header, rule and footer system, and the section dividers with the progress dots.
Most useful repair: Enlarge or simplify the small-text pages (9, 22, 37, 55) and move or cut the ASX release page so the deck opens on slide 2.
What would change the score: I would sharpen many of the generic one-word titles (Exploration, Commercial, Financial Performance) into takeaway headlines and cut the repeated capital allocation slide (23 and 40).
Confidence medium. 55 of 55 pages inspected on contact sheets, 4 at readable size. Reviewed 2026-11-08. Model-assisted review (claude-sonnet-5-5).
Full text of the slides (55 slides)
Every slide's words and a description of its charts and images, so the deck can be searched and rebuilt. Also available as Markdown.
Slide 1
ASX RELEASE / 12 SEPTEMBER 2024 / STRATEGY DAY PRESENTATION / IGO Limited (ASX: IGO) (IGO or the Company) is hosting its 2024 Strategy Day today in Sydney. A copy of the presentation materials which will be used can be found attached. / Commenting on the Company’s new strategy, Managing Director and Chief Executive Officer, Ivan Vella, said: “The global energy transition is happening, with electrification at its core. To drive the transition, the world is going to need to discover and deliver a lot more battery materials. This is where IGO has a significant role to play. / “Under our new strategy, IGO will focus on upstream mining, where we can leverage our existing skills and capabilities to generate the most value through the cycle. We intend to build out a diversified portfolio with exploration, development and operating assets in lithium via our joint venture, and copper and/or nickel. We also see a substantial opportunity in developing commercial capability in lithium. / “We have a great platform, healthy balance sheet and strong cash generation from our exposure to Greenbushes, the best hard-rock lithium asset in the world that can generate strong margins through the cycle. We will be highly focused on returns, efficient capital allocation, disciplined decision making, strong governance and great operating performance, underpinned by our ability to operate with the highest level of sustainability.” / The Strategy Day will commence at 10.00am AEST (8.00am AWST), and a live webcast link can be found below: / https://ccmediaframe.com/?id=f9AiPw9k / All webcast participants will be able to ask questions by typing their questions into the webcast portal. It is recommended that participants pre-register for the webcast and join in advance of the commencement time. / A recording of the webcast and presentation will be available on the IGO website www.igo.com.au after the conclusion of the event. / This announcement is authorised for release to the ASX by Managing Director and CEO, Ivan Vella. / For further information, please contact: / Richard Glass / Head of Corporate Affairs and Investor Relations / T: +61 8 9238 8300 / E: [email protected] / Suite 4, Level 5 / 85 South Perth Esplanade / South Perth WA 6151 / PO Box 496 / South Perth WA 6951 / Western Australia / T. +61 8 9238 8300 / F. +61 8 9238 8399 / E. [email protected] / igo.com.au / IGO Limited / ABN 46 092 786 304 / Page 1
Visuals: Full-width header banner: an abstract blue and violet graphic with diagonal light streaks, fading to pale grey and white with a white triangular facet at the right edge; it is full-bleed across the top of the page with no border. Corner logo: the igo logo, a dark navy circle with white lowercase igo lettering and an orange dot over the i, at the top right of the banner. There are no charts, tables or photographs.
Slide 2
Discover | Develop | Deliver
IGO’s path to 2035
IGO Limited | 12 September 2024
Visuals: One photograph: an aerial, dusk-lit view of a mineral processing plant. Overlapping conveyor belts run diagonally from lower left toward the centre, with a concrete tunnel-like conveyor housing at lower left and a tall beige processing building at right. Yellow steel gantries, walkways and railings, grey hoppers and small beige cabins fill the scene. Sand-coloured ground surrounds the site. Floodlights and a stockpile are visible, and smoke rises in the distance at right. The sky is dramatic purple-blue with pink-orange clouds at the top and a warm glow on the horizon. Lighting is artificial yellow-white from the plant against the cool twilight sky. The photo is full-bleed across the whole slide, with a white panel overlay at about 90% opacity over the left and centre. A thin faint strip image (910 by 3 pixels) lies across the slide at about 23% from the top. No other graphics.
Slide 3
Contents / Market Context / Our strategy has been based on analysis of key markets and the critical implications we have considered / 4 / Purpose & Strategy / How we will deliver value to all stakeholders / 14 / Delivering the Strategy / Themes and our competitive advantages that will drive our success / 21 / Summary / 41 / Appendix / 45 / IGO Limited | Strategy Update / Page 2
Visuals: Logo: a dark navy filled circle (#152B6F) at x 88.5%, y 5.7%, w 6.1%, h 10.9%, containing a white lowercase igo wordmark with a small orange (#F5A03A, estimated) dot above the i. Decorative line: a horizontal gradient rule, image 910 by 3 pixels, at x 5.2%, y 23.1%, w 94.8%, h 0.6%, fading from medium blue (#2F5BB7, estimated) at the left to light grey (#C8C8C8, estimated) at the right edge. Separators: four thin orange horizontal lines (about #F5A03A) spanning about x 5.3% to 89.5%, placed at about y 41.4%, 51.8%, 62.2% and 72.5%. No photographs, charts or tables.
Slide 4
Background
Context of our new strategy
Our strategy has been reassessed in response to changing commodity markets, new leadership and our evolving portfolio
Strategy development has involved self reflections and deep research to identify our core beliefs
Our core beliefs have determined our view on where future value can be created
We have developed a strategy that:
Leverages IGO’s distinct advantages
Defines an aspirational but realistic future state
Forms a framework against which we can measure our success
Guides our stakeholders as to how we will allocate capital
IGO Limited | Strategy Update
Page 3
Visuals: Non-text elements: (1) igo logo: a navy #152B6F filled circle, about 6.1% wide by 10.9% high, with a white lowercase 'igo' wordmark and an orange #F7982A dot over the 'i'. (2) A horizontal gradient rule, a placed 910 by 3 pixel image spanning about 5.2% to 100% of the width at about 23.1% of the height, running from medium blue (about #2F5BB7) at the left to light grey (about #C8C8C8) at the right edge. (3) Three thin orange #F7982A horizontal rules, each about 46% wide starting at about 5.3% from the left, at about 49%, 66.5% and 80% of the height, about 2px thick. (4) One large navy #152B6F rounded shape, starting at about 55.7% from the left and 31.3% from the top, 44.3% wide by 54% high, with a left end rounded to a semicircle-like curve of about half the shape height, the right side cropped by the slide edge, and a thin dark navy outline (about #0B1A45, about 1.5px). No photographs, charts or icons.
Slide 5
Market
Context
Section
1
2
3
4
IGO Limited | Strategy Update
Page 4
Visuals: Photograph of a crowded motor show hall, boxed in a large rounded-left (half-oval) crop that runs off the right edge. Subject: dense crowds of blurred visitors walking among displayed cars; a brown/bronze SUV on a raised white display platform at upper left, a white station wagon and silver cars mid-frame, red cars at right, black cars in foreground bottom right, and a large BAIC Group (北汽集团 / BAIC GROUP) logo on a white overhead structure at top centre. A dark brown handrail runs diagonally bottom right. Composition: elevated viewpoint, wide framing, the photo is cropped on the right edge and its left edge is a smooth convex curve. Lighting: bright even exhibition lighting with warm highlights. Dominant colours: warm tan and wood-brown, white, red, black, with a deep blue backdrop panel at left. The image is not overlaid or tinted. Also a navy filled circle logo with white lowercase 'igo' lettering and a small orange dot above the 'i'.
Slide 6
Global Energy Transition & Electrification
EV transition is already underway and will accelerate as adoption challenges are addressed
EVs have a critical role to play in enabling the energy transition – and are fundamentally a better product than ICE vehicles.
China is the global leader in EVs following massive investments in supply chain and R&D – current committed capacity is double its 2030 domestic requirement.(1)
China EV sales have surpassed 40% market share(2), with most EV models now cheaper than their ICE equivalents.
Challenges around mass market adoption of EVs in Western markets are well understood – affordability, range anxiety, charging infrastructure, trade barriers and supply chain will be key.
1. International Energy Association, 2024
2. Based on passenger EV sales including Battery Electric Vehicles (BEV) and Plug-in Hybrid EVs (PHEV)
IGO Limited | Strategy Update
EV adoption is significantly advanced in China with Westerns markets playing catch up
Market share of new car registrations (BEV + PHEVs)
6%
38%
49%
10%
21%
31%
2%
10%
20%
2020
2023
2025E
2020
2023
2025E
2020
2023
2025E
China
Europe
US
Source: International Energy Association - Global EV Outlook 2024
EVs are now cheaper than ICEs in China
% of EVs priced higher than ICE equivalent vehicle
% of EVs priced lower than ICE equivalent vehicle
100%
75%
50%
25%
–
2019
2020
2021
2022
2023
1Q 2024
Source: BloombergNEF
Page 5
Visuals: Chart 1: clustered column chart titled 'Market share of new car registrations (BEV + PHEVs)' with a blue heading 'EV adoption is significantly advanced in China with Westerns markets playing catch up'. Three groups on a category axis: China (orange bars #F7982A) with 2020 6%, 2023 38%, 2025E 49%; Europe (navy bars #002060) with 2020 10%, 2023 21%, 2025E 31%; US (grey bars #808080) with 2020 2%, 2023 10%, 2025E 20%. Values are printed above each bar, no value axis, no legend, no gridlines; group labels China, Europe and US sit under thin grey bracket lines. Source line: 'Source: International Energy Association - Global EV Outlook 2024'. Chart 2: 100% stacked column chart titled 'EVs are now cheaper than ICEs in China', value axis 0% to 100% in 25% steps (labelled 100%, 75%, 50%, 25%, and a dash for 0). Legend above plot: orange square '% of EVs priced higher than ICE equivalent vehicle' and navy square '% of EVs priced lower than ICE equivalent vehicle'. Bars by category 2019, 2020, 2021, 2022, 2023, 1Q 2024; orange top segment is higher-priced share, navy bottom segment is lower-priced share. No values printed; estimates: 2019 about 84% higher and 16% lower; 2020 about 76% and 24%; 2021 about 70% and 30%; 2022 about 64% and 36%; 2023 about 48% and 52%; 1Q 2024 about 36% and 64%. No highlighted points. Source line: 'Source: BloombergNEF'. Logo: navy circle with white lowercase 'igo' and a small orange dot above the i.
Slide 7
Battery Materials
Lithium, nickel and copper are the major value pools in the battery materials sector
Batteries will be fundamental to the energy transition,
particularly for EVs which will require significant raw materials
including lithium, nickel and copper.
An 78kwh BEV includes raw materials for the battery pack
and electrical components worth ~US$5,000 -
$6,000 depending on prevailing prices and chemistry.
The major cost drivers are Lithium, Nickel and Copper -
approximately US$1,300 lithium, US$1,000 nickel and
US$700 copper(1,2).
Graphite, manganese, cobalt, rare earths and other critical
minerals will also have an important role to play in
electrification, although represent much smaller value pools
with more challenging market dynamics.
1. Based on industry estimates for a typical BEV. Nickel content based on a typical ternary cathode-based battery.
2. Assumes forecast prices of: Lithium Carbonate: US$21,000/t; Nickel: US$19,000/t; Copper: US$9,000/t.
3. 2035E figures expressed in constant 2024 dollar terms.
IGO Limited | Strategy Update
Page 6
Battery Raw Materials Market Value Pool (US$bn p.a.) 3
2023A
2035E
Lithium
28
98
Nickel
68
103
Copper
225
335
Source: Project Blue, SC Insights, LME, Bloomberg
Focus remains on the key value pools of
the battery minerals sector.
Visuals: Value chart with no axes, drawn as filled circles whose areas are scaled to value. Heading: 'Battery Raw Materials Market Value Pool (US$bn p.a.)' with superscript 3. Column headers: 2023A (left) and 2035E (right). Rows, top to bottom: Lithium with a dark navy circle showing 28 (2023A, the smallest circle, about 1.9% wide) and 98 (2035E, about 3.6% wide); Nickel with a grey circle showing 68 (2023A, about 3.0% wide) and 103 (2035E, about 3.7% wide); Copper with an orange circle showing 225 (2023A, about 5.4% wide, 9.7% tall) and 335 (2035E, about 6.7% wide, 11.8% tall). Values are printed in white bold numerals centred in each circle; no legend, no highlighted points. Below the chart is the source line 'Source: Project Blue, SC Insights, LME, Bloomberg'. Below that is a green rounded pill callout with white bold text. The logo top-right is a navy circle with a white lowercase igo wordmark and an orange dot over the i. Two orange horizontal rules divide the left text blocks. No photographs or icons.
Slide 8
EV market development
Each major geography will likely progress at different rates based on various external drivers
1 Global EV Sales limited by Supply, including production and supply chain issues
2 Global EV Sales limited by Demand. Increase in PHEV/ Hybrids
3 Potential for EVs to surpass ICE on all major metrics, but market specific
4 Global EV Sales increasingly forced by political mandates, potentially constrained by global supply
Million Units
100 90 80 70 60 50 40 30 20 10 0
100.0% 90.0% 80.0% 70.0% 60.0% 50.0% 40.0% 30.0% 20.0% 10.0% 0.0%
EV Penetration Level
2015 2016 2017 2018 2019 2020 2021 2022 2023 2024 2025 2026 2027 2028 2029 2030 2031 2032 2033 2034 2035 2036 2037 2038 2039 2040 2041 2042 2043 2044 2045
We are here now
Source: SC Insights, 2024
IGO Limited | Strategy Update
Page 7
Visuals: One area/line chart, shown as a raster image (1771 by 698 px) spanning about x 7.2% to 87.5% and y 26.9% to 83.2%. Chart type: combined area and line chart with a title-less plot. Left y-axis: 'Million Units', linear, 0 to 100, gridlines every 10. Right y-axis: 'EV Penetration Level', 0.0% to 100.0%, gridlines every 10 percentage points. X-axis: years 2015 to 2045, one label per year, labels rotated about 45 degrees. Series: one thick blue-violet line (about #4A5FB0) with a grey filled area beneath it (about #E9E7EA); labelled values are not printed, so approximate values: about 0.5 in 2015, about 4 in 2020, about 12 in 2022, about 19 in 2024, about 29 in 2026, about 40 in 2028, about 49 in 2030, about 57 in 2032, about 63 in 2034, about 76 in 2038, about 84 in 2042, about 88 in 2044 and 2045. Vertical shaded bands behind the line: teal-blue #156082 at 38% opacity from 2015 to about 2022; dark mauve #C00000 at 20% opacity over about 2022 to 2023; light pink band from about 2023 to 2026; yellow #FFFF00 at 51% opacity from about 2026 to 2033 with a darker yellow edge band at about 2026 to 2027 and about 2032 to 2033; purple #A02B93 at 32% opacity from about 2033 to 2045. A dark teal vertical line (about #156082, about 0.3% of width) marks 2024 with a small arrowhead at the x-axis, labelled 'We are here now'. Four numbered grey circles (about #E0E0E0) with black numerals 1 to 4 sit above the chart. No legend. No highlighted data points beyond the 2024 marker.
Slide 9
EV uptake & industry competitiveness / We observe two distinct market settings and different drivers of maturity / Less domestic oil/gas supply security drives electrification / Manufacturing and industry development through leverage of energy transition / Well-developed, international & integrated raw materials supply chain/processing / Fundamentally lower capital intensity - scale, speed, repeatability / Subsidised industries and consumers with large domestic market / Excess capacity drives costs down enabling faster EV take up. / Talent / capability development & deployment focused on growth industries / Significant investment in supporting EV & grid infrastructure. Different mobility requirements / There is a virtuous cycle in China enabling EV demand growth and rapidly maturing industry / Independent hydrocarbon security / Deployed capital, skills, value chain and industry committed to ICE. 100 yrs of history with ICE / Immature materials value chain; limited domestic supply & integration / Higher capital intensity – disrupted growth trajectory & limited scale / Changing policy and subsidy design challenges speed / Tariffs and market restrictions can impact early access to technology / Consumer preferences for large vehicles and range anxiety, less high speed public transport / EV & grid investment relies on private sector; uncertainty on returns drives delay / There are limitations and differences in the rest of the world. / Other external factors affecting the EV take-up landscape: / Fiscal challenges and government debt / Political and climate narratives / Geopolitical tensions / Regional conflicts / Market access constraints / IGO Limited | Strategy Update / Page 8
Visuals: Two radial diagrams made of eight light-grey (#F2F2F2) wedge segments each, separated by thin white gaps and arranged around a white circular hub. Left wheel (China): text in segments clockwise from top: Manufacturing and industry development through leverage of energy transition (top); Well-developed, international & integrated raw materials supply chain/processing (upper right); Fundamentally lower capital intensity - scale, speed, repeatability (right); Subsidised industries and consumers with large domestic market (lower right); Excess capacity drives costs down enabling faster EV take up. (bottom); Talent / capability development & deployment focused on growth industries (lower left); Significant investment in supporting EV & grid infrastructure. Different mobility requirements (left); Less domestic oil/gas supply security drives electrification (upper left). Centre hub shows a small Chinese flag (red #E8262E field with yellow star) above the bold text. Right wheel (rest of the world): Independent hydrocarbon security (top); Deployed capital, skills, value chain and industry committed to ICE. 100 yrs of history with ICE (upper right); Immature materials value chain; limited domestic supply & integration (right upper); Higher capital intensity – disrupted growth trajectory & limited scale (right lower); Changing policy and subsidy design challenges speed (lower right); Tariffs and market restrictions can impact early access to technology (bottom); Consumer preferences for large vehicles and range anxiety, less high speed public transport (lower left); EV & grid investment relies on private sector; uncertainty on returns drives delay (upper left). Centre hub shows a small globe icon (blue and green) above the bold text. Each wheel has small dark-navy chevrons (›, ⌄, ‹, ⌃) at the four compass points and small corner brackets outside the segments. Callout panel at right: rounded rectangle with navy outline holding a bold heading and five orange-bulleted items. Bottom right: a flat illustration of a light-blue electric hatchback (Tesla-style, side view facing left, dark-blue windows and wheels, light-blue body with white highlights) parked on a dark-navy ground shadow, plugged into a dark-navy EV charging post with a cyan '7' display; an orange charging cable loops from the post down and along the bottom edge. The car and post are unboxed and sit over the lower-right corner of the right wheel. No photograph; no chart or table.
Slide 10
Geopolitics and government policy
Subsidies and tariffs are not sufficient to sustainably alter industry economics
Our Observation
Implication
The global trade policy position is fluid but subsidies or market access controls which offer certainty and drive material and sustained economic impact in this sector seem very unlikely
We will build our business around fundamentals, focusing on
lean and competitive operations delivering sustained returns
Ongoing technology improvements in EVs and batteries will drive demand but also keep pressure on OEM's and value chain to evolve
Battery chemistry, processing technologies, extraction
techniques and EV technology change will continue to
accelerate. These are much more material drivers than
subsidies
For mining, the relative cost curve position remains set by the resource economics and mining technology
Subsidies and tariffs applied in the EV industry are tending
not to flow upstream to incentivise raw material production
Chinese industry development has delivered significant competitiveness. Western OEMs must continue looking beyond subsidies and tariffs for distinctive advantage
We will remain returns focused and positioned to
supply different markets
IGO Limited | Strategy Update
Page 9
Visuals: Four orange circular arrow icons in the centre gutter at x about 48.0%, width about 3.0%, each about 5.3% tall, vertically centred on rows at approximately y 38.6%, 52.6%, 66.7% and 80.8%. Each icon is an outlined circle with a right-pointing arrow, stroke orange about #F39C2B, stroke about 2 pt. Logo: a navy filled circle at top right (x 88.5%, y 5.7%, 6.1% by 10.9%) containing the lowercase white wordmark 'igo' with an orange dot above the i. Eight orange hairline dividers (about 0.1% height, orange #F5A03A): three under the left column at y about 50.7%, 65.2% and 79.7% spanning x 4.6 to 46.3%; three under the right column at y about 47.5%, 65.2% and 79.7% spanning x 52.9 to 96.7%. Blue-to-grey gradient rule under the subtitle.
Slide 11
Lithium
Current market conditions create a window of opportunity as the world’s need for lithium matures, however cost positioning is paramount
Lithium is a commodity like no other and is critical to all major commercial EV battery chemistries.
Significant R&D and capital already deployed means lithium is unlikely to be replaced.
The lithium industry will need to scale by at least 3x by 2035 – equivalent to 80 new unfunded projects¹ – representing a significant challenge for the industry.
Long term fundamentals remain intact with demand expected to continue to grow at a rapid, albeit at disjointed pace.
Extreme volatility should be expected given market immaturity. Current cyclical downturn will most likely amplify the next upswing. High volatility will continue until demand growth moderates.
Lithium demand (Millions of tonnes)
EV
ESS
Portable
Non-Battery
14%
20%
2015
2020
2025
2030
2035
Lithium demand is expected to grow 3x by 2035 which will require new supply equivalent to ~80 new unfunded projects¹
Source: SC Insights, 2024
1. Assumes an average project size of 20,000 tpy LCE, excludes 70 existing and 18 financed expansions, SC Insights
IGO Limited | Strategy Update
Page 10
Visuals: Chart: stacked column chart titled 'Lithium demand (Millions of tonnes)'. Categories are years 2015 to 2035 with one column per year (about 21 columns); x-axis labels printed every five years: 2015, 2020, 2025, 2030, 2035. The y-axis has no printed tick labels or range; values are not printed on the bars, so totals are visual only: columns rise from roughly 0.5 to about 1.7 units tall relative to the bar scale (about 0.5 Mt in 2015 rising to about 3.5 Mt in 2035 are estimates). Four series stacked bottom to top: EV (dark teal blue #156082, largest share in every year), ESS (orange #E97132), Portable (dark green #196B24, thin band), Non-Battery (light blue #0F9ED5, thinnest top band). Legend at top-left of the plot in the order EV, ESS, Portable, Non-Battery, each with a filled square swatch in the series colour and grey #474B55 text. Callouts: a light grey (#D9D9D9) rectangular label reading '14%' above the 2035 column, joined by a thin grey bracket line from about 2024 to 2035 with a downward arrow at 2035; a second grey label reading '20%' with a bracket from about 2024 down to 2030 with a downward arrow at 2030. No highlighted data points beyond these callouts. Divider and rule lines are described in elements.
Slide 12
Copper
Strong market fundamentals following several years of underinvestment in new supply
Copper is fundamental to the energy transition, which will drive an increasing proportion of copper demand as electrification gathers pace.
The EV industry will require significant volumes of copper, with 60kg1 required per EV on average. Grid and charging infrastructure will also drive considerable demand.
However, years of underinvestment in new supply has led to expectations of material long-term market deficits.
Strong market consensus around the long-term outlook has increased competition for assets – requiring a ‘smarter’ approach for playing in copper.
1. International Energy Forum, 2024
Source: BloombergNEF, 2022
Copper demand and supply (Millions of tonnes)
Transport Grid Other Supply
2024 2025 2026 2027 2028 2029 2030 2031 2032 2033 2034 2035
27 28 29 30 31 32 33 34 35 35 36 37
Transport will form an increasing proportion of copper demand, though there are expectations of long-term supply deficits
IGO Limited | Strategy Update
Page 11
Visuals: Chart: stacked column chart titled 'Copper demand and supply' with '(Millions of tonnes)' after it. The x-axis lists years 2024 to 2035 with no y-axis or gridlines shown. Each column has three stacked series from bottom to top: Transport in dark navy #152B6F, Grid in bright blue #0070C0, and Other in grey #63666A. A Supply series is drawn as an orange #E97132 line with about 2 pt stroke and no markers. The legend sits in one row above the plot: Transport, Grid, Other, Supply. Printed total values above each column, left to right: 27, 28, 29, 30, 31, 32, 33, 34, 35, 35, 36, 37. The Transport, Grid and Other segment values are not printed, so they are not stated here. Supply values are not printed; the line reads about 27 in 2024, about 28 in 2025 to 2028, about 32 to 33 in 2029 to 2030, about 34 in 2031, about 35 in 2032 to 2033, about 36 in 2034 and about 37 in 2035. Highlighted points: none. Logo: igo logo in the top-right corner, a white lowercase igo wordmark on a navy circle with a small orange accent above the i.
Slide 13
Nickel
Indonesia has structurally changed the global nickel market. Cost positioning is critical.
Indonesian laterites have changed the global industry
structure, but supply growth has slowed.
Stainless steel demand remains strong whilst
additional growth to be driven by EV batteries.
Nickel prices likely to be range bound with potential for new
Indonesian supply to be readily incentivised at higher prices.
Future projects will need to compete against the new
industry cost structure – high quality resources will be key to
winning in nickel.
Nickel demand and supply (Millions of tonnes)
Rest of world supply
Indonesia supply
Demand
2.0
2.0
2.1
2.2
2.4
2.5
2.6
3.1
3.3
3.5
3.7
4.0
4.1
4.3
4.4
4.4
4.4
4.5
4.5
4.5
2015
2017
2019
2021
2023
2025
2027
2029
2031
2033
The emergence of Indonesian nickel has changed the global supply structure placing an upper bound on prices
Source: Project Blue, 2024
IGO Limited | Strategy Update
Page 12
Visuals: One stacked column chart with a line overlay, titled 'Nickel demand and supply (Millions of tonnes)', with 'Nickel demand and supply' in bold and '(Millions of tonnes)' in regular. Twenty columns run from 2015 to 2034, with x-axis labels every second year from 2015 to 2033. Each column is stacked: a bottom dark navy segment labelled 'Rest of world supply' (#003860) and a top light blue segment labelled 'Indonesia supply' (#40B0FF), with thin grey column outlines. No y-axis, gridlines or axis range are printed. A magenta line labelled 'Demand' (about #A0288F, 2.5pt) with circular magenta markers runs across the column tops from about 2.0 in 2015 to about 4.5 in 2034. Printed demand values above the markers, left to right: 2.0, 2.0, 2.1, 2.2, 2.4, 2.5, 2.6, 3.1, 3.3, 3.5, 3.7, 4.0, 4.1, 4.3, 4.4, 4.4, 4.4, 4.5, 4.5, 4.5. Values for the rest of world and Indonesia segments are not printed; their split is about 1.3 to 3.0 in the lower segment and the balance in the upper segment. The legend sits top-left of the plot with a navy square for Rest of world supply, a blue square for Indonesia supply and a magenta dash for Demand, all in black Arial-style text. No highlighted points. Below the chart is a bold navy caption and a small Source line. The igo logo is a filled navy circle with white lowercase igo lettering and an orange dot over the i. Three thin orange horizontal rules divide the left text column.
Slide 14
Our Beliefs
Our strategy is based on core beliefs backed by considerable analysis which we will continue to test over time
Lithium
Li
Copper
Cu
Nickel
Li
There is a window to create value in
lithium, but cost competitiveness is
critical
Lithium is ubiquitous so time is of the
essence
Supply side challenges are
underappreciated
Geographic diversification will be
supported, despite China's industry
presence and strength
Project development will be driven by
low cost resources and capital
intensity, as well as higher standards
(ESG) of extraction
Subsidies and tariffs won’t be sufficient
to change industry economics
Copper is critical for the energy
transition, and this market’s maturity
offers lower volatility
Inorganic growth will be challenged by
resource scarcity and high
competition
Incentive price has moved lower,
meaning success in nickel is
contingent on low costs to deliver
sustained returns
Demand outlook is robust but will be
more fragmented across industries
(stainless / EV) than other battery
metals
IGO Limited | Strategy Update
Page 13
Visuals: None. The slide has no photographs, charts or diagrams. The only graphic items are three outlined pill-shaped column headers with filled circular element badges (Li, Cu, Li), the IGO logo, a thin gradient rule, and thin light grey separator lines between bullets in the columns.
Slide 15
Purpose &
Strategy
Section
1
2
3
4
IGO Limited | Strategy Update
Page 14
Visuals: Photograph of a young woman in a white hard hat, clear safety glasses, and an orange long-sleeved work shirt with a blue denim collar and a blue patch with a white 'igo' logo on the chest. She stands outdoors in front of a row of dark blue solar panels under a pale blue sky with soft clouds; a red-orange dirt track runs along the right side and blurred trees appear at the far right. She faces the camera with a slight smile, centred slightly left in the frame, shot at mid-shoulder framing with soft natural daylight and a shallow depth of field. Dominant colours: orange, navy, pale blue, red-orange earth. The photo is cropped into a large shape with a rounded left edge (a half-ellipse curve on the left side) and a flat top and bottom, bleeding off the right edge of the slide. Section tracker: four circles, each about 4.7% wide: circle 1 light grey #CCCCCC with white numeral, circle 2 muted periwinkle blue #8FA8D8 with white numeral (current section), circles 3 and 4 light grey #D9D9D9 with white numerals. Logo: navy #152B6F filled circle with a white lowercase 'igo' wordmark and a small orange dot above the 'i'.
Slide 16
Our Purpose
Remains unchanged and is relevant, engaging and core to our future
Making a
Difference.
Our work is making fundamental changes to the way communities all
around the world grow, prosper and stay sustainable.
Our teams are finding and producing the products that will make
energy storage mobile, efficient and effective enough to make
long-term improvements to people’s lives and the globe.
We believe in a clean energy future and by delivering the products
needed for tomorrow’s battery systems, we are making it happen.
IGO Limited | Strategy Update
Page 15
Visuals: Three navy circular icons with white line-art pictograms. Icon 1 (top): a figure in a cape flying upward beside a diagonal arrow pointing up and right with motion dashes. Icon 2 (middle): a globe with continents drawn in white line art held between two outlined hands. Icon 3 (bottom): a leaf inside two circular arrows forming a recycling-style loop. Also a thin horizontal gradient rule under the subtitle running from blue #2F5BB7 at left to light grey #C8C8C8 at right, and the igo logo at top right: white lowercase letters 'igo' with a small orange dot above the i on a navy circle.
Slide 17
Our Journey
Our evolution over more than 20 years has given us a distinct and unique advantage
IGO
Where we’ve come from
What we’ve delivered
Adapted and evolved our strategy
Initially base metals & gold, transitioning to clean energy metals
Built deep operational capability
Successful operations at Long , Nova and Forrestania
Operated across commodity & in different structures
Tropicana Gold Joint Venture, base metals, lithium Joint Venture with TLEA
Enduring commitment to organic growth via discovery
An enviable exploration portfolio and deep in-house capability
Generated value through M&A
Nova (via Sirius), Lithium JV (via TLEA), Tropicana JV divestment & adopted learnings from the WSA acquisition
Invested in technical development and capability
Downstream nickel processing, proprietary exploration tools and datasets
Proactive approach to culture and sustainability
A strong reputation which differentiates IGO with our stakeholders
IGO Limited | Strategy Update
Page 16
Visuals: Two-column connector diagram with no photographs. Left column: seven white rounded pill shapes with thin navy #152B6F outlines, labelled Adapted and evolved our strategy; Built deep operational capability; Operated across commodity & in different structures; Enduring commitment to organic growth via discovery; Generated value through M&A; Invested in technical development and capability; Proactive approach to culture and sustainability. Right column: seven white rounded pill shapes with thin orange outlines, labelled Initially base metals & gold, transitioning to clean energy metals; Successful operations at Long , Nova and Forrestania; Tropicana Gold Joint Venture, base metals, lithium Joint Venture with TLEA; An enviable exploration portfolio and deep in-house capability; Nova (via Sirius), Lithium JV (via TLEA), Tropicana JV divestment & adopted learnings from the WSA acquisition; Downstream nickel processing, proprietary exploration tools and datasets; A strong reputation which differentiates IGO with our stakeholders. Each left pill is joined to the matching right pill by a short navy horizontal line ending in a small solid navy dot at about x 43%, at the vertical centre of each row. Logo: IGO corporate mark, a solid navy #152B6F circle with white lowercase 'igo' lettering and a small orange #F7982A dot above the i. Gradient rule: thin horizontal bar fading from blue #2F5BB7 at left to light grey #C8C8C8 at right.
Slide 18
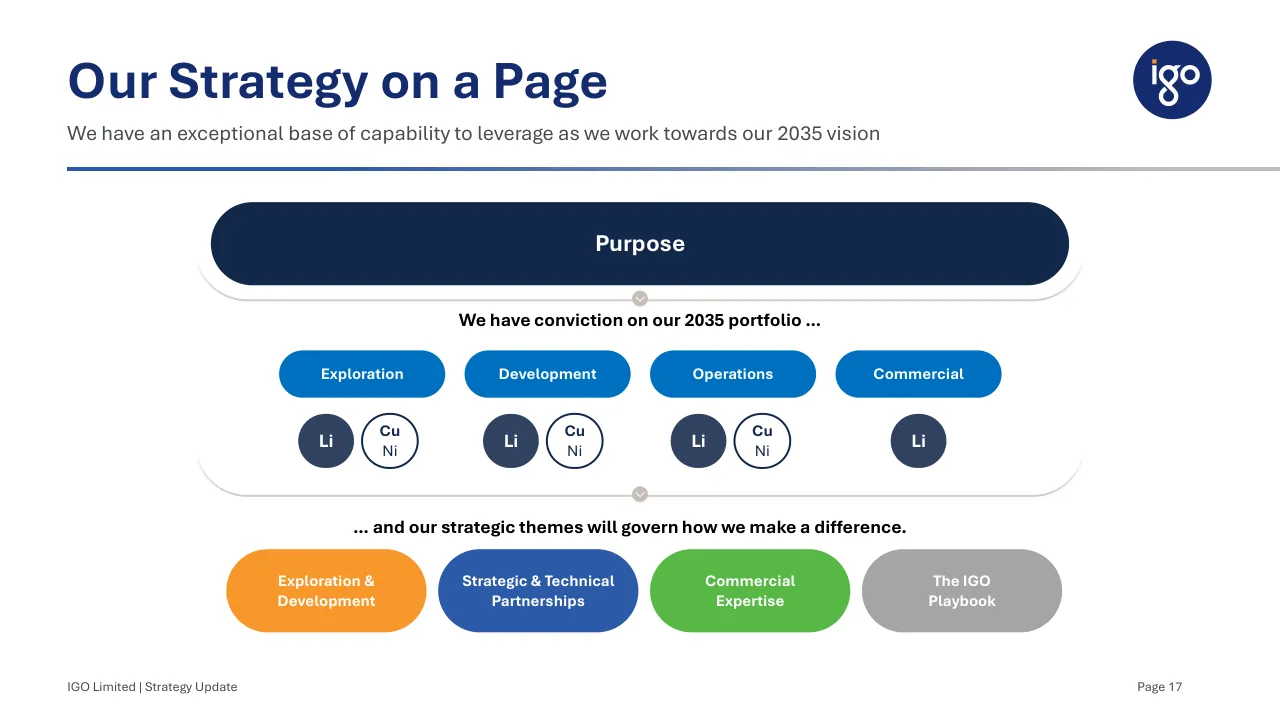
Our Strategy on a Page / We have an exceptional base of capability to leverage as we work towards our 2035 vision / Purpose / We have conviction on our 2035 portfolio … / Exploration / Development / Operations / Commercial / Li / Cu / Ni / Li / Cu / Ni / Li / Cu / Ni / Li / … and our strategic themes will govern how we make a difference. / Exploration & Development / Strategic & Technical Partnerships / Commercial Expertise / The IGO Playbook / IGO Limited | Strategy Update / Page 17
Visuals: Diagram with no chart or photograph. Shapes and connections: (1) one wide dark navy pill labelled Purpose, spanning x 16.5% to 83.5% at y 28.1% to 39.6%; beneath it a light grey curved bracket arc (670 by 42 px image, duplicated) at y about 34% to 42%, with a small grey circle with a downward chevron at centre x 50%, y about 41%, sitting on the arc's bottom edge. (2) Beneath, the text 'We have conviction on our 2035 portfolio …' centred. Then four blue pills in a row, each with a row beneath of dark circles and outlined circles: Exploration (dark circle Li, outlined circle Cu over Ni); Development (dark circle Li, outlined circle Cu over Ni); Operations (dark circle Li, outlined circle Cu over Ni); Commercial (dark circle Li only). There is no connector arrow between tiers; the bracket arc (second 670 by 42 px grey arc image at y about 61% to 69%) frames the circle row, with a second grey chevron circle at centre x 50%, y about 68.5%. (3) Text '… and our strategic themes will govern how we make a difference.' centred at y 71.9%. (4) Four pill-shaped theme buttons in a row with no outline: orange Exploration & Development, blue Strategic & Technical Partnerships, green Commercial Expertise, grey The IGO Playbook. The igo logo is a navy circle with white lowercase 'igo' lettering and a small orange dot above the i.
Slide 19
Our 2035 Portfolio / We have a clear view on where we want to play in the battery materials sector, and partnering closely via TLEA for Lithium / Upstream mining with carefully constructed downstream exposure / Our future portfolio / Exploration / Development / Operations / Commercial / Li / Lithium / Copper / / Nickel / Li / Lithium / Copper / / Nickel / Li / Lithium / Copper / / Nickel / Li / Lithium / Lithium via the TLEA Joint Venture / IGO Limited | Strategy Update / Page 18
Visuals: Four horizontal pill-shaped photographs in a row, each about 21.9% wide and 16.4% tall, each with a 0.94-opacity #0070C0 circle overlaid on its left end carrying a white label. Exploration: aerial view of a red-earth mine site with white portable buildings, a drill rig and haul trucks among scrub; daylight, full colour, warm ochre and green tones. Development: a yellow CAT excavator loading grey crushed rock, with the CAT logo visible on its side and the machine ID TX722 printed on the cab; daylight, grey and yellow dominant. Operations: a night aerial view of a lit processing plant with yellow structures, walkways and tanks, warm yellow lights against a dusk blue sky. Commercial: a cargo ship moored at a jetty beside turquoise shallow water and a rocky armour shoreline, pale blue sky. Below each pill, Li circles (filled #0E2841 with white Li and Lithium text) and Copper / Nickel circles (white fill with navy outline) in Exploration, Development and Operations, with only one Li circle under Commercial. Thin grey vertical dividers separate the columns, and a navy connector bus runs from each Li circle down to a central stem that meets the Lithium via the TLEA Joint Venture label box.
Slide 20
Portfolio diversification
We believe in the benefits of having a diversified portfolio
Global GDP vs Lithium, Copper & Nickel Prices
Rebased to 100
Lithium is a nascent and fast-growing market with demand driven by the battery market, which is expected to result in more price variability until the market matures.
Copper offers a more predictable pricing exposure to the energy transition as an established industrial market with prices historically correlated with global GDP.
Nickel prices are likely to be less volatile going forward given the fundamental changes to the global industry structure.
400
350
Lithium Price
Copper Price
Nickel Price
300
Global GDP
250
200
150
100
50
0
2018
2019
2020
2021
2022
2023
2024
Source: SC Insights, World Bank, LME, BloombergNEF
IGO Limited | Strategy Update
Page 19
Visuals: Line chart titled 'Global GDP vs Lithium, Copper & Nickel Prices', subtitled 'Rebased to 100'. X axis: years 2018 to 2024 with tick labels at each year, monthly data points. Y axis: index values 0 to 400 in steps of 50, no unit printed beyond the rebased index. Series: Lithium Price (dark teal-blue line, about 100 in early 2018, falls to about 25 by late 2020, rises sharply from about 2021 to a peak of about 373 near late 2022, then falls to about 60 by end of 2023); Copper Price (orange line, about 100 in 2018, dips to about 72 in early 2020, about 145 in early 2022, about 127 in 2023, about 115 at end); Nickel Price (dark green line, about 100 in 2018, about 84 in late 2018, about 137 in late 2019, about 92 in 2020, peaks about 263 in early 2022, about 225 in late 2022, about 128 at end); Global GDP (light blue line, nearly flat, about 100 in 2018 rising to about 119 by end of 2023). No highlighted points, no data labels, no markers. Legend at upper left of plot area with line swatches and labels in order Lithium Price, Copper Price, Nickel Price, Global GDP. Source line printed beneath the chart. Apart from the logo and the rules, there are no photographs or illustrations.
Slide 21
Strategic Themes / We have defined four key themes which will define the work we need to do to deliver / Exploration & / Development / Strategic & / Technical / Partnerships / Commercial / Expertise / The IGO / Playbook / To create a pipeline of projects / that either progress to / operations or divestment, / enabling transformational / growth. / To enable IGO and our TLEA joint / venture to act more quickly and / with more confidence to / capitalise on opportunities – / organic and M&A – at different / stages of the value chain and in / different geographies. / Create market conditions where / the products from our TLEA joint / venture have appropriate / market access and are / appropriately valued. / The IGO Playbook will capture / our DNA and will be a blueprint / for successful replication of our / way of operating. It will describe / the interconnected way we work / and create value, positioning us / as a developer, operator and / partner of choice. / IGO Limited | Strategy Update / Page 20
Visuals: Illustration set of four pill-shaped headers, each with a solid circle carrying white label text and a line-art illustration. (1) Orange circle #F7941D on pale peach capsule #FDD3A4 with line drawing of a drilling rig, a truck and a tree, with a downward arrow at lower left. (2) Dark blue circle #2D5AA8 on lavender capsule #CDD3EC with line drawing of two standing figures (a woman in a dress and a man in a suit holding a briefcase), a rising bar chart and a dollar coin with an arrow. (3) Green circle #5BB94A on pale green capsule #C5E3B9 with line drawing of a building, a battery, a monitor showing a pie chart and list, and a head outline containing a gear. (4) Taupe circle #C5BDB8 on light grey capsule #E9E6E3 with a grid of eight white circular icons (target, person, shield with tick, gear, lightbulb, document) and a notebook labelled with a small igo logo. No photographs. Flat line art in dark grey outlines, no shadows. Logo at top right: navy circle with white lowercase igo wordmark and an orange dot over the i. Bottom colour bar of four equal segments: orange #F7941D, blue #2D5AA8, green #5BB94A, taupe #C5BDB8, each aligned with a column.
Slide 22
Strategic Objectives
Prioritised our key objectives over three distinct time horizons
Short
Term
Next
1-2
years
• Maximise the potential of our lithium business through the TLEA Joint Venture
• Work with our partners to optimise Greenbushes and define full potential for this asset
• Develop a clear view on lithium market and support TLEA with market development
• Help resolve the economic pathway for the Kwinana Refinery
• Partner and develop technology for improved upstream lithium extraction and processing
• Operate Nova with a focus on safe and stable operations with cash maximisation to end of mine life
• Apply a disciplined and commercial focus on our exploration and development portfolio, focused on lithium and copper
• Continue to improve safety and sustainability performance
• Develop IGO Playbook
Medium
Term
Next
5 years
• Build the pipeline of projects in exploration, development and operations
• Gain recognition as a globally relevant lithium industry player through our TLEA partnership
• Optimise and apply IGO Playbook to future opportunities
Long
Term
Next
10 years
• Build a strong and relevant lithium business with multiple assets at different stages exploration, development and operation
• Hold a diversified portfolio of development and operating assets in battery materials sector
• Demonstrate systematic delivery of exploration success
IGO Limited | Strategy Update
Page 21
Visuals: Three horizontal pill-shaped bands, each a rounded rectangle with fully rounded ends. Short Term band: light grey #EBE7E6 pill x5.6 y25.0 w87.7 h33.7, overlaid on its left by a lighter blue #5870B6 ellipse x5.5 y24.6 w25.4 h34.1 and a darker blue #2C59A8 circle x13.3 y24.6 w19.0 h34.1 labelled 'Next / 1-2 / years' in white. Medium Term band: light grey pill x6.0 y60.9 w87.1 h14.3, overlaid on its left by a light orange #F3B46F pill x6.0 y60.9 w27.2 h14.3 and an orange #F7921E circle x25.4 y60.9 w7.8 h14.3 labelled 'Next / 5 years'. Long Term band: light grey pill x6.0 y76.7 w87.9 h14.3, overlaid on its left by a light green #92CB87 pill x6.0 y76.6 w31.5 h14.3 and a green #58B946 circle x29.5 y76.7 w8.1 h14.3 labelled 'Next / 10 years'. Circles overlap the pills' coloured portions and extend slightly beyond them. Gradient rule: thin line x5.2 y23.1 w94.8 h0.6 running from blue to pale grey. Logo: navy #152B6F circle with white lowercase 'igo' wordmark and a small orange dot above the i, at x88.5 y5.7 w6.1 h10.9. No photographs or charts.
Slide 23
Capital Allocation
Clear framework to allocate capital with discipline
FY24 Dividend declaration was
consistent with this framework
Operating Cash Flow
from Safe and Reliable Operations
External Capital
(Debt and Equity)
Sustaining Capital
Exploration
Maintenance of Debt
Investment in Sustainability
Organic Growth
Inorganic Growth
~40% of Underlying FCF paid out
to shareholders via 37c dividend
Shareholder Returns
Target returns of between 20-40% of underlying FCF when liquidity is under $1.0 billion.
The Board to consider higher returns when liquidity is above $1.0 billion.
Special Dividends
and Share Buybacks
Debt Reduction
Inorganic Growth
FY24 Payout: $280M
IGO Limited | Strategy Update
Page 22
Visuals: Flow diagram made of rounded stadium-shaped pills and grey connectors, with no photographs or charts. Top row: a wide blue pill labelled Operating Cash Flow / from Safe and Reliable Operations spanning 5.3 to 55.2 percent x, and a narrower blue pill labelled External Capital / (Debt and Equity) at 56.1 to 72.3 percent x; both at 29.2 to 40.7 percent y. Thin light grey #D0CECE bracket lines run from the top pills down to the orange row, with small grey #BFBFBF circular chevron-down markers: one at about 30 percent x and 43 percent y under Operating Cash Flow, and one at about 64 percent x and 43 percent y under External Capital. The middle row has six orange #F7921E pills of equal size (10.6 by 11.5 percent) at 45.2 to 56.7 percent y with white bold labels: Sustaining Capital, Exploration, Maintenance of Debt, Investment in Sustainability, Organic Growth, Inorganic Growth; the bracket lines feed Sustaining Capital, Organic Growth and Inorganic Growth from above. Below the orange row, two pale grey #D9D9D9 curved arcs frame the row and converge on a grey chevron marker at about 39 percent x and 59 percent y. A wide blue #2C59A8 pill at 5.3 to 72.3 percent x and 61.3 to 72.8 percent y holds Shareholder Returns and two lines of white body text. A second grey chevron marker sits at about 39 percent x and 75 percent y below it, with the curved grey arc framing the pill from below. Three green #58B946 pills at 77.7 to 89.2 percent y hold Special Dividends and Share Buybacks, Debt Reduction, and Inorganic Growth. On the right, two thin orange #F7921E horizontal rules at about 49.7 and 70.6 percent y run from 75.1 to 96.9 percent x, separating three annotation text blocks. The logo is a dark navy #152B6F filled circle containing a white lowercase igo wordmark with a small orange #F7921E dot above the i.
Slide 24
Delivering
the
Strategy
Section
1
2
3
4
igo
IGO Limited | Strategy Update
Page 23
Visuals: Photograph: an aerial view of an open-pit mining processing plant at sunset. A long diagonal overhead conveyor belt rises from lower left to a control platform at centre right, with a steel lattice conveyor tower on the left supported by diagonal cables. A large pale grey stockpile of crushed aggregate fills the foreground centre. The low sun sits on the horizon at centre right with a bright white-gold glow. Behind the plant are a row of white-roofed sheds, processing structures, a pale water body and a dark tree line. Lighting is low golden sun from the front-right. Dominant colours are teal-grey sky at the top fading to amber and orange at the horizon, with warm gold highlights and grey-blue industrial tones. The image is cropped with a large rounded top-left corner and rounded bottom-left corner, and it runs off the right edge of the slide, so it is not full-bleed but is partly cropped by the slide edge. No overlay or tint. Logo: the IGO wordmark, white lowercase 'igo' with a small orange dot above the i, on a solid navy #152B6F circle. Section tracker: four circles, the third one filled with light blue and the other three in light grey, each holding a white numeral.
Slide 25
Preparing for growth
Significant achievements in last 8 months
Enhanced safety performance
TRIFR rates have reduced from 16.0 to 10.4. Strong focus on proactive safety
leadership
Made a decisive call on Cosmos
Transitioned safely to care and maintenance given project challenges and change in
market conditions
Reviewed our exploration business
Rationalised portfolio, new operating model and reset budget
Lithium Joint Venture
Worked with our partners via TLEA and Windfield to pursue value and long-term
success
Improved capital flexibility
Generated strong free cash from operations, TLEA dividend and refinanced IGO debt
facility
Reshaped our corporate team
Implemented new operating model and organisational design to support our business
and strategy
Built executive strength
Appointed Brett Salt (Chief Growth and Commercial Officer) and
Marie Bourgoin (Chief Development Officer – Lithium)
IGO Limited | Strategy Update
Page 24
Visuals: Seven rows, each containing: a green circle with a white checkmark at the left edge, overlapping the left end of a navy (#152B6F) rounded pill bar carrying a white label; and a light grey (#F2F2F2) rounded bar to the right carrying black description text. Row labels in order: Enhanced safety performance; Made a decisive call on Cosmos; Reviewed our exploration business; Lithium Joint Venture; Improved capital flexibility; Reshaped our corporate team; Built executive strength. Also a navy circular IGO logo at top right (white lowercase igo lettering with a small orange accent dot over the i) and a thin horizontal gradient rule fading from blue on the left to light grey on the right. No photographs or charts.
Slide 26
Safety
Improving safety performance remains our highest priority
Lag Safety Performance¹
20.2 / 17.7 / 16.5 / 16.0 / 12.7 / 12.0 / 12.1 / 10.4
1Q23 / 2Q23 / 3Q23 / 4Q23 / 1Q24 / 2Q24 / 3Q24 / 4Q24
TRI's / TRIFR
TRIFR has reduced over recent time but remains higher / than desired
We are strengthening our safety culture and leadership / capability through education and coaching
We will continue our focus on occupational health, / wellbeing and psychosocial risk management
1. 12 month moving average calculated as the number of recordable injuries x 1,000,000 divided by the total number of hours worked. IGO reports recordable injuries (TRI) as the sum of Lost Time Injury (LTI), Medically Treated Injury (MTI) / and Restricted Work Injury (RWI) as required by Part 1.1 r.5 of the WHS (Mines) Regulations 2022. Western Areas injury data is captured from June 2022 onwards for the lead indicators, and April 2023 onwards for the lag indicators.
IGO Limited | Strategy Update
Page 25
Visuals: Chart: combined bar and line chart titled Lag Safety Performance with superscript 1. Bars series TRI's in dark navy #2C2D65, unlabelled, no value axis or axis title shown; bars are about 84% (1Q23), 50% (2Q23), 67% (3Q23), 33% (4Q23), 100% (1Q24), 83% (2Q24), 17% (3Q24), 50% (4Q24) of the tallest bar (relative heights are estimates). Line series TRIFR in orange #E36C0A, 2.25pt line with hollow white circular markers outlined in orange, each with printed value: 1Q23 20.2, 2Q23 17.7, 3Q23 16.5, 4Q23 16.0, 1Q24 12.7, 2Q24 12.0, 3Q24 12.1, 4Q24 10.4. Labels are bold black Calibri above markers. Category axis labels 1Q23 to 4Q24 in black Arial beneath a thin grey horizontal baseline; no vertical axis. Legend at bottom centre: navy bar swatch labelled TRI's, then orange line-with-marker labelled TRIFR. No points are highlighted beyond the marker styling. Logo: IGO circular mark with white lowercase igo lettering and a small orange dot above the i. Decorative rule: a horizontal line with a blue-to-grey gradient, about 3 pixels tall.
Slide 27
Sustainability
Delivering our strategy will rely on the trust we hold with all of our stakeholders
Unique culture, outstanding people and a strong focus on / safety, diversity, inclusion and care
Committed to managing our climate and nature-related risks / and opportunities - Net Zero Scope 1 and 2 emissions across / our operated assets by 2035
Focused on driving reconciliation and working with traditional / owners – Innovate Reconciliation Action Plan launched in / August 2023
Safety, Health / and Wellbeing
Our People
Traditional / Owners and / Communities
Making a / Difference
Our Approach / to Climate / Change
Environment
Governance / and Business / Integrity
Our Financial / Contributions
IGO Limited | Strategy Update
Page 26
Visuals: One circular ring diagram (rendered as a 1200 by 1200 pixel image, placed at x 54.2%, y 21.6%, w 41.5%, h 73.8%, not cropped, boxed by no frame) made of eight segments in two alternating colours: blue #2B579A segments and dark charcoal #3A3F47 segments, plus beige-grey #C8C2BE segments, arranged clockwise from the top: Safety, Health and Wellbeing (blue, top, with a white heart-with-pulse-line icon), Our People (charcoal, upper right, with a white group-of-three-people icon), Traditional Owners and Communities (blue, right, with a white handshake-in-heart icon), Our Approach to Climate Change (beige, lower right, with a white globe-and-arrows icon), Environment (blue, bottom, with a white hands-holding-sprout icon), Governance and Business Integrity (charcoal, left, with a white speech-bubbles icon), Our Financial Contributions (beige, upper left, with a white dollar-sign icon). Each segment is a rounded lobe shape with white bold labels. At the centre is a white circle with 'Making a Difference' in bold blue #2F5597 text. Three orange horizontal rules (about #F4A23A, about 0.2% of slide height thick) divide the left column at about y 47.8% and y 68.6%, spanning about x 5.3% to 50%. A thin blue-to-grey gradient rule (image 910 by 3 pixels, x 5.2%, y 23.1%, w 94.8%, h 0.6%) runs across the slide. The IGO logo is a navy #152B6F circle (x 88.5%, y 5.7%, w 6.1%, h 10.9%) containing the white lowercase wordmark 'igo' with an orange dot over the i.
Slides 28 to 55 continue in the full text file.
Download this deck
The hosted PDF of every library deck is free for readers of the SlideDeck Co newsletter. Join with your email and the viewer and download appear here.
Preparing a strategy presentation of your own? The SlideDeck Co Consulting Deck is a slide library with a statement of work and a worked client case.