The deck is the opening keynote from Climeworks' Direct Air Capture Summit 2023, given by its CEO and published as a PDF. It opens with a bold headline slide, "In 15 years", sourced to a BloombergNEF study, which sets the time horizon for the argument. The middle section builds a case in sequence. A survey-based chart shows how carbon removal share in corporate portfolios is expected to grow toward 2030, followed by a breakdown of a carbon portfolio over time to 2050. A statement then notes that direct air capture has clear benefits: no arable land is needed, it is fully additional, and it is fully measurable. An IPCC chart compares the mitigation potential of several removal methods, and a slide covers the capture-to-removal process with its losses and third-party verification. A slide on cost per ton and cost of goods sold, plus a photovoltaic cost curve framed as a "cost mountain" that technology must climb, support the scale-up theme. The closing slides turn to the portfolio mix, suggesting about 40 percent engineered removal by 2030.
Full text of the slides (10 slides)
Every slide's words and a description of its charts and images, so the deck can be searched and rebuilt. Also available as Markdown.
Slide 1
$1 tn
In 15 years
Source: BloombergNEF study, January 2023
Visuals: One full-bleed greyscale photograph of cracked, weathered dark stone or rock, with deep shadows in the cracks and a grainy texture, showing no people or objects. It is not cropped beyond the slide edges and has no overlay tint. The headline '$1 tn' is set as large white vector glyphs over the photograph. A single white horizontal hairline rule spans about 23% to 75% of the slide width at about 60% of its height. No charts, tables, logos or icons.
Slide 2
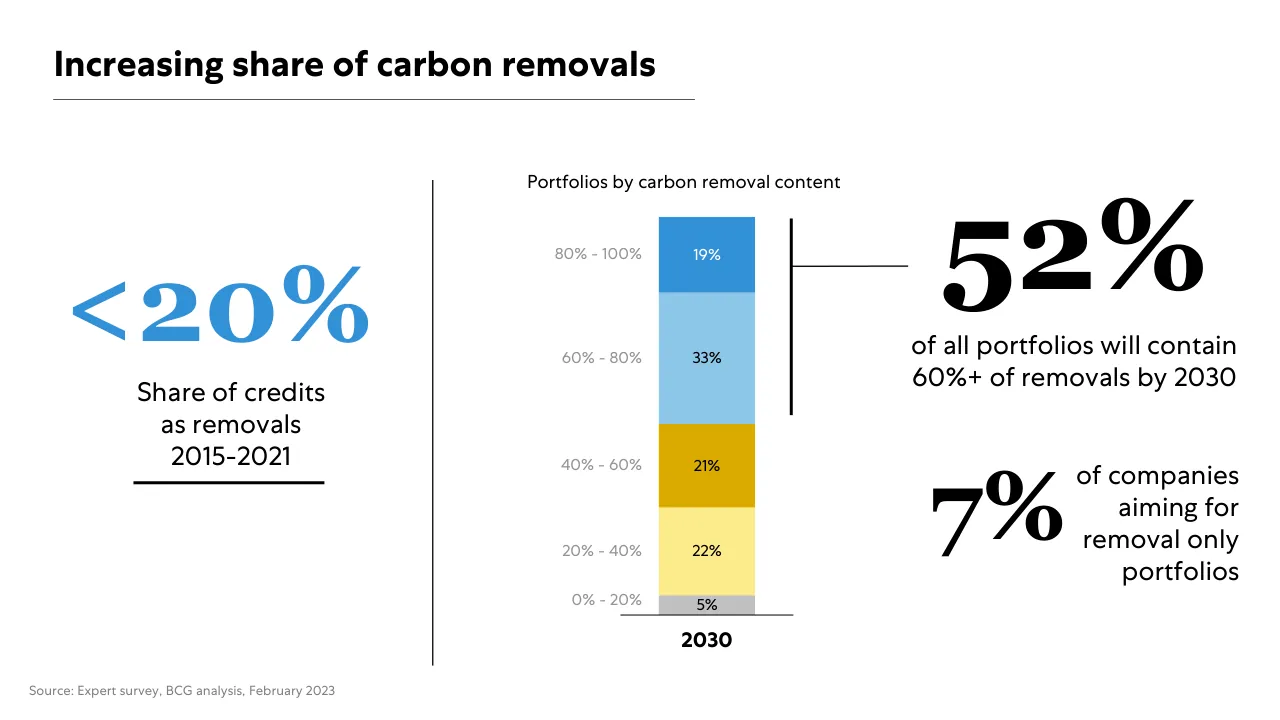
Increasing share of carbon removals / <20% / Share of credits / as removals / 2015-2021 / Portfolios by carbon removal content / 80% - 100% / 19% / 60% - 80% / 33% / 40% - 60% / 21% / 20% - 40% / 22% / 0% - 20% / 5% / 2030 / 52% / of all portfolios will contain / 60%+ of removals by 2030 / 7% / of companies / aiming for / removal only / portfolios / Source: Expert survey, BCG analysis, February 2023
Visuals: Stacked bar chart titled 'Portfolios by carbon removal content', single bar labelled 2030 on the x-axis. The y-axis carries the bands 0% - 20%, 20% - 40%, 40% - 60%, 60% - 80%, 80% - 100% (percent of portfolio carbon removal content). Segments from bottom to top: 0% - 20% 5% grey #C0C0C0, 20% - 40% 22% pale yellow #FDEB8C, 40% - 60% 21% dark gold #DAAA00, 60% - 80% 33% light blue #8DC8E8, 80% - 100% 19% blue #3391D8. Segment values are printed inside each segment; no legend. A thin black bracket line spanning the 60% - 80% and 80% - 100% segments (about 52% of the bar height from the top) connects via a horizontal leader to the large 52% statistic. The chart has a black baseline under the bar. Stat '<20%' is printed in blue, not a chart; no photographs, logos or icons.
Slide 3
Carbon portfolio breakdown to 2050
Indicative breakdown of carbon portfolio over time
100%
80%
60%
40%
20%
0%
1. Avoided emissions and emissions reduction with short lived storage
2. Carbon removal with short lived storage
3. Emissions reduction with long lived storage
4. Carbon removal with long lived storage
2020
2030
2040
2050
Adapted from The Voluntary Carbon Market: Climate Finance at an Inflection Point by World Economic Forum & Bain Company, based on The Oxford Principles for Net Zero Aligned Carbon Offsetting
Visuals: One stacked area chart (raster image, 2391 by 1092 px) with the title 'Indicative breakdown of carbon portfolio over time' printed above the plot. Y-axis: percent of carbon portfolio, 0% to 100%, labelled at 0%, 20%, 40%, 60%, 80%, 100%, with gridlines absent and a thin grey vertical axis line. X-axis: years 2020 to 2050, labelled at 2020, 2030, 2040, 2050, with a thin grey horizontal baseline. Four stacked bands, bottom to top: band 4 dark blue (carbon removal with long lived storage) rising from 0% at 2020 to about 35% at 2040 and 100% at about 2050; band 3 light blue (emissions reduction with long lived storage) rising from 0% in 2020 to about 35% in 2040 and 100% at 2050; band 2 teal-green (carbon removal with short lived storage) rising from 0% to about 40% at 2020 and about 80% by 2035 to 100% at 2050; band 1 pale mint (avoided emissions and emissions reduction with short lived storage) occupying the remainder, from about 40% at 2020 up to 100%. Values are not printed; the figures above are estimates marked about. No legend; the four numbered labels act as the legend. Four circular icons sit on the bands: icon 1 two leaves/trees (teal outline) on pale mint at about 2022-2024 band 1; icon 2 same tree icon (teal outline) on teal band near 2030; icon 3 factory with three windows (blue outline) on light blue near 2036; icon 4 storage block with dots and blue stripes (blue outline) on dark blue near 2044. No highlighted points.
Slide 4
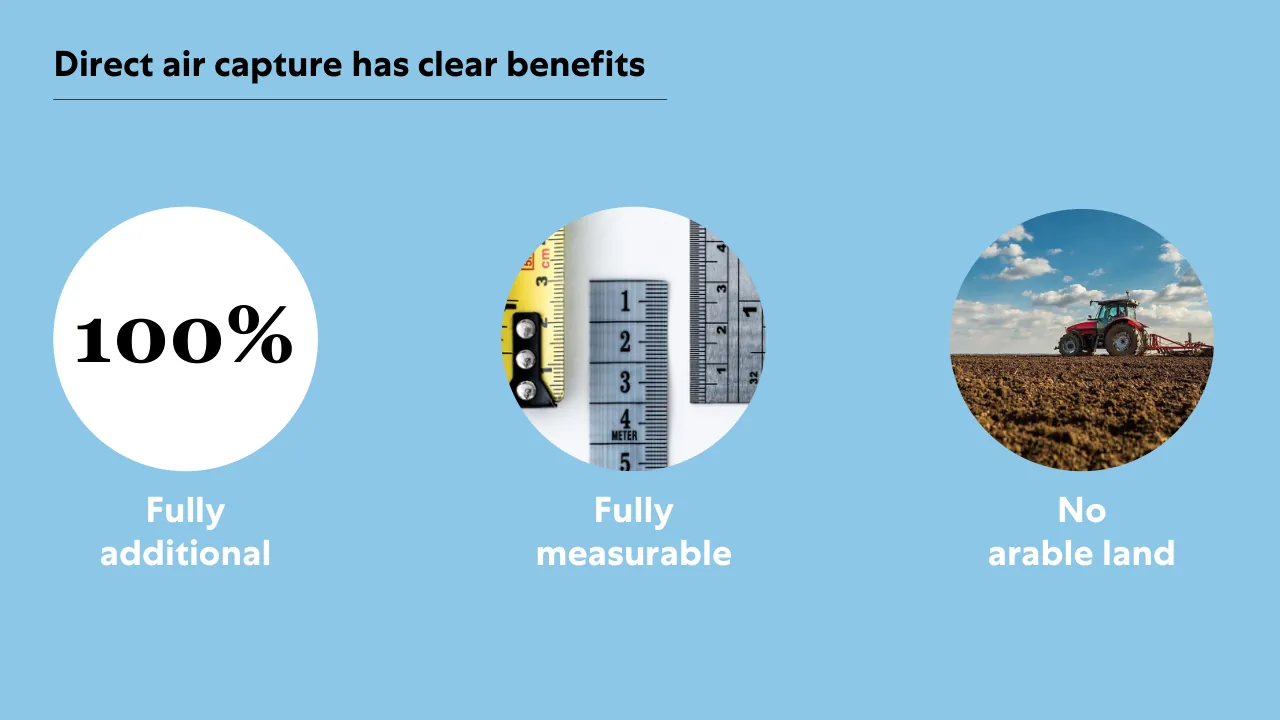
Direct air capture has clear benefits
100%
Fully
additional
Fully
measurable
No
arable land
Visuals: Three circular items in a row. (1) A white filled circle, centre about x 14.5%, y 46%, diameter about 20.7% of slide width, containing the text '100%' in a bold high-contrast serif (Georgia Bold, black #000000), centred. (2) A circular photograph, centre about x 49.5%, y 46%, diameter about 20.7% of width, showing a close-up of a yellow retractable tape measure at left (with a black belt clip and three silver rivets, markings '3 cm' and '2') beside a grey-steel metal ruler labelled 1, 2, 3, 4, 5 with 'METER' printed under 4, and a second grey ruler at right labelled 1, 2, 3, 4 and 32 at its edge; background is plain white, lit evenly from above, neutral grey and yellow dominant colours, tightly framed and cropped to the circle. (3) A circular photograph, centre about x 84.5%, y 46%, diameter about 20.7% of width, showing a red tractor with cab and a trailing red-and-grey cultivator on bare brown tilled soil, under a blue sky with scattered white cumulus clouds; low camera angle with the horizon near the lower-middle of the circle; daylight; dominant colours blue, brown and red; full image cropped to the circle, no overlay or tint.
Slide 5
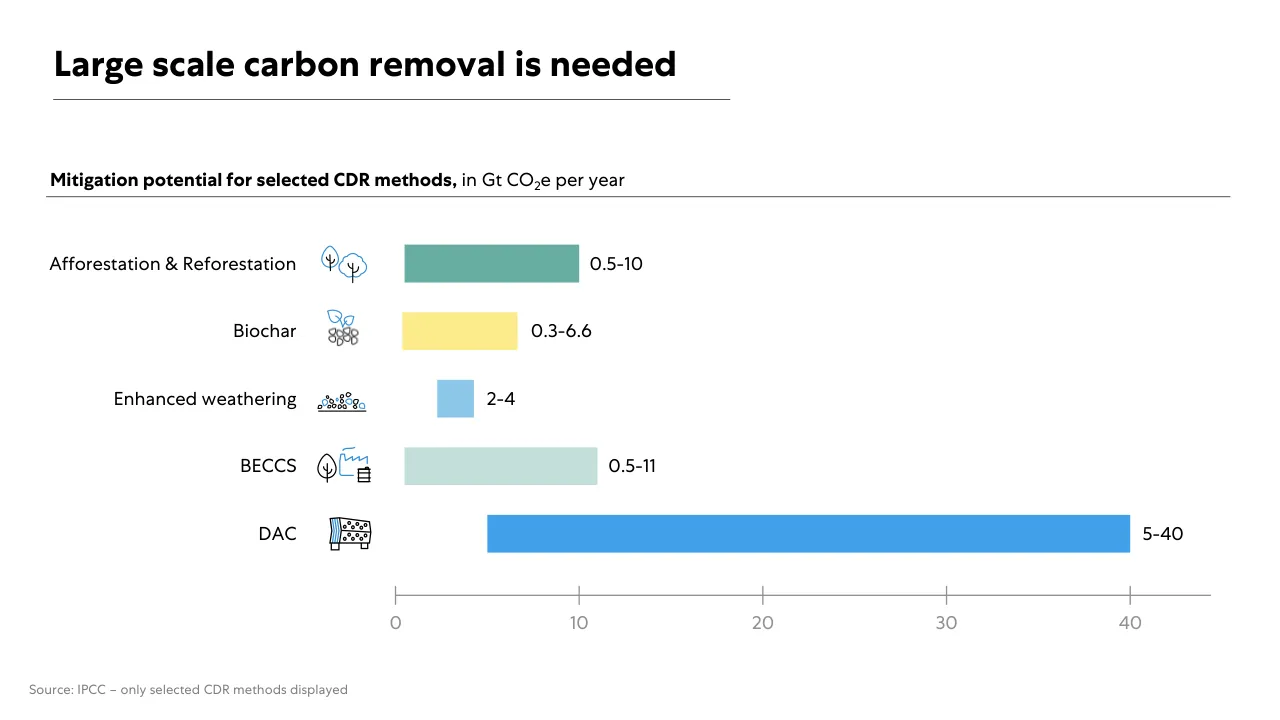
Large scale carbon removal is needed / Mitigation potential for selected CDR methods, in Gt CO2e per year / Afforestation & Reforestation / 0.5-10 / Biochar / 0.3-6.6 / Enhanced weathering / 2-4 / BECCS / 0.5-11 / DAC / 5-40 / 0 / 10 / 20 / 30 / 40 / Source: IPCC – only selected CDR methods displayed
Visuals: Horizontal floating range-bar chart. Title: none inside chart; caption above it reads 'Mitigation potential for selected CDR methods, in Gt CO2e per year'. X-axis: linear, labelled 0, 10, 20, 30, 40 with grey tick marks, axis line runs from 0 to about 44 Gt CO2e per year, no axis title beyond the caption, unit Gt CO2e per year. Y-axis: categorical, no axis line. Series (one bar per method, printed values): Afforestation & Reforestation 0.5-10, bar #67AEA2 spanning 0.5 to 10; Biochar 0.3-6.6, bar #FDEB8C spanning 0.3 to 6.6; Enhanced weathering 2-4, bar light blue #91C8E8 spanning 2 to 4 (colour estimated); BECCS 0.5-11, bar #C2DFDA spanning 0.5 to 11; DAC 5-40, bar #419FE7 spanning 5 to 40. Bars are solid rectangles with no outline, each value label printed to the right of its bar in black. No legend. No highlighted points beyond the colour of each bar. Icons: Afforestation and Reforestation icon (blue-outlined leaf with black sprout beside blue-outlined round tree canopy with black trunk); Biochar icon (blue-outlined leaves above a cluster of grey outlined round granules); Enhanced weathering icon (row of small black-outlined pebbles and blue dots scattered on a black ground line, with a blue dot at right end); BECCS icon (black-outlined leaf with sprout beside a blue-outlined factory with stacks and a black stacked-box symbol at its base); DAC icon (black-outlined rectangular block with blue vertical stripes on its left face and black-outlined dots filling its top face, standing on two small square legs). All icons are line icons, black and blue, about 3% to 4% of slide width.
Slide 6
No words are printed on the slide. The only lettering is 'CAPITAL' painted on a container at the far right edge of the photograph.
Visuals: Photograph, full-bleed, landscape. Subject: an outdoor industrial installation on a grassy, gravelly plateau. Three large black-and-grey louvred modules stand on concrete pads: a left module angled with its face toward the viewer, a larger centre-right module, and a smaller module at the far right partly cut off by the frame edge. Between the left and centre modules stands an open steel frame cage (grey-green painted I-beams and diagonal bracing) holding a dense cluster of grey insulated pipes, valves and small electrical boxes. A grey corrugated-metal shed with a roller door is at the far left. A white container and a dark green container with the word 'CAPITAL' are at the far right, with a low tan hillside behind them. Pipes run along the ground at the right. Composition: low camera angle, centred, subject filling the middle band, horizon low in frame. Lighting: soft daylight with diffuse sun, no hard shadows. Dominant colours: blue sky #4A90C8 fading to pale #DDE8F0 near the horizon, white cumulus clouds, charcoal #2E2E2E and dark slate #3A3F44 louvres, grey-green steel #6B7566, concrete #9A9A96, grass and gravel foreground #4E5A36 with dark soil #2B2A26. Not cropped apart from the right-hand module touching the edge; no overlay or tint.
Slide 7
From capture to removal / CDR production efficiency / Availability / Performance / Recovery / Grey emissions / Planned and / unplanned / downtime / 10% / Wind, weather, and / sorbent degradation / losses / 0% (average) / CO2 extraction and / purification losses / 5% / Accounting for grey / emissions of full / supply chain / 15% / Complete process is 3rd party verified / Nameplate CO2 / capture capacity / Available CO2 / capture capacity / CO2 / captured / CO2 / stored / CDR / produced / CO2 quantities / Corrections & losses / Net CDR
Visuals: Waterfall chart with five vertical bars and four correction steps, no axes or gridlines. Bar 1 Nameplate CO2 capture capacity is light blue, tall, starting at the baseline. Step labelled Availability is a yellow block dropping from the top of bar 1 with callout Planned and unplanned downtime 10%. Bar 2 Available CO2 capture capacity is light blue and lower. Step labelled Performance has a callout Wind, weather, and sorbent degradation losses 0% (average) and no visible yellow block. Bar 3 CO2 captured is light blue, same height as bar 2. Step labelled Recovery is a small yellow block with callout CO2 extraction and purification losses 5%. Bar 4 CO2 stored is light blue and lower. Step labelled Grey emissions is a yellow block with callout Accounting for grey emissions of full supply chain 15%. Bar 5 CDR produced is a darker blue bar at the lowest level. A thin black elbow arrow labelled CDR production efficiency runs from above bar 1 horizontally to the right and drops down with an arrowhead onto the top of bar 5. A grey hatched horizontal band runs behind the bars with the bold label Complete process is 3rd party verified centred on it. Legend at bottom left: light blue square labelled CO2 quantities, yellow square labelled Corrections & losses, dark blue square labelled Net CDR. Icon at right: a circular outline in blue containing a black line-drawn document with three text lines, a rosette seal with a blue check mark, all within a blue ring; framing is centred and unboxed apart from the ring.
Slide 8
Cost per ton / Total cost / CAPEX / OPEX / Overhead / COGS / Tons of CDR produced / Net CO2 stored, accounting for all losses and grey emissions
Visuals: Diagram (the graphic is a raster image of 1437 by 700 pixels, placed without crop or border and spanning x 7.7 to 88.9 percent and y 10.9 to 81.3 percent). Left tree: teal box 'Total cost' with a line icon of a price tag with a blue leaf; grey elbow bracket lines (#BFBFBF, about 2 px) drop from the tag to three labels CAPEX, OPEX and Overhead. Under CAPEX is a black-outlined factory icon with a blue (#3A8FD9) window band and three small dots. Under OPEX is an icon of a rounded document with two lines and a blue gear. Under Overhead is a black-outlined pencil with a blue stripe. Below CAPEX and OPEX a grey bracket joins them to a yellow box labelled COGS. Right tree: light-blue box 'Tons of CDR produced' with a line icon of a stacked block with black dots and blue vertical lines; a grey bracket drops to a dome-shaped icon with a blue hexagon and a blue downward hollow arrow below it, next to the text 'Net CO2 stored, accounting for all losses and grey emissions'. A thick grey (#8C8C8C, about 4 px) diagonal line runs from upper right (about x 58.5 percent, y 25.8 percent) to lower left (about x 43.5 percent, y 84 percent), dividing the slide.
Slide 9
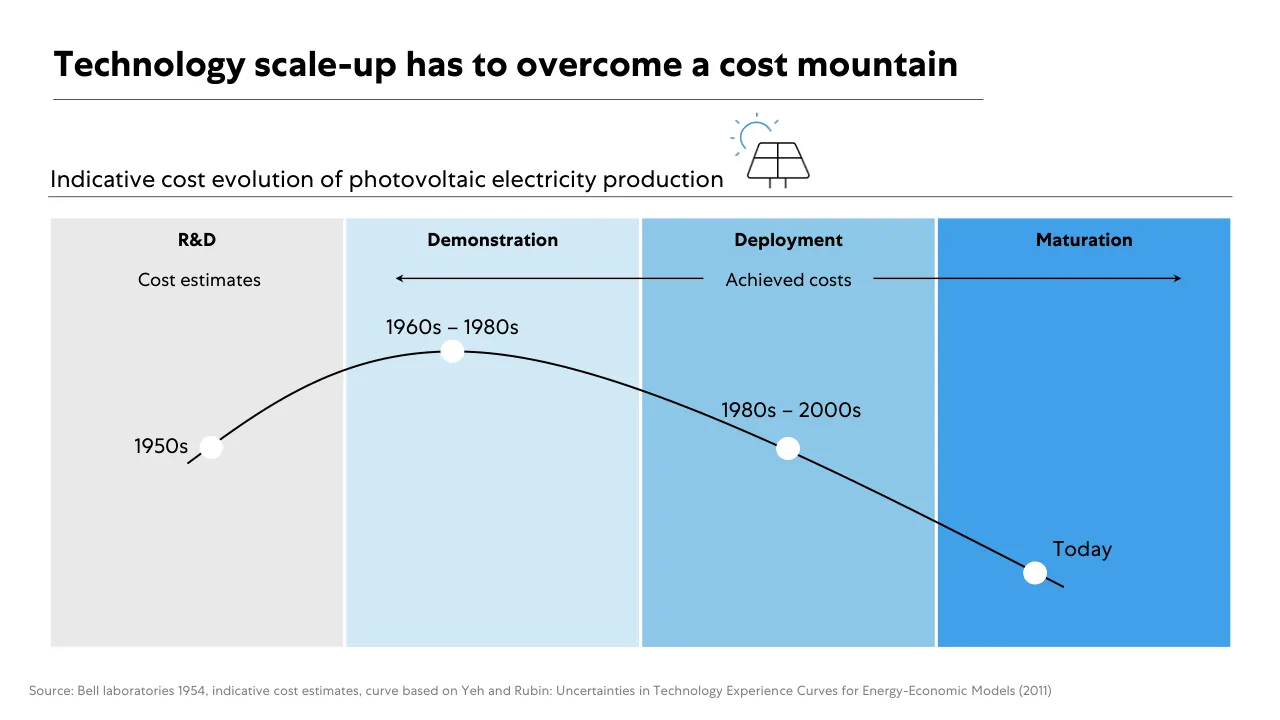
Technology scale-up has to overcome a cost mountain / Indicative cost evolution of photovoltaic electricity production / R&D / Demonstration / Deployment / Maturation / Cost estimates / Achieved costs / 1960s – 1980s / 1980s – 2000s / 1950s / Today / Source: Bell laboratories 1954, indicative cost estimates, curve based on Yeh and Rubin: Uncertainties in Technology Experience Curves for Energy-Economic Models (2011)
Visuals: Diagram over four columns: a black hill-shaped curve (cost mountain) starting low in the R&D column near 1950s, rising to a peak in the Demonstration column at 1960s – 1980s, then falling through Deployment at 1980s – 2000s and ending low in Maturation at Today. Four white filled circular markers (about 1.8 by 3.2 percent) sit on the curve at the 1950s, 1960s – 1980s, 1980s – 2000s and Today points. A horizontal black double-headed arrow across the Demonstration, Deployment and Maturation columns at about y 38.5 has the label Achieved costs interrupted by a light-blue box in the middle; the left arrowhead points left and the right arrowhead points right. The 'Cost estimates' label sits above the R&D column. The icon is a line-drawn photovoltaic solar panel: a trapezoid black outline with a cross-shaped grid of four cells, on a thin blue sun arc with short radiating dashes, drawn in black and light blue on a white background with no fill. No values, axes, legend or units are printed.
Slide 10
2023 indicative portfolio / In collaboration with / Bain & Company / WORLD ECONOMIC FORUM / The Voluntary Carbon Market: Climate Finance at an Inflection Point / BRIEFING PAPER / JANUARY 2023 / 40% / 20% / 40% / Nature-based avoidance / Nature-based removal / Engineered removal / 20% / of engineered removals / Net-zero aligned portfolios / suggest ~40% engineered CDR by / 2030 / Source: Based on World Economic Forum - The Voluntary Carbon Market: Climate Finance at an Inflection Point, January 2023
Visuals: Two visuals. (1) Photograph of a book cover, boxed, not cropped, shown at about 23.4% by 58.9% of the slide with no border or shadow. The subject is a young green seedling with several leaves growing out of a pile of gold coins resting on brown soil. The background is soft green bokeh, and the lower part is warm brown. The cover carries white text and the WEF logo. Lighting is soft and natural, dominant colours are green, gold and brown, and the image is full-colour and unframed. (2) Donut chart with no axes, titled by the slide heading. Outer ring about 26% of slide width, centred near 45% across and 56% down, with an inner hole about half the outer diameter. Series, all shown as percentage shares summing to 100%: Nature-based avoidance 40% in #67AEA2 (upper-left segment, label 40% in #404040), Nature-based removal 40% in #027864 (lower segment, label 40% in #404040), Engineered removal 20% in #419FE7 (right segment, label 20% in #404040). Segments are separated by thin white gaps. Legend below the chart lists the three series with colour swatches in the order avoidance, removal, engineered. Highlighted point: the 20% engineered removal segment is linked by a black leader line to the right-hand callout.