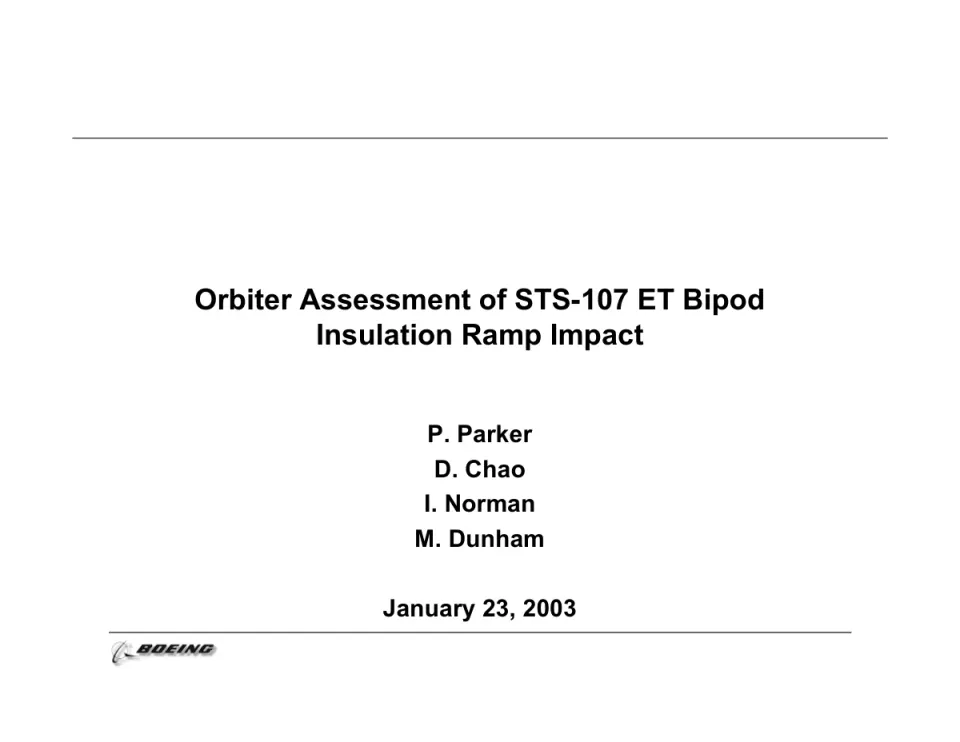
This technical briefing, dated January 23, 2003, was prepared by Boeing engineers P. Parker, D. Chao, I. Norman and M. Dunham. It assesses whether debris from the external tank bipod ramp insulation could damage the Space Shuttle Orbiter's thermal protection tiles and reinforced carbon-carbon leading edge panels during STS-107 ascent. The deck opens with a title slide and an order of analysis covering the Crater damage tool, thermal analysis and structural assessment. Middle sections match system integration inputs to critical tile and RCC locations, show tile thickness, present Crater damage results in a table, and review test data suggesting the tool was conservative for tile penetration. Later slides compare the case with the similar STS-50 impact, show predicted RCC damage at varying incidence angles, map the impacted lower surface, tabulate thermal predictions for six cases, and describe structural conditions for an intact contingency landing. The deck closes with a summary and conclusion that makes safe return contingent on the multiple tile loss thermal analysis.
The hosted copy of this deck is being prepared. Newsletter readers will find the download here.
Full text of the slides (13 slides)
Every slide's words and a description of its charts and images, so the deck can be searched and rebuilt. Also available as Markdown.
Slide 1
Orbiter Assessment of STS-107 ET Bipod / Insulation Ramp Impact / P. Parker / D. Chao / I. Norman / M. Dunham / January 23, 2003 / BOEING
Visuals: Boeing logo at bottom left: a stylised swoosh globe mark followed by the bold italic wordmark 'BOEING' in black/dark grey, roughly 11% of slide width. Two horizontal black rules: top rule about 1 px thick spanning roughly 7% to 93% width at about 17% height; lower rule spanning roughly 11% to 89% width at about 85% height.
Slide 2
Order of Analysis
Orbiter assessment of ascent debris damage includes
Evaluation of potential for debris to damage tile and RCC
Program “Crater” is official evaluation tool
Available test data for SOFI on tile was reviewed
No SOFI on RCC test data available
Even for worst case, SIP and densified tile layer will remain when SOFI is impactor
Thermal analysis of areas with damaged tiles
Thermal analysis will predict potential tile erosion and temperatures on structure
Structural assessment based on thermal environment defined above
Basis is previous Micrometeriod and Orbital Debris (M/OD) study performed in 1996
2/21/03
2
Visuals: Boeing logo at bottom left: a stylised black swoosh/globe mark with the word BOEING in bold italic black capitals, slightly grey-shaded, roughly 11% of slide width. Two thin black horizontal rules (title rule and footer rule). No charts, photos or illustrations.
Slide 3
System Integration Inputs Were Matched Against / Orbiter Tile/RCC to Determine Critical Locations
LI-900/9pcf=Black
FRCI-12/12pcf=White
LI-2200/22pcf=Brown
RCC Not Shown
Y0 = 220
Y0 = 150
X0 = 1020
X0 = 1200
A
B
C
D
E
F
Std Mode
120 Gap Fillers
2/21/03
3
Visuals: Screenshot-style diagram of an orbiter tile/RCC area in greyscale. It shows a cross-hatched black and white tile pattern in a diamond grid, with a light grey curved leading edge rising from lower left to upper right and a grey toolbar strip at the bottom with the text Std Mode and 120 Gap Fillers. A grey rectangle outlines a region labelled with letters B and F, and a grey bracket on the left labelled E connects to tile C. Dimension markers: two black vertical tick marks with labels X0 = 1020 and X0 = 1200 at the bottom, and two horizontal black leader lines labelled Y0 = 220 and Y0 = 150 at the right. Letters A to F are in white boxes with black bold serif text placed over the tiles. The Boeing logo appears at bottom left.
Slide 4
Tile Thickness
2/21/03
4
Visuals: One rectangular frame with a thick black stroke (about 5 px on a 2000 px wide render) and no fill, enclosing a large dark grey (#3A3A3A) X made of two straight bars crossing at the centre. The bars have square, flat-cut ends and are of equal thickness (about 52 px), with the X centred inside the frame. The X has no label or caption. No photograph, chart or diagram. Logo: the Boeing logo at lower left, a grey globe-like swoosh emblem beside the bold italic black wordmark BOEING.
Slide 5
Damage Results From “Crater” Equations Show
Significant Tile Damage
“Crater” indicates that multiple tiles would be taken down to
densified layer
However, program was designed to be conservative due to large
number of unknowns
Crater reports damage for test conditions that show no damage
Tile Information | Location | Impactor | Calculated Damage
Type | Thickness | Letter | X | Y | Angle | Velocity | Depth | Length | Width
9 lb | 2.6 - 2.8 | A | 1060 | 190 | 13 | 720 | 4.7 | 25.8 | 7.2
22 lb | 2.6 - 2.8 | A | 1060 | 190 | 13 | 720 | 3.2 | 25.8 | 7.2
9 lb | 2.3 - 2.4 | B | 1090 | 180 | 6 | 700 | 2.8 | 31.9 | 7.2
9 lb | 2.0 - 2.4 | C | 1036 | 150 | 8 | 680 | 3.3 | 29.8 | 7.2
22 lb | 2.0 - 2.4 | C | 1036 | 150 | 8 | 680 | 2.3 | 28.6 | 7.2
9 lb | 1.9 - 2.0 | D | 1075 | 150 | 8 | 710 | 3.4 | 32.2 | 7.2
12 lb | 2.8 -3.1 | E | 1029 | 177 | 10 | 680 | 2.9 | 19.0 | 2.4
22 lb | 2.8 -3.1 | E | 1029 | 177 | 10 | 680 | 2.6 | 19.0 | 2.4
9 lb | 1.7 | F | 1184 | 182 | 6 | 730 | 2.8 | 32.8 | 2.4
Damage data and tile thickness are given in inches.
Debris Size = 20” x 16” x 6”
(Density = 2.4 lb/ft³)
2/21/03
5
Visuals: Table: 4 column groups and 10 columns, with two header rows. Group headers: Tile Information (Type, Thickness); Location (Letter, X, Y); Impactor (Angle, Velocity); Calculated Damage (Depth, Length, Width). Nine data rows: 9 lb/2.6 - 2.8/A/1060/190/13/720/4.7/25.8/7.2; 22 lb/2.6 - 2.8/A/1060/190/13/720/3.2/25.8/7.2; 9 lb/2.3 - 2.4/B/1090/180/6/700/2.8/31.9/7.2; 9 lb/2.0 - 2.4/C/1036/150/8/680/3.3/29.8/7.2; 22 lb/2.0 - 2.4/C/1036/150/8/680/2.3/28.6/7.2; 9 lb/1.9 - 2.0/D/1075/150/8/710/3.4/32.2/7.2; 12 lb/2.8 -3.1/E/1029/177/10/680/2.9/19.0/2.4; 22 lb/2.8 -3.1/E/1029/177/10/680/2.6/19.0/2.4; 9 lb/1.7/F/1184/182/6/730/2.8/32.8/2.4. Black thin cell rules with heavier outer border. Diagram: a rectangular outline with a thin dashed vertical line at five evenly spaced divisions; a curved thin black line runs from the top-left corner down to the bottom centre and back up to the top-right corner, forming a concave bowl; three small parallelogram debris pieces sit at the top-left, and a large white block arrow with black outline points diagonally down-right onto the bowl surface. Line-art only, no fills except white. Boeing logo at lower left: the italic black wordmark with a stylised swoosh emblem, grey-shaded.
Slide 6
Review of Test Data Indicates Conservatism for Tile Penetration
The existing SOFI on tile test data used to create Crater was reviewed along with STS-87 Southwest Research data
Crater overpredicted penetration of tile coating significantly
Initial penetration to described by normal velocity
Varies with volume/mass of projectile (e.g., 200ft/sec for 3cu. In)
Significant energy is required for the softer SOFI particle to penetrate the relatively hard tile coating
Test results do show that it is possible at sufficient mass and velocity
Conversely, once tile is penetrated SOFI can cause significant damage
Minor variations in total energy (above penetration level) can cause significant tile damage
Flight condition is significantly outside of test database
Volume of ramp is 1920cu in vs 3 cu in for test
2/21/03
6
Slide 7
(Potentially) Similar STS-50 Impact Demonstrates
that Damage is Possible
• Damage to aft lower tile (0.5”d x 9”L x 4” W) on wing was found after STS-50 landing;
wheel well camera also observed missing ET bipod ramp insulation similar in size
• Small variation in energy input could substantially increase damage
• Incidence angle for STS-107 is predicted higher than STS-50
Volume = 1920in3
Vadj / Flt / damage / Normal
L (in) / d (in) / V (ft/sec) / Angle / (in/sec) / Damage / (depth) / Energy
20 / 6 / 700 / 3.2 / 69 / 0.50 / 0.53 / 100% / STS-50 (estimated conditions)
20 / 6 / 770 / 3.2 / 116 / 0.75 / 121% / STS-50 plus 10% velocity
20 / 6 / 700 / 5.2 / 361 / 1.60 / 264% / STS-50 plus 2 deg incidence angle
20 / 6 / 600 / 3.2 / 2 / 0.05 / 73% / STS-50 "threshold"
20 / 6 / 720 / 10 / 1100 / 3.37 / 1024% / STS-107
20 / 6 / 788 / 10 / 1243 / 3.66 / 1228% / STS-107 + 10% energy
20 / 6 / 914 / 10 / 1505 / 4.16 / 1650% / STS-107 + 50% energy
20 / 6 / 720 / 10 / 700 / 2.49 / 551% / STS-107 with V* = 800
density / density / Strength
V* / C / (SOFI) / (tile) / (tile)
400 / 0.0195 / 0.0014 / 0.0052 / 53 / 219912
Volume / V* (in/sec) / Ratio / power / V* (ft/sec)
0.11 / 6500 / 1.0 / 3.5 / 542 / test
0.33 / 4500 / 0.8 / 375 / test
1.00 / 3200 / 0.8 / 267 / test
3.00 / 2500 / 1.0 / 208 / test
1920 / 400 / 1.0 / 33 / flight
Volume vs V* (velocity to penetrate tile coating)
2/21/03
7
Visuals: A data table of plain text rows with no fills or gridlines, Arial regular, right-aligned numeric columns. Header block row 1: 'Volume = 1920in3' at top left. Header row 2 columns: L (in), d (in), V (ft/sec), Angle, Vadj (in/sec), Flt Damage, damage (depth), Normal Energy, and an unlabelled comment column. Rows: 20/6/700/3.2 (bold)/69/0.50 (bold)/0.53/100%/STS-50 (estimated conditions); 20/6/770/3.2/116/ /0.75/121%/STS-50 plus 10% velocity; 20/6/700/5.2/361/ /1.60/264%/STS-50 plus 2 deg incidence angle; 20/6/600/3.2/2/ /0.05/73%/STS-50 threshold in quotes. A gap, then 20/6/720/10/1100/ /3.37/1024%/STS-107; 20/6/788/10/1243/ /3.66/1228%/STS-107 + 10% energy; 20/6/914/10/1505/ /4.16/1650%/STS-107 + 50% energy; 20/6/720/10/700/ /2.49/551%/STS-107 with V* = 800. Second block headers: V*, C, density (SOFI), density (tile), Strength (tile); values 400 (bold), 0.0195, 0.0014, 0.0052, 53, and 219912 at far right. Third block headers: Volume, V* (in/sec), Ratio, power, V* (ft/sec); rows 0.11/6500/1.0/3.5/542/test; 0.33/4500/0.8/ /375/test; 1.00/3200/0.8/ /267/test; 3.00/2500/1.0/ /208/test; 1920/400/1.0/ /33/flight. A thin grey outlined empty rectangle (no fill, about 0.1% stroke in #808080) sits over the V* column area to the right of the 400-level values, overlapping the table, with no content inside. Caption below the table: 'Volume vs V* (velocity to penetrate tile coating)'. The Boeing logo is a black italic wordmark with a stylised globe swoosh emblem, at bottom left.
Slide 8
RCC Predicted Damage at Incidence Angles Greater / than 15 Degrees Based on Ice Database / Impactor / Damage / Angle / Velocity (fps) / Depth (in.) / 5 / 720 / 0.11 / 10 / 720 / 0.18 / 15 / 720 / 0.23 / 20 / 720 / 0.28 / 25 / 720 / 0.33 / Debris Size = 20” x 10” x 6” / Density = 2.4 lb/ft³ / 45° angle of wing was taken into account / Nominal panel thickness is 0.233 in. / RCC is clearly capable of withstanding impacts of at least 15 degrees; relative softness of SOFI (compared to ice) would indicate greater capability / • Maximum reported angle of 21 degrees is not an problem / •Looking at using Window ice and RTV data as an analog / 2/21/03 / 8
Visuals: One table with a bold black outer border of about 3 px and thin black inner rules. Header row 1: a merged cell spanning columns 1-2 labelled 'Impactor' and a cell labelled 'Damage' in column 3. Header row 2: 'Angle' (column 1), 'Velocity (fps)' (column 2), 'Depth (in.)' (column 3). Data rows (Angle, Velocity fps, Damage depth in.): 5, 720, 0.11; 10, 720, 0.18; 15, 720, 0.23; 20, 720, 0.28; 25, 720, 0.33. Column widths are roughly equal, column 1 about 30%, column 2 about 35%, column 3 about 35% of table width. Plus one small Boeing logo at bottom left: the blue-grey swoosh mark with black italic bold capitals 'BOEING' in a grey-shaded style. No photographs or charts.
Slide 9
Thermal Analysis Assessment of Debris Impacted / Lower Surface in STS-107 Mission Locations / 1. Lower Access Panel one tile missing / 2. RCC Coating loss / Predicted Impact Area / 3. Main Landing Gear Door / one tile missing / 4. Lower Wing Area one tile missing / 5. Lower Wing Area damage area / 32 x 7.2 x 2.8 inch / 2/21/03 / 9
Visuals: Black-and-white line-art cross-section illustration of a Space Shuttle lower surface, drawn as a sloped wing-body surface on a white background, with a dense cross-hatched tile pattern. The left portion shows a flat, lower-left region with a row of small tiles along its top edge. The surface rises diagonally from lower-left to upper-right to the top edge of the illustration. A heavy black outline traces a rectangular region (main landing gear door) with a smaller inner rectangle outlined inside it. A large black arrow points from the 'Predicted Impact Area' box toward the lower-left corner of the gear door outline. A thin black arrow points from the label '1. Lower Access Panel' area to the sloped outline near the top of the gear door. A black arrow runs from the upper-right callout box down-left to a small grey dotted ellipse on the surface, marking the lower wing damage area. Dominant colours are black and white with grey hatching. The illustration is not cropped and is not boxed, and has no overlay or tint.
Slide 10
Impacted Lower Surface Location Thermal Predictions
Case
Location
Assumptions
Results
1
Access Panel
(one tile missing)
Loss to last layer of TMM Densified layer
~ .2 inches
Temperature of Al Tube
Carrier 790 °F
No issue
2
RCC Panel 9 Lower Flange OML
(Coating Missing)
Coating loss and Carbon substrate
exposed
Substrate thickness: 0.193
inches
Loss .09 inches
No issue
3
Main Landing Gear Door
( one tile missing)
Loss to last 2 layers of TMM Densified
layer
~ .4 inches
Temperature of Structure
540 °F
No issue
4
Lower Wing Area
(one tile missing)
Loss to last 2 layers of TMM Densified
layer
~ .4 inches
Temperature below 350 °F
design req.
No issue
5
Lower Wing Area
(32 x 7.2 x 2.8 inch) Damage
Loss to last layers of TMM Densified
layer
~ .2 inches
6
Main Landing Gear Door
( several tiles Lost)
Loss to last layers of TMM Densified
layer
~ .2 inches
2/21/03
10
Visuals: Table with four columns: Case, Location, Assumptions, Results. Header row: Case; Location; Assumptions; Results. Row 1: Case 1; Location Access Panel (one tile missing); Assumptions Loss to last layer of TMM Densified layer ~ .2 inches; Results Temperature of Al Tube Carrier 790 °F, No issue. Row 2: Case 2; Location RCC Panel 9 Lower Flange OML (Coating Missing); Assumptions Coating loss and Carbon substrate exposed; Results Substrate thickness: 0.193 inches, Loss .09 inches, No issue. Row 3: Case 3; Location Main Landing Gear Door ( one tile missing); Assumptions Loss to last 2 layers of TMM Densified layer ~ .4 inches; Results Temperature of Structure 540 °F, No issue. Row 4: Case 4; Location Lower Wing Area (one tile missing); Assumptions Loss to last 2 layers of TMM Densified layer ~ .4 inches; Results Temperature below 350 °F design req., No issue. Row 5: Case 5; Location Lower Wing Area (32 x 7.2 x 2.8 inch) Damage; Assumptions Loss to last layers of TMM Densified layer ~ .2 inches; Results empty. Row 6: Case 6; Location Main Landing Gear Door ( several tiles Lost); Assumptions Loss to last layers of TMM Densified layer ~ .2 inches; Results empty. Boeing logo in the footer at bottom left, black italic bold wordmark with a stylised swoosh mark, grey-black.
Slide 11
Structural Assessment Provides for Intact / Contingency Landing with Damaged Tiles
Criteria for M/OD study were to assess on-orbit risk that / cannot be controlled
Study allowed for significant degradation beyond design / criteria
Structural temperatures well beyond 350F design (due / to loss of tile)
Repair of structure required
Small holes in structure, allowing internal plasma flow, / were permissible if not in critical area
Not expected for STS-107
Factor of Safety not maintained for design conditions
Critical subsystems were included in evaluation
Wing has few subsytems except in landing gear box and / elevon cove
Wing spars are considered critical structures
Conditions identified to ensure intact contingency landing
2/21/03
11
Visuals: One Boeing logo at bottom left: a stylised swoosh-like globe mark followed by the bold italic wordmark BOEING in black and grey gradient tones. No photographs, charts or other graphics.
Slide 12
2/21/03 / 12
Visuals: One large bold X shape, centred on the slide. It is formed of two straight, equal-width diagonal bars that cross at their midpoints, with square-cut (flat-ended, horizontal) terminals at the four ends. The X spans roughly 32% to 69% of slide width and 35% to 72% of slide height. Its fill is dark charcoal #3A3A3A with no outline, shadow or gradient. Logo: the Boeing company logo at bottom left, a stylised globe-with-swoosh mark followed by the word BOEING in bold italic black capitals with a grey shadow effect.
Slide 13
Summary and Conclusion
Impact analysis (“Crater”) indicates potential for large TPS damage
Review of test data shows wide variation in impact response
RCC damage limited to coating based on soft SOFI
Thermal analysis of wing with missing tile is in work
Single tile missing shows local structural damage is possible, but no burn through
Multiple tile missing analysis is on-going
M/OD criteria used to assess structural impacts of tile loss
Allows significant temperature exceedance, even some burn through
Impact to vehicle turnaround possible, but maintains safe return capability
Conclusion
Contingent on multiple tile loss thermal analysis showing no violation of M/OD criteria, safe return indicated even with significant tile damage
2/21/03
13
Visuals: The slide has no photographs, charts or diagrams. The only non-text visual is the Boeing logo at bottom left: a stylised swoosh emblem beside the black italic wordmark BOEING in grey-black tones.