

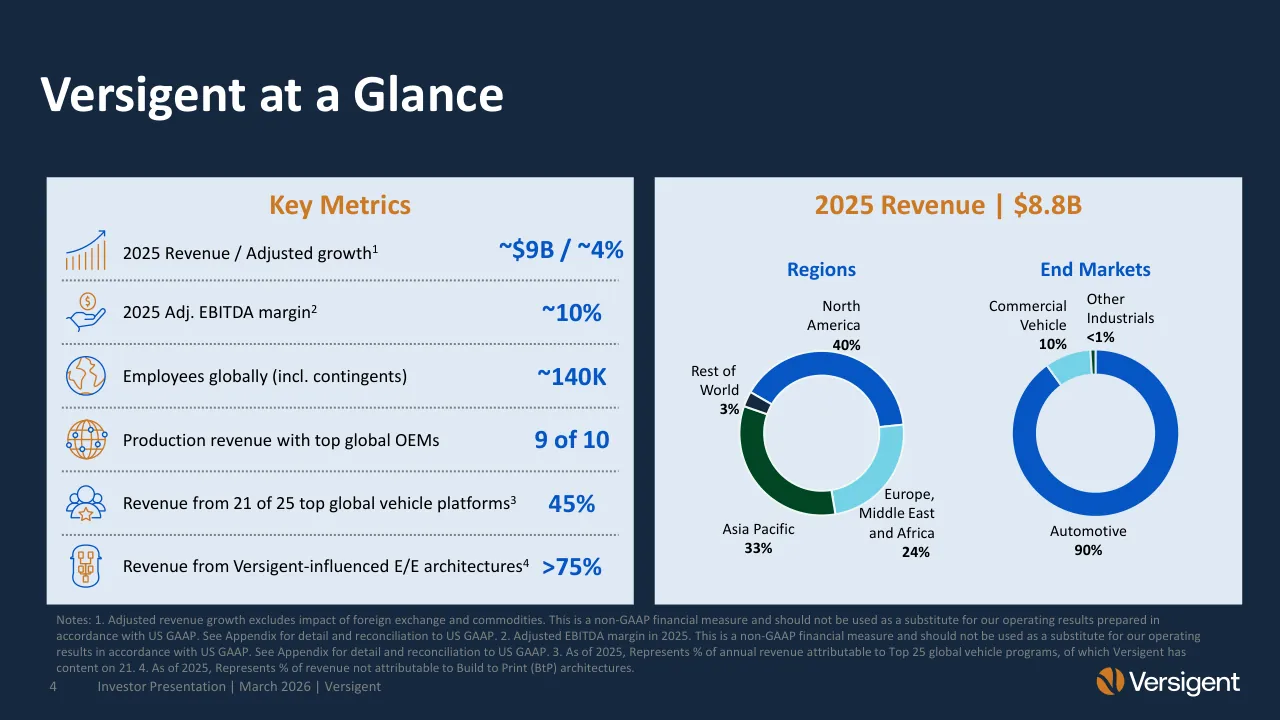
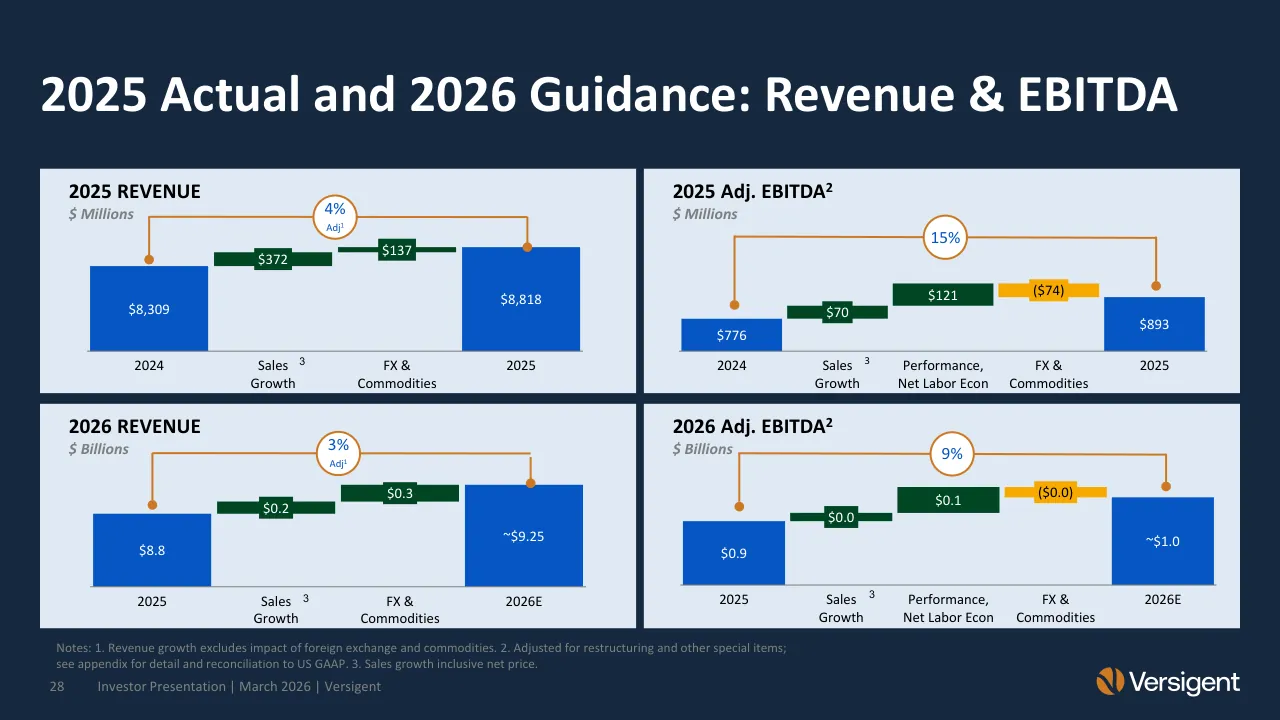
The deck opens with a title slide naming CEO Joe Liotine and CFO Doug Ostermann, followed by forward-looking statement and non-GAAP disclaimers. It then moves into a business overview with key metrics on revenue, end markets and regions, and a one-slide investment thesis. The middle sections cover the company's electrical architecture product portfolio, its proprietary engineering tool suite, the engineering and manufacturing model, and the supply chain. Next come industry dynamics, including secular trends and content-per-vehicle growth, and a financials overview with a 2026 to 2028 framework and 2026 guidance. The closing slide summarizes the value-creation case, and the appendix holds presenter bios and non-GAAP reconciliations. The deck is built around dense data callouts with footnoted sourcing, and it uses a consistent footer on every page. Several slides use a few large figures with short supporting bullets, which makes the key numbers easy to scan. The financial slides pair a revenue bridge and an EBITDA bridge, each showing the 2025 starting point and the 2026 guidance.
Slides worth studying
Questions about this deck
How many slides does the Versigent investor presentation have?
The Versigent investor presentation has 32 pages. Slide 1 is the cover and names CEO Joe Liotine and CFO Doug Ostermann, and the appendix holds presenter bios and non-GAAP reconciliations.
What revenue outlook does the Versigent deck show through 2028?
Slide 21 shows revenue of $8.8B in 2025, with a 3% adjusted CAGR and a projected 3-4% adjusted CAGR from 2025 to 2028E, reaching ~$10B in 2028E. Slide 20 summarizes the framework as a revenue CAGR of 3-4% through 2028E.
What does Versigent say about its engineering tools and engineering team?
Slide 9 states that proprietary engineering tools allow for a 50% reduction in drawing time for electrical architectures. The same slide lists ~8K highly skilled engineers, 875 engineers working hand-in-hand with customers, and ~700 patents and patent applications as of December 31, 2025.
What does the Versigent deck say about its supply chain?
Slide 10 reports 95% supplier visibility to at least Tier 3 level and that more than 95% of cable is sourced in-region. It also states that order-to-VIN specific delivery takes less than 10 days.
Details
- Company: Versigent
- Year: 2026
- Type: Investor presentation
- Industry: Automotive
- Pages: 32
Review score: 7 out of 10, Effective
Presentation quality, judged with the SlideDeck Co review heuristic. Ask, evidence and idea merit are not rated here.
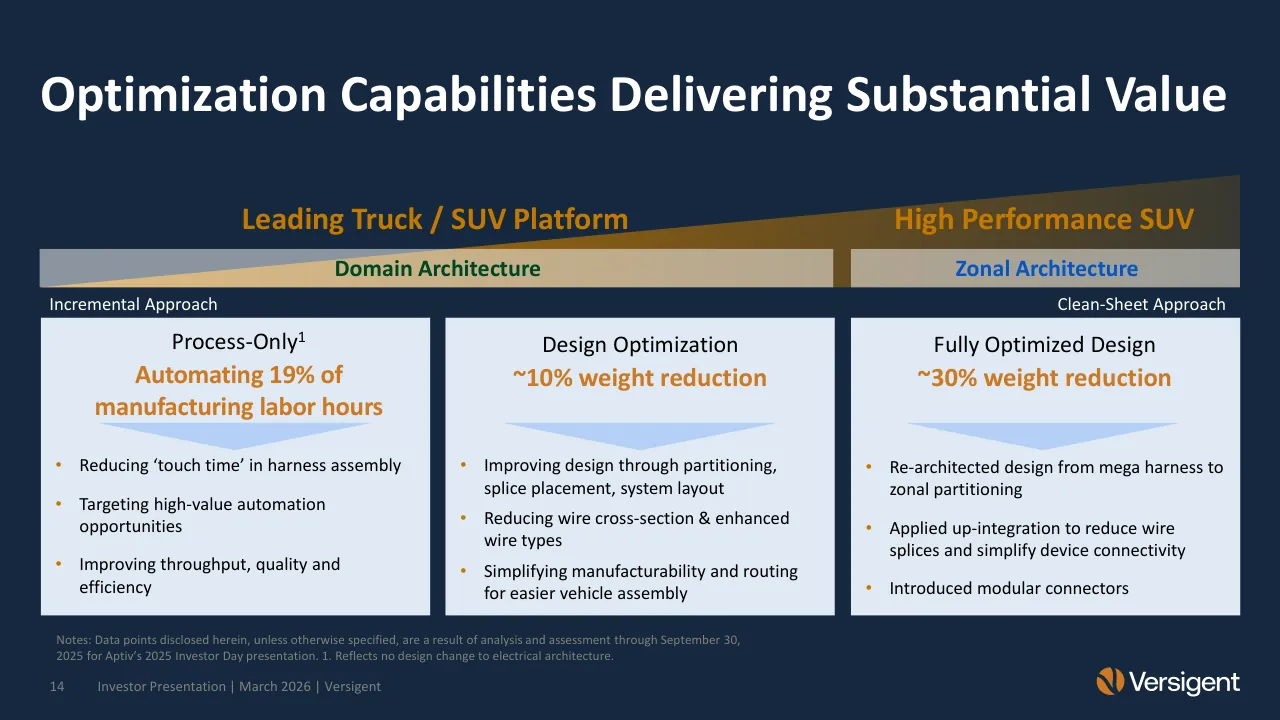
The deck has a clear route from overview and thesis through capabilities, industry dynamics and financials to a conclusion, and its visual system is consistent: navy ground, orange emphasis, light panels, and a footer on every page. Slides 4, 14 and 28 show strong hierarchy, readable key numbers and clean charts, and the bridges on slide 28 make the 2025 and 2026 story easy to follow. The main weaknesses are density and legibility on several slides: footnotes are tiny (4, 14, 28), the map slides (9, 11) have small bullet text next to big stats, and the disclaimer (2) and presenter bios (27) are walls of text. Slide 28 repeats nearly identical bridges with $0.0 labels and vague bar scaling, which weakens the chart, and the deck reads better as a read-ahead than as a projected talk.
Worth keeping: Keep the navy and orange identity, the large orange or blue key figures with short labels (slides 4, 6, 10), and the paired bridge structure on slide 28.
Most useful repair: Enlarge or cut the body text and footnotes on slides 9, 11 and 14, and fix the 2026 bridge on slide 28 so the small $0.0 steps and bar proportions read clearly.
What would change the score: Replace the several panel-and-bullet slides with fewer, more visual pages that carry one takeaway each, and move the bios and disclaimer text into smaller appendix material.
Confidence medium. 32 of 32 pages inspected on contact sheets, 4 at readable size. Reviewed 2026-11-08. Model-assisted review (claude-sonnet-5-5).
Full text of the slides (32 slides)
Every slide's words and a description of its charts and images, so the deck can be searched and rebuilt. Also available as Markdown.
Slide 1
Investor
Presentation
Joe Liotine, Chief Executive Officer
Doug Ostermann, Chief Financial Officer
MARCH 2026
Versigent
Visuals: Decorative illustration of about ten gold ribbons, each with a slight shading gradient from light gold to darker amber, sweeping from the top edge downward in an S-curve and converging into a bundle at the lower right near x 70-86%, y 75-86%. Ribbons are not cropped at the top edge, and they run off the top of the slide. Logo: Versigent logo at lower left, an orange-amber circular emblem with a stylised white-edged swoosh at about x 2.5-6.5%, y 75-86%, followed by the white wordmark 'Versigent' in a geometric sans-serif. No photograph, no chart, no table.
Slide 2
Disclaimer
Forward-Looking Statements
This presentation, as well as other statements made by the Versigent Limited (“the Company”), contain forward-looking statements that reflect, when made, the Company’s current views with respect to current events, business plans and financial performance. Such forward-looking statements are subject to many risks, uncertainties and factors relating to the Company’s operations and business environment, which may cause the actual results of the Company to be materially different from any future results. All statements that address future operating, financial or business performance or the Company’s strategies or expectations are forward-looking statements. Factors that could cause actual results to differ materially from these forward-looking statements include, but are not limited to, the following: disruptions in the supply of raw materials and other supplies integral to our products; future significant public health crises and other global health crises and the measures taken in response thereto; a prolonged recession and/or a downturn in global automotive sales; the volatile global economic environment and geopolitical conditions, including conditions affecting the credit market and global inflationary pressures; our reliance on relationships with collaborative partners and other third parties for product development and such parties’ failure to perform; employee strikes and labor-related disruptions involving us or one or more of our customers affecting our operations; fluctuations in interest rates and foreign currency exchange rates; our failure to comply with the numerous laws and regulations to which we are subject; adverse developments affecting one or more of our suppliers; any adverse impact of legal proceedings and disputes in which we are involved; challenges to our historical and future tax positions by taxing authorities; an increase in our tax burden due to ongoing or future tax audits; our failure to attract and retain key salaried employees and management personnel; our failure to complete the spin-off as planned or at all; our failure to manage the transition to a standalone public company; our failure to achieve some or all of the benefits expected from the spin-off and other risks related to the completion of the Spin-Off. Additional factors are discussed under the captions “Summary—Risk Factors,” “Risk Factors” and “Management’s Discussion and Analysis of Financial Condition and Results of Operations.” New risks and uncertainties arise from time to time, and it is impossible for us to predict these events or how they may affect the Company. It should be remembered that the price of the ordinary shares and any income from them can go down as well as up. The Company disclaims any intention or obligation to update or revise any forward-looking statements, whether as a result of new information, future events and/or otherwise, except as may be required by law.. Additional factors are discussed under the captions “Risk Factors” and “Management’s Discussion and Analysis of Financial Condition and Results of Operations” in the Company’s filings with the Securities and Exchange Commission. New risks and uncertainties arise from time to time, and it is impossible for us to predict these events or how they may affect the Company. The Company disclaims any intention or obligation to update or revise any forward-looking statements, whether as a result of new information, future events and/or otherwise, except as may be required by law.
Non-GAAP Financial Measures
This presentation contains information about the Company’s financial results which are not presented in accordance with GAAP, including adjusted revenue, adjusted EBITDA, adjusted EBITDA margin, free cash flow and free cash flow conversion. Management believes the non-GAAP financial measures used in this presentation are useful to both management and investors in their analysis of the Company’s financial position, results of operations and liquidity. In particular, management believes that each of adjusted revenue, adjusted EBITDA, adjusted EBITDA margin, free cash flow and free cash flow conversion is a useful measure in assessing the Company’s ongoing financial performance that, when reconciled to the corresponding GAAP measure, provides improved comparability between periods through the exclusion of certain items that management believes are not indicative of the Company’s core operating performance and that may obscure underlying business results and trends. Management also uses certain of these non-GAAP financial measures for internal planning and forecasting purposes. Such non-GAAP financial measures are reconciled to the most directly comparable GAAP financial measures in the attached supplemental schedules in the appendix. Non-GAAP measures should not be considered in isolation or as a substitute for our reported results prepared in accordance with GAAP and, as calculated, may not be comparable to other similarly titled measures of other companies.
2
Investor Presentation | March 2026 | Versigent
Slide 3
Business
Overview
3
Investor Presentation | March 2026 | Versigent
Visuals: Decorative illustration of about eight to ten parallel golden ribbons (gradient from light gold #E0A93B to darker amber #C07F2A) that enter from the top edge around x 50-88%, curve down and to the left in an S-shape, then fan out and terminate in angled cut ends toward the lower right around x 70-97%, y 75-86%. The ribbons have subtle shading suggesting a three-dimensional twisted band. Illustration is not cropped at the top edge; it bleeds off the top. Logo: Versigent logo at bottom right consisting of an orange-amber (#D9742B) abstract mark of two curved leaf-like strokes in a circle, followed by the white wordmark 'Versigent' in a sans-serif typeface.
Slide 4
Versigent at a Glance
Key Metrics
2025 Revenue | $8.8B
2025 Revenue / Adjusted growth¹
~$9B / ~4%
2025 Adj. EBITDA margin²
~10%
Employees globally (incl. contingents)
~140K
Production revenue with top global OEMs
9 of 10
Revenue from 21 of 25 top global vehicle platforms³
45%
Revenue from Versigent-influenced E/E architectures⁴
>75%
Regions
North America 40%
Rest of World 3%
Asia Pacific 33%
Europe, Middle East and Africa 24%
End Markets
Commercial Vehicle 10%
Other Industrials <1%
Automotive 90%
Notes: 1. Adjusted revenue growth excludes impact of foreign exchange and commodities. This is a non-GAAP financial measure and should not be used as a substitute for our operating results prepared in
accordance with US GAAP. See Appendix for detail and reconciliation to US GAAP. 2. Adjusted EBITDA margin in 2025. This is a non-GAAP financial measure and should not be used as a substitute for our operating
results in accordance with US GAAP. See Appendix for detail and reconciliation to US GAAP. 3. As of 2025, Represents % of annual revenue attributable to Top 25 global vehicle programs, of which Versigent has
content on 21. 4. As of 2025, Represents % of revenue not attributable to Build to Print (BtP) architectures.
4
Investor Presentation | March 2026 | Versigent
Versigent
Visuals: Left panel: six rows, each with a line icon at left, a black label and a bold blue value at right, separated by five grey dotted horizontal rules. Icons in order: an orange rising bar chart with an upward arrow (2025 Revenue); a blue hand holding an orange coin with a dollar sign (EBITDA margin); a blue globe outline with orange continents (Employees); an orange globe with a network of blue nodes (Production revenue with OEMs); blue people silhouettes with an orange star (vehicle platforms); a blue outline of a control unit with an orange block network (E/E architectures). Right panel: two donut charts with no axes, no legend box, and no title other than the headings Regions and End Markets. Regions donut, segments clockwise from the top: North America 40 percent in #0857C3 (top and right upper arc), Europe, Middle East and Africa 24 percent in light cyan #74D2E7 (right lower arc), Asia Pacific 33 percent in dark green #004624 (lower left arc), Rest of World 3 percent in dark navy #16283F (small wedge at upper left). Each segment is separated by a thin white gap. End Markets donut, clockwise from the top: Automotive 90 percent in #0857C3 (large arc), Commercial Vehicle 10 percent in #74D2E7 (upper left arc), Other Industrials under 1 percent in dark green #004624 (thin sliver at the top). Labels sit outside each ring with their percentages in bold beneath the names. No values are estimated; all are printed. No highlighted points.
Slide 5
Versigent Investment Thesis
Secular trends driving demands for higher speed, data, and power distribution across vehicles
Differentiated as a full-service solutions provider for OEMs across comprehensive product portfolio
Industry-leading scale in automotive with rigorous and best-in-class operating model
Opportunity for product and end market expansion
Resulting in attractive financial profile and opportunity for accretive capital deployment
5
Investor Presentation | March 2026 | Versigent
Visuals: Five identical light-blue circles in a vertical column, each holding a single-colour line icon. Icon 1 (top): blue rising trend line with a dot-circle and an orange tag shape at lower right, suggesting search and growth. Icon 2: stack of three blue chevron-outlined layers with an orange top layer. Icon 3: blue gear with orange arrows pointing outward in all eight directions. Icon 4: orange circular arrows around a blue gear containing a blue checkmark. Icon 5: blue upward arrow rising across orange vertical bars of increasing height. A thin orange bracket line with small orange round dots at each icon's left edge connects the five circles. The Versigent logo at bottom right: orange stylised V-shaped mark with white wordmark 'Versigent'.
Slide 6
Tier 1 Electrical Architecture Provider of Choice
Product Portfolio
Low Voltage (LV) Electrical Architectures
Systems for signal, power, and data distribution
Custom copper and aluminum cables for tailored requirements
Solutions optimized for weight, cost and performance
High Voltage (HV) Electrical Architectures
Systems & cables for HV power distribution for xEV propulsion
Cables & HV cord sets supporting efficient, high-performance charging
Designed for global compliance and scalable manufacturing
Key Stats
On 1 of every 6 vehicles globally
Supporting >50 customers
On 1 of every 3 BEVs
Across 550 global vehicle programs1
On 9 of top 10 global vehicle platforms
With >1,900 project launches2 per year
Notes: Data points disclosed herein, unless otherwise specified, are a result of analysis and assessment through September 30, 2025 for Aptiv’s 2025 Investor Day presentation. 1. Defined as a unique Versigent program, more comparable to vehicle models than OEM programs. Global program accounted for as a vehicle model sold across geographic regions. For example, one vehicle model manufactured/sold in NA, EMEA, and APAC counted as one program, rather than three. 2. Project represents a unique wiring harness board code. A typical vehicle program has multiple Versigent projects.
6
Investor Presentation | March 2026 | Versigent
Versigent
Visuals: A gradient chevron arrow pointing right, centred vertically between the two columns at x 48.5% to 51.4%, y 43.7% to 71.3%; it fades from dark navy at its left edge to orange #CD7925 at its point, with no outline. Six light-blue stat tiles in a 2 by 3 grid with no icons, charts or photographs; the numbers 1, 6, 1, 3, 550, 9, 10 and >50 and >1,900 are set in bold orange. Versigent logo at bottom right: an orange swirl icon followed by the white wordmark Versigent. No photographs, charts or tables.
Slide 7
Differentiated by Full-Service Solutions Offering
Influence to design out commoditized content and design in value-add content for customers and Versigent
1
2
3
Comprehensive Portfolio
Design Optimization
Global Manufacturing & Supply Chain Resiliency
Design innovation leader with ~700 patents and protective rights1
Over 50 patents and applications on assembly line automation1
Strong portfolio ranging from distributed architectures to domain and zonal optimized architectures
Early and close collaboration with customers to understand and align with vehicle / platform needs
Proprietary software for electrical architecture development and drawing, enabling customization, automation, and digital integration
Proprietary in-house manufacturing automation processes to improve quality, cost, and throughput
Digital tools, external intelligence and in-house expertise to strengthen supply chain resiliency
Note: 1. As of December 31, 2025.
7
Investor Presentation | March 2026 | Versigent
Visuals: Three line icons in orange outline on the cards: (1) a car chassis or platform outline with internal architecture blocks, inside a rounded pill-shaped outline, at about x 4.2 y 47.1 w 6.7 h 6.7; (2) a rolled blueprint with a pencil drawing a grid of rectangles, at about x 34.3 y 47.1 w 4.4 h 6.7; (3) a globe with a small gear overlapping its lower right, at about x 63.9 y 46.9 w 3.9 h 6.8. Three numbered circle nodes (1, 2, 3) with thin orange outlines sit on a horizontal orange timeline that runs left to right, bends down at the right into a lower horizontal segment that exits the right edge. Small orange vertical connectors drop from each node to an orange dot on the top edge of its card. Orange Versigent logo mark (a stylised split circle) with white wordmark at bottom right.
Slide 8
Proprietary Tool Suite a Competitive Differentiator / HARNESS / Pillars / 1 / 2 / 3 / 4 / Translation / Design / Build / Integration / iCustomer Data Translator / Seamless data transfer from OEM systems into standardized format processable in Versigent tool suite / Product Engineering / Import of translated design elements into standard format allowing design completion and verification on one intuitive interface / Manufacturing Engineering / Exports released drawing from design to manufacturing; carries out rule checks; creates board drawing and wire kits; produces work introductions; generates digital twin of manufactured harness / Velocity Container Analyzer / Viewer tool to visualize (2D and 3D) electrical architectural design, including features to integrate design changes improving productivity, quality, and timing / 8 / Investor Presentation | March 2026 | Versigent / Versigent
Visuals: Four boxed screenshot images of software, each with a thin orange border and a dark translucent navy tint over it, dimming the image. Card 1 (Translation): a dark-grey software window with a long grey and white banded area at top, a tree panel and a file list at the bottom, dominant grey-blue. Card 2 (Design): a dark navy CAD-style electrical schematic with blue component blocks and thin light-blue connecting wires. Card 3 (Build): a dark software screen with rows of small grid tables and a tree panel at right, mostly grey and navy. Card 4 (Integration): a desaturated photograph of a laptop on a desk, screen showing a wire-harness trace in purple and blue lines, a hand at the left edge, cropped to the card and tinted dark. Timeline: a thin orange horizontal line (about 1.5 pt) passing behind four orange-outlined circles numbered 1 to 4, with orange vertical connector lines and small orange dots at each card's top edge; the line curves down to the right edge after circle 4. HARNESS logo: a white rectangle with a black HARNESS wordmark and a red dot above the I. Versigent logo: an orange swoosh icon followed by a white wordmark.
Slide 9
Competitive Moat from Engineering Expertise
~8K
875
~700
Influential
Expertise ranging from sub-components to full systems across electrical architectures drives design influence with customers
Highly skilled engineers 1
Engineers working hand-in-hand with customers
Patents and patent applications 1
Integrated
Engineering and design heavily integrated with supply chain and manufacturing process, enabled by proprietary tools (iHarness) that automatically generate downstream workflows
Efficient
Proprietary engineering tools allow for 50% reduction in drawing time for electrical architectures, as well as improved product quality, productivity, and time through manufacturing process
Engineering Centers (6) 1
Notes: Data points disclosed herein, unless otherwise specified, are a result of analysis and assessment through September 30, 2025 for Aptiv's 2025 Investor Day presentation. 1. As of December 31, 2025.
9
Investor Presentation | March 2026 | Versigent
Visuals: A world map illustration drawn as a flat silhouette in #213C5F on the #16283F background, spanning the right half from about x 41% to 96% and y 25% to 89%, with no outline and no shading. Six small light-blue (#6FD3EA approximately) filled circles mark Engineering Centers (6): five on the map and one in the legend. Map dots at about x 48.7 y 59.2, x 51.1 y 62.4, x 52.2 y 63.3 (west North America), x 66.6 y 60.6 (Iberia), x 70.8 y 57.6 (Central Europe), x 85.6 y 62.4 (East Asia), each about 1.2% of slide width in diameter. Legend dot at about x 42 y 77.3. Statistics are text, not charts; no other visuals. The Versigent logo is an orange swirl mark followed by the white wordmark Versigent.
Slide 10
Supported by a Resilient Supply Chain
95%
Supplier visibility to at
least Tier 3 level
>95%
Cable sourced in-region
~99%
Cable value chain mapped
down to copper source
Integrated
• Rapid order-to-delivery of complex and unique architectures powered by advanced lean tools and adaptive planning with customers and supply base
Localized
• In-region, for-region supply chain balancing necessary proximity to customers with just-in-time product model with a cost-effective footprint
Resilient
• Extensive supply traceability down to sub-tier level through digital twin ensuring supply continuity and risk mitigation
Example KSK Program
• 1 of ~1,000 unique electrical architecture variations for 1 vehicle model
• Order to VIN specific delivery = <10 days
• Manufacturing time = 2 days for multiple harnesses on program
• Manufactured in best cost country, then shipped to warehouse located near OEM
Serbia ✈ Germany
2.5 days of shipping
Germany
Customer collects from
warehouse
Serbia
2 days to manufacture
Notes: Data points disclosed herein, unless otherwise specified, are a result of analysis and assessment through
September 30, 2025 for Aptiv's 2025 Investor Day presentation.
10
Investor Presentation | March 2026 | Versigent
Visuals: A faded world map silhouette in #213C5F fills the right two-thirds of the slide behind the statistics and the Example KSK Program list, with light grey landmass outlines at low contrast. Three large orange statistics: 95% (supplier visibility to at least Tier 3 level), >95% (cable sourced in-region), ~99% (cable value chain mapped down to copper source). A boxed inset map of Europe (#D9D9D9 countries at 20% opacity over a dark slate box with a teal-grey border) shows Germany highlighted in blue #0857C3 and Serbia highlighted in blue #0857C3. A dashed dark-green curved arrow runs from Serbia to Germany with a dark green dot at Germany (with arrowhead pointing into Germany) and a dark green dot at Serbia. An airplane glyph (Wingdings) sits between the labels Serbia and Germany on the upper-right of the inset. A dotted teal-grey rectangle outline on the world map marks the inset's zoom area, connected by a dotted line to the inset's top edge. The light left panel #DFE9F4 contains only text. The Versigent logo: an orange #CD7925 stylised swirl mark followed by the white wordmark Versigent, at lower right.
Slide 11
Unparalleled Global Manufacturing Scale
Integrated Development to Delivery
•Offering customers flexible solutions with agile and responsive / operations, optimizing for both performance and cost, as well / as quality and on-time delivery
Expertise Managing Complexity
•Flexibility enabling 45K engineering change requests from / customers, resulting in over 40M electrical architecture changes / per year
•Powerful manufacturing allowing near build-to-order capability / for billions of customer combinations
Global Scale with Regional Model
•Production model maintaining footprint in key regions via best / cost countries and mitigating disruption from evolving global / trade policy and exposure to tariffs
•Increasing level of automation in manufacturing processes, / improving cost and quality
>95%
of manufacturing / workforce in best cost / countries
99.9%
Quality¹
99.9%
On-time delivery²
• Manufacturing Facilities (59)³
Notes: Data points disclosed herein, unless otherwise specified, are a result of analysis and assessment through September / 30, 2025 for Aptiv’s 2025 Investor Day presentation. 1. Measured as inverse of PPM – Parts per Million. 2. Measured as / inverse of IPM – Incidents per Million. 3. As of December 31, 2025.
11
Investor Presentation | March 2026 | Versigent
Visuals: Stylised world map silhouette in dark blue #213C5F spanning about 41% to 96% of width and 25% to 89% of height, sitting on the navy background with no outline. About 59 small light-blue (#62CFEF) solid dots mark manufacturing facilities: a cluster of about 12 over western North America / Mexico, a few over Western Europe and the Mediterranean, a cluster of about 6 over Central / Eastern Europe, about 3 over Western Africa / Iberia, a cluster over the Indian subcontinent (about 6), a dot cluster of about 15 over Eastern China, a few over Japan and Korea, two over Southeast Asia / Indonesia, and two dots at the southern tip of South America. Three large orange (#CD7925) statistics: '>95%', '99.9%' and '99.9%', each with a white caption beneath. A small light-blue dot legend marker precedes 'Manufacturing Facilities (59)' in white. Orange and white Versigent logo mark at bottom right. No photographs; no charts or tables.
Slide 12
Industry / Dynamics / 12 / Investor Presentation | March 2026 | Versigent / Versigent
Visuals: One illustration: stylised gold ribbons, about 10 to 12 parallel bands per bundle, rendered with a slight 3D twist and shading. The first bundle enters at the top edge around x 49 to 67% and curves down and to the left to converge toward the lower middle around x 60 to 75%, y 70 to 86%. The second bundle enters at the top edge around x 73 to 87%, descends in an S-curve, and fans out at its lower end around x 75 to 86%, y 62 to 86%. The two bundles cross and overlap in the centre-right area. Ribbon colour runs from gold #D9A53A to amber #C8862E, with darker orange-brown #B8702A on the shaded edges and lighter #E6B84A highlights. The image is not cropped inside its box and is blended into the navy background with no boxing, border or overlay. Lighting is soft and directional from the upper left.
Slide 13
Secular Trends Requiring More Robust Solutions
Product Requirements for
Electrical Architectures
Business Requirements for
Architecture Suppliers
Automation
Advanced Feature Enablement
Enabling shift to xEVs and higher ADAS, UX, and other
data-rich and power-intensive features
Electrification
Mission Critical
Supporting systems that require guaranteed reliability
and performance
Digitalization
Optimized Design
Enabling size, weight, power, and cost savings for
customers
End-to-End Capabilities
• Offering early engagement with customers
to understand precise needs and requirements
• Offering solutions ranging from components to full
systems that are optimized for performance and cost
Global Scale and
Resilient Supply Chain
• Providing customers with same product at same
quality for global platforms across all regions
• Localized manufacturing and resilient supply chain to
mitigate geopolitical risk and ensure consistency of supply
13
Investor Presentation | March 2026 | Versigent
Visuals: Three photographic tiles in the left column, each with a navy 60% overlay and a thin orange border, each carrying a white line icon in a white circle. (1) Automation: a worker in a yellow hard hat and dark clothing at a workbench of tools and panels, mostly dark teal and warm orange tones, with a white robot-arm line icon in a circle. (2) Electrification: a close view of hands working on red-orange electrical wiring with blurred components, warm red and brown tones, with a white power-symbol line icon in a circle. (3) Digitalization: a glowing blue circuit-line network on a dark surface with purple and cyan highlights, with a white gear and circuit line icon in a circle. Card icons in thin navy-grey and orange line style: an orange gear inside an open folder above the Advanced Feature Enablement card; a navy outlined warning triangle with an orange exclamation mark above Mission Critical; an orange circular-arrow loop around a navy gear with check mark beside Optimized Design; orange-and-navy stacked layers beside End-to-End Capabilities; an orange-outlined globe with navy continents beside Global Scale and Resilient Supply Chain. Logo: an orange swoosh mark with a white 'Versigent' wordmark at bottom right.
Slide 14
Optimization Capabilities Delivering Substantial Value
Leading Truck / SUV Platform
High Performance SUV
Domain Architecture
Zonal Architecture
Incremental Approach
Clean-Sheet Approach
Process-Only1
Automating 19% of
manufacturing labor hours
Design Optimization
~10% weight reduction
Fully Optimized Design
~30% weight reduction
• Reducing ‘touch time’ in harness assembly
• Targeting high-value automation opportunities
• Improving throughput, quality and efficiency
• Improving design through partitioning, splice placement, system layout
• Reducing wire cross-section & enhanced wire types
• Simplifying manufacturability and routing for easier vehicle assembly
• Re-architected design from mega harness to zonal partitioning
• Applied up-integration to reduce wire splices and simplify device connectivity
• Introduced modular connectors
Notes: Data points disclosed herein, unless otherwise specified, are a result of analysis and assessment through September 30, 2025 for Aptiv’s 2025 Investor Day presentation. 1. Reflects no design change to electrical architecture.
14
Investor Presentation | March 2026 | Versigent
Visuals: Three light-blue (#DFE9F4) rectangular cards, each with a small translucent light-blue (#89B9FA at 50 percent opacity) downward-pointing triangle beneath its orange headline figure: Card 1 'Process-Only1 / Automating 19% of manufacturing labor hours' with bullets, Card 2 'Design Optimization / ~10% weight reduction', Card 3 'Fully Optimized Design / ~30% weight reduction'. A wide gradient wedge (rising triangle, about 901 by 85 pixels) runs from bottom-left to top-right across the header band: amber/tan (#D9B47A) at the bottom-left fading through dark brown (#5A3A12) to charcoal (#2E2E2E) at the top-right corner, and it sits behind the 'Leading Truck / SUV Platform' and 'High Performance SUV' labels. Two translucent white (#FFFFFF at 50 percent opacity) header bars sit behind 'Domain Architecture' (left, wider) and 'Zonal Architecture' (right). Versigent logo at bottom-right: an orange (#E07B1F) stylised swirl mark with the white wordmark 'Versigent' in sans-serif. No photographs or charts.
Slide 15
Content per Vehicle Increasing with Electrification
ICE
HYBRID
BEV
MILD
FULL
PLUG-IN
1X
1.5X
1.7X
Increase in Versigent Addressable
Content per Vehicle ($ CPV)1
Versus ICE Average
Versigent Content
High voltage electrical architectures
High Voltage
Cord sets
Low voltage electrical architectures for signal, power, and data distribution
Low Voltage
Specialty cables to for custom requirements
Notes: Data points disclosed herein, unless otherwise specified, are a result of analysis and assessment through September 30, 2025 for Aptiv’s 2025 Investor Day presentation.
1. Addressable content per vehicle reflects Aptiv estimates. Calculation reflects global volume weighted average based on region, size, and price class.
15
Investor Presentation | March 2026 | Versigent
Visuals: Three line-art style car illustrations rendered as translucent light-blue wireframe vehicles showing battery packs, drive units and wiring in a 3/4 top-down view, each car boxed with no frame. Left car (ICE, under 1X): smaller compact silhouette with a small engine block and exhaust visible in the front-centre, facing right. Middle car (HYBRID, under 1.5X): similar silhouette with a mid-sized battery pack and motor visible, facing right. Right car (BEV, under 1.7X): larger rectangular battery pack spanning the floor, electric drive unit visible at the rear, facing right and overlapping the top edge of the green triangle. Lighting is flat and uniform on the dark background; the cars are pale cyan (about #8FD8E8) with low opacity. Hybrid connector line: a thin orange (#CD7925) horizontal line of about 0.2% stroke running from MILD to PLUG-IN, interrupted around the FULL label. Green wedge: a right-triangle with its hypotenuse rising from lower left to upper right, dark green fill #00723B, overlapping the BEV car base and containing the High voltage electrical architectures text. Green Cord sets bar and light-blue bars are flat rectangles with no shadow or outline. Versigent logo in bottom-right: an orange (#CD7925) stylised V-shaped mark and white wordmark 'Versigent'. Orange outlined rectangle (about 0.2% stroke, #CD7925) enclosing the rotated text Versigent Content on the left legend column.
Slide 16
Architecture Evolutions Driving Value for Versigent
Versigent Addressable Content per Vehicle ($ CPV)1
$770
$740
1%
CAGR
2025
Baseline
2030
Optimized
Drivers of Content per Vehicle Growth
Increasing levels of electrification
Increasing levels of ADAS/autonomy
Increasing content within in-cabin
Other features & functionality
Optimization driving copper content reduction
Price downs
1% NET CAGR IN CPV OVER FORECAST PERIOD
Notes: Data points disclosed herein, unless otherwise specified, are a result of analysis and assessment through September 30, 2025 for Aptiv’s 2025 Investor Day presentation. 1. Addressable content per
vehicle reflects Aptiv estimates. Calculation reflects weighted average Versigent content per vehicle based on estimates total addressable market (TAM), divided by total global vehicle production.
16
Investor Presentation | March 2026 | Versigent
Versigent
Visuals: Column chart with title 'Versigent Addressable Content per Vehicle ($ CPV)' with superscript 1. Two columns: 2025 Baseline, value $740, grey #4B545F, bar spanning about 7.6% to 19.5% horizontally and 48.5% to 73.4% vertically; 2030 Optimized, value $770, orange #CD7925, bar spanning about 28.5% to 40.4% horizontally and 43.2% to 73.4% vertically. Printed values are $740 and $770, no axis or scale is printed, and the bar heights are not labelled further. A thin white baseline runs under both columns. A white arrow with a white arrowhead runs from about (14.9%, 56.1%) up and right to about (33.3%, 48.4%) over the gap between the bars. A white-filled oval with a gold outline sits on the arrow at about 21.9% to 26.4% horizontally and 48.6% to 56.2% vertically, reading '1%' above 'CAGR' in black bold. Right-hand panel: a blue header bar reading 'Drivers of Content per Vehicle Growth'; below it a dark green panel (#00B45D at 30% opacity over navy, appearing about #0E4F40) listing four items each preceded by a white circle with a dark green plus sign; below that a dark maroon panel (#C00000 at 30% opacity, appearing about #471C2A) listing two items each preceded by a white circle with a dark red minus bar; a thin white horizontal divider at about 71% height; and an orange #CD7925 bar reading '+1% NET CAGR IN CPV OVER FORECAST PERIOD' preceded by a white circle with an orange equals sign. Logo at bottom right: an orange swirl mark with the white wordmark Versigent.
Slide 17
Automotive Capabilities Translate to Other Markets
Strategic Focus Markets
Product Requirements
Support increasing features and functions
Demonstrate mission critical reliability
Optimized design
Business Requirements
High performing, cost effective solutions
Global scale & supply chain
17
Investor Presentation | March 2026 | Versigent
Visuals: Four photographs and one gradient arrow, plus the icons in the left panel. Top right photo (full row width, about 55% to 95% of the width, 28% to 47% of the height): a white-cab semi truck with a grey trailer driving left to right on a highway, green trees behind, guardrail below, daytime, cool neutral light, dominant colours grey, white and green; slightly darkened by a navy tint overlay; boxed with square corners and cropped at the sides. Middle left photo (about 55% to 80% of the width, 48% to 67% of the height): a red and green farm tractor in a field at sunset, sun on the horizon right of centre, warm orange and amber sky, tilled brown soil in the foreground, shallow composition from a front-three-quarter angle; navy tint overlay. Middle right photo (about 80% to 94% of the width, 48% to 67% of the height): rows of white battery energy storage containers on a flat site with power line towers in the background at dusk, pale grey and blue-violet sky; navy tint overlay. Bottom left photo (about 55% to 75% of the width, 67% to 86% of the height): a yellow crawler bulldozer on a dirt pile under a pale blue sky, side view; navy tint overlay. Bottom right photo (about 75% to 94% of the width, 67% to 86% of the height): a close-up of a white humanoid robot head in profile looking left, with blurred blue, violet and white light streaks in the background; navy tint overlay. Gradient arrow (about 48.5% to 51.7% of the width, 27.6% to 86% of the height): a tapered chevron-like band that is dark navy at its left edge and fades to bright orange #CD7925 at its right point, pointing right toward the photos. Icons in the left panel are thin single-weight line icons in dark navy with orange accents: a gear inside a box with three circles on top (for Support increasing features and functions); a warning triangle with an exclamation mark (for Demonstrate mission critical reliability); a gear inside a circular arrow with a check mark (for Optimized design); stacked layers (for High performing, cost effective solutions); and a globe showing continents (for Global scale & supply chain). Versigent logo in the bottom right: an orange rounded swirl mark followed by the white wordmark Versigent in a sans-serif face.
Slide 18
Resulting in Large Addressable Market, with Upside
Continued Growth in
Automotive …
Total Addressable Market (TAM)1
$ Billions
… with Solid Upside
Beyond Auto
CAGR – 2025E-2030E
~$145
7%
OTHER
INDUSTRIALS2
3%
COMMERCIAL
VEHICLE3
2%
AUTOMOTIVE
2%
CAGR
~$70
2025
2030E
Notes: Data points disclosed herein, unless otherwise specified, are a result of analysis and assessment through September 30, 2025 for Aptiv’s 2025 Investor Day presentation. 1. Total addressable market reflects
Aptiv estimates. 2. Other Industrials includes Aerospace & Defense, Telecom & Datacom, and Diversified Industrial end markets. 3. Commercial Vehicle end market includes both on- and off-highway vehicles, as well
as other transportation modalities that are smaller in market size, including marine, rail, and transit.
18
Investor Presentation | March 2026 | Versigent
Visuals: Two stacked bar-style columns plus a CAGR callout and three panels with icons and photos. Bar chart: unlabelled axis, no axis scale printed, baseline rules under each bar. Bar 2025 (about 2025 total): single grey (#7F7F7F) segment labelled ~$70, unit $ Billions. Bar 2030E: total labelled ~$145, stacked bottom to top: grey #7F7F7F segment (largest, labelled none), dark green #004624 segment (commercial vehicle), teal #1A7E94 segment split by two thin darker horizontal lines into upper teal segments (other industrials). No legend. Highlighted connector: orange arrow from the 2025 bar to the 2030E bar labelled 2% CAGR inside a white circle with orange outline. Dashed connectors from the stacked segments to the three panels: teal dashed line from teal segment to OTHER INDUSTRIALS panel, green dashed line from green segment to COMMERCIAL VEHICLE panel, grey dashed line from grey segment to AUTOMOTIVE panel. Panels: OTHER INDUSTRIALS 7% with a teal factory-conveyor line icon and photo of modular battery storage containers beside wind turbines and a city skyline, muted grey-blue tones, boxed full-height at right of panel; COMMERCIAL VEHICLE 3% with a green truck line icon and photo of a white semi-trailer truck on a highway with green trees, daytime, boxed; AUTOMOTIVE 2% with a grey car-with-signal-waves line icon and photo of a dark car driving fast down a road with blurred green landscape, daytime, boxed. Logo: Versigent wordmark in white with an orange swirl mark at bottom right.
Slide 19
Financials
Overview
19
Investor Presentation | March 2026 | Versigent
Versigent
Visuals: One illustration occupying the right side of the slide: about ten parallel gold ribbons, drawn as thin flat bands with a slight three-dimensional twist, entering from the top edge between about x 49% and 88%, sweeping down and left in an S-curve, then converging and fanning out to end in angled tips around x 78% to 86%, y 70% to 82%. The ribbons are gold (about #D9A636) with darker amber (about #C47F2A) shading on their edges and inner sides, and fine dark-navy gaps between them. Lighting is flat and even with subtle shading along the ribbon edges. The illustration is not cropped by a box; it runs off the top edge of the slide and is placed over the navy background with no frame or overlay. A logo at the bottom right: an orange (about #D9732B) rounded mark made of two interlocking curved strokes, followed by the white wordmark Versigent.
Slide 20
Driving Industry Leading Financial Results / Financial Framework through 2028E / Revenue / Revenue CAGR of 3-4% / EBITDA / Cumulative EBITDA margin expansion of ~200 bps / Net Income / Leading to low-teens growth rate in Net Income per annum / Cash Flow / Converting into ~$1B of cumulative free cash flow over 2026E-2028E / Capital Allocation / Disciplined capital allocation anchored by a competitive dividend / Notes: 1. Revenue CAGR excludes impact of FX and Commodities. 2. EBITDA and Net Income adjusted for restructuring and other special items. See Appendix for detail and / reconciliation to US GAAP. 3. Free cash flow defined as Operating cash flow less Capital expenditures. See Appendix for detail and reconciliation to US GAAP. / 20 / Investor Presentation | March 2026 | Versigent
Visuals: Five rectangular label boxes, each filled #DFE9F4 with no border, no radius, no shadow, stacked vertically at x 3.2%, width 26.5%, height 9.3%, tops at 28.7%, 40.3%, 52.0%, 63.6%, 75.3%. Icons inside each box: (1) Revenue: a blue and orange rising line chart with an upward arrow over a set of blue vertical bars. (2) EBITDA: a blue outline hand holding an orange dollar coin. (3) Net Income: stacked coins, blue stack on the right and orange stack on the left. (4) Cash Flow: three blue outline banknotes, one showing an orange dollar sign and circle. (5) Capital Allocation: an orange outline pie chart with one blue wedge separated out. Background decoration: a full-bleed field of thin, curved, grey-white lines sweeping from lower left to upper right at low opacity over the navy, approximately 15 to 25% visibility. Versigent logo at bottom-right: an orange rounded mark followed by the white wordmark Versigent.
Slide 21
Solid Revenue Growth Profile
Revenue
$ Billions
3%
Adj.1
CAGR
3-4%
Adj.1
CAGR
~$10
$8.8
$8.0
2022
2025
2028E
2025–2028E:
Bookings
$54B+ of cumulative bookings in 2022-2025, including:
$7B+ with Local China OEMs
$7B+ in Commercial Vehicle
Drivers
Assumed global vehicle production2 CAGR of +1%
New program launches across all major regions
Growth in electrification, including hybrids and plug-in hybrids
Content growth from higher levels of ADAS and increasing features/functions
Mid-single digit growth in Commercial Vehicle, comprising light, medium and heavy duty trucks, and off-highway vehicles
Adjusted growth assumes no impact from FX and Commodities over period
Notes: 1. Revenue CAGR excludes impact of M&A, FX, and Commodities. See Appendix for historical detail and reconciliation to US GAAP.
2. Vehicle production CAGR based on Versigent weighted market share, i.e. weighted to geographic locations in which Versigent generates revenue.
21
Investor Presentation | March 2026 | Versigent
Versigent
Visuals: Chart: vertical bar chart titled 'Revenue' with unit label '$ Billions' (grey italic, no axis scale or gridlines shown). Three series-free bars with printed values: 2022 bar labelled $8.0, 2025 bar labelled $8.8, 2028E bar labelled ~$10 (the ~ marks an approximate value). Bars are solid blue #0857C3 with no outline, sitting on a thin dark horizontal baseline (about #1A1A1A, roughly 0.2% of height) spanning about x 5.1% to 45.2%. Category labels 2022, 2025, 2028E sit centred beneath each bar in black Calibri. No legend. No highlighted points. Two annotation callouts: a circle with orange outline (#CD7925, about 0.2% of height stroke) above the gap between 2022 and 2025 containing '3% / Adj.1 / CAGR' in black bold, joined to an orange arrow (#CD7925, open arrowhead, about 0.3% stroke) running up and to the right from the 2022 bar top area to just above the 2025 bar; a second identical-style circle above the gap between 2025 and 2028E containing '3-4% / Adj.1 / CAGR' with an orange arrow running up and right toward the 2028E label area. Circle centres are about x 22.0% y 46.8% (3% callout, diameter about 4.7% of width) and x 31.5% y 43.9% (3-4% callout). Arrows: one from about x 12.3% y 49.0% to x 23.8% y 43.6%, the second from about x 25.8% y 46.1% to x 37.3% y 41.0%. Bar boxes: 2022 bar about x 8.0% to 15.5% wide with top near 53.9% of height; 2025 bar about x 21.4% to 28.9% with top near 51.3%; 2028E bar x 34.8% to 42.3%, top at 48.0%, bottom at the baseline 80.0%. The file measurement for one bar (x 8.0%, w 20.9%, y 51.3%, h 28.7%) does not match the visible bar widths and is recorded in the elements list as read. Photographs or illustrations: none. Logo: Versigent logo, an orange (#CD7925) stylised double-chevron mark followed by the white wordmark 'Versigent' in a sans-serif, bottom right.
Slide 22
Continue to Expand Industry Leading Margins
EBITDA Margin1
% of Revenue
70 BPS
~200 BPS
~12%
10.1%
9.4%
2022
2025
2028E
2025–2028E:
Drivers
Flow through on revenue growth, net of normalized price downs of 1% to 2%
Increasing levels of manufacturing automation
Continued improvement in mix of revenue and programs, incl. full service
Material, manufacturing and SG&A performance, partially offset by labor economics
Cost Structure Actions
Material performance driven by engineering design changes and vendor negotiations
Manufacturing performance driven by footprint consolidation and rotation, and increased automation, partially offset by labor inflation
SG&A & Other reduced through overhead cost-reduction initiatives, partially offset by investments to support Non-Auto growth
Engineering productivity driven by resource consolidation in best-cost countries and increased digitalization, partially offset by ongoing product and process investments
Note: 1. EBITDA margin reflects EBITDA adjusted for restructuring and other special items.
See Appendix for detail and reconciliation to US GAAP.
22
Investor Presentation | March 2026 | Versigent
Visuals: Bar chart titled 'EBITDA Margin' with superscript 1, subtitle '% of Revenue', three vertical bars with no printed y-axis or gridlines and a thin dark baseline. Bars (left to right): 2022 labelled 9.4% (height about 24 percent of slide height), 2025 labelled 10.1% (about 26 percent), 2028E labelled ~12% (about 31 percent). Bars are solid blue #0857C3 with flat tops and no outline. Two orange (#CD7925) arrows run above the bars: the first from above the 2022 bar to above the 2025 bar, annotated by a white circle with orange outline reading '70 BPS'; the second from the 2025 bar to above the 2028E bar, annotated by a white circle with orange outline reading '~200 BPS'. No legend. No highlighted points beyond the annotated step-ups. Orange Versigent logo at bottom right: an orange stylised V-shaped mark next to white wordmark 'Versigent'.
Slide 23
Disciplined Capital Allocation Strategy
Free Cash Flow
1
~$
1
B
Cumulative
FCF Generation During
2026E to 2028E
Prudent Balance Sheet management
Launching within gross leverage
2
target range of 2.0x – 2.5x
Invest in organic growth
Increase manufacturing processes automation and further optimize footprint
Enhance competitive cost structure
Return cash to shareholders
Pay a competitive dividend
Return excess cash through share repurchases
Pursue bolt-on acquisition opportunities
Strengthen Automotive market position
Note: 1. Free cash flow measured Operating cash flow less Capital expenditures. See Appendix for detail and reconciliation to US GAAP.
2. Measured as Gross and Net Debt divided by LTM Adjusted EBITDA. See Appendix for detail and reconciliation to US GAAP.
23
Investor Presentation | March 2026 | Versigent
Visuals: Non-text elements: (1) Background: faint thin curved grey-bronze arc lines sweeping from the bottom-left up and out to the top-right over the navy field, low opacity, behind all content. (2) Orange gradient arrow band: a vertical translucent band at about x 34.4–38.2%, y 32.2–79.6%, bright orange #CD7925 at its centre fading to transparent at its top and bottom, with a point on its right edge aimed at the right-hand boxes; it sits between the left panel and the right boxes. (3) Light panel on the left holding the 'Free Cash Flow' heading and the figure '~$1B' with caption 'Cumulative FCF Generation During 2026E to 2028E'. (4) Four light rectangular boxes stacked on the right, each with an orange heading and black bullet points. (5) Versigent logo, bottom right: an orange stylised swirl mark followed by the white wordmark 'Versigent'. No charts, tables or photographs.
Slide 24
2026 Financial Guidance / ($ Millions) / FY 2026 4 / FY 2025 Carve Out / Reported Revenue / Adjusted Growth %1 / $9,100 – $9,400 / 2% / $8,818 / 4% / EBITDA2 / EBITDA Margin / $950 – $1,030 / 10.7% / $893 / 10.1% / Free Cash Flow3 / $200 – $300 / ~70M of separation costs / $481 / Notes: 1. Adjusted revenue growth excludes impact of foreign exchange and commodities. FY 2026 FX and commodity assumptions as follows: Copper = 5.50, USD/MXN = 18.00, EUR/USD = 1.17, USD/CNY = 7.00. 2. / EBITDA adjusted for restructuring and other special items. See Appendix for detail and reconciliation to US GAAP. 3. Free cash flow measured Operating cash flow less Capital expenditures. 4. Represents guidance / disclosed on February 2, 2026. See Appendix for detail and reconciliation to US GAAP. / 24 / Investor Presentation | March 2026 | Versigent / Versigent
Visuals: Non-photographic slide with no charts or photographs. Visual elements: (1) a full-bleed navy background rectangle #16283F; (2) a peach rectangle #EFC9A4 behind the FY 2026 column, x 30.3%, y 28.1%, w 32.5%, h 56.0%, with no border, square corners and no shadow; (3) a light grey rectangle #D9D9D9 behind the FY 2025 Carve Out header, x 64.7%, y 28.1%, w 30.0%, h 6.7%, square corners; (4) two horizontal divider rules, each about 0.6% of slide height thick and about 89.7% wide, running from left to right with a gradient from saturated blue #1F5BD6 at the left end to white #FFFFFF at the right end, placed at y 50.2% (x 4.4%) and y 67.2% (x 4.5%), overlapping the peach column; (5) the Versigent logo at bottom right, consisting of an orange #E07B26 stylised mark resembling a split circle or leaf and the white wordmark Versigent in a sans-serif typeface, x about 85.6%, y about 92.4%, w about 11.3%, h about 4.4%.
Slide 25
Conclusion: Positioned for Sustainable Value Creation / Benefiting from secular growth tailwinds / • Driving demands for increased vehicle electrification and vehicle content / Leveraging a comprehensive low- and high-voltage product portfolio / • Augmented by unique capabilities from architecture optimization to execution / Differentiated by an industry-leading operating model / • Industry-leading engineering capabilities, global manufacturing scale, and resilient supply chain / Resulting in an attractive financial profile / • Enabled by best-in-class operational execution / Driving a disciplined capital allocation strategy / • Incremental opportunity to increase shareholder value / 25 / Investor Presentation | March 2026 | Versigent
Visuals: Five circular line icons, one per row, each on a pale blue-white disc. Icon 1 (top): a blue circle-arrow and line chart with rising trend line and an orange tag or label shape. Icon 2: an orange rectangular box with blue circuit-style nodes and a small gear, linked by blue lines. Icon 3: a blue gear with an orange dollar sign inside a blue ring, with four orange small circular nodes on the ring at top, bottom, left and right. Icon 4: a blue rising trend arrow above orange vertical bar lines. Icon 5: an orange donut or pie chart with one segment pulled out, drawn in orange with blue detail. All icons are thin outline strokes. A decorative background image of translucent grey-brown curved arcs sweeps from the lower left up to the upper right behind the content and overlaps the text area at low opacity. A thin orange bracket line with small orange dot terminals connects the five icons along the left side.
Slide 26
Appendix / 26 / Investor Presentation | March 2026 | Versigent / Versigent
Visuals: One illustration: a set of about 14 thin, smooth, gold-amber strands running horizontally from the left edge to the right edge, each with S-shaped step transitions. In the upper group, strands rise from the left and step up near the top centre, while two strands step up toward the top right and one stays low; in the middle group, strands cross near the centre-left and step up or down. The strands are fine, roughly 1 to 2 pixels wide, with a slight fade toward the lower right where the lowest strand ends at about x 53% and continues faintly to the right edge. The illustration is full width and occupies the top 51.4% of the slide, bleeding off the left, right and top edges. No photograph, chart or table. Logo: an orange (#E07B24) abstract emblem of two curved shapes followed by the white wordmark Versigent, at the bottom right.
Slides 27 to 32 continue in the full text file.
Download this deck
The hosted PDF of every library deck is free for readers of the SlideDeck Co newsletter. Join with your email and the viewer and download appear here.
Preparing a results presentation or business update of your own? The SlideDeck Co Standard Deck is a slide library for business reviews, updates and plans.







