
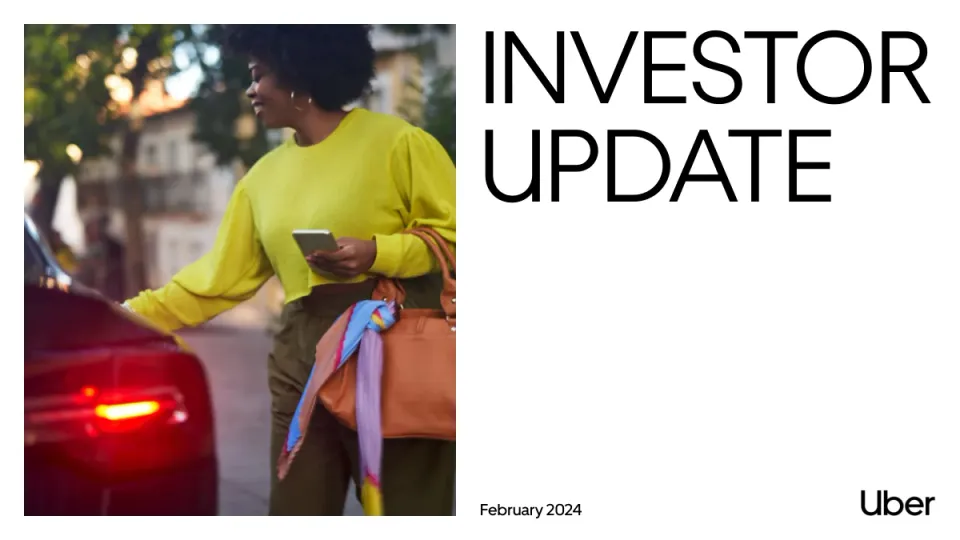
The deck opens with a title slide and a forward-looking statements and non-GAAP disclaimer, then moves into a company overview with headline metrics for monthly active consumers, gross bookings and adjusted EBITDA, followed by the management team and platform strengths. Its middle sections cover the Mobility business, the Delivery business, economic impact and driver flexibility, and a section on delivering profitable growth covering free cash flow, capital allocation and the three-year outlook. The closing summary highlights investment points, and an appendix holds the non-GAAP reconciliations for adjusted EBITDA, free cash flow and cost lines. Slides are built on consistent section dividers with a single large statement or chart per page, and the opening company overview slides pair big figures with a route-line graphic. Slides worth studying include the platform metrics slide with large numerals on a dark map backdrop, the Mobility growth model that breaks gross bookings into consumers, trips and spend, and the free cash flow inflection chart. The appendix reconciliation tables show how the deck lays out dense financial data.
Slides worth studying
- Slide 5: Large green numerals on a dark route graphic make three headline metrics readable at a glance, with a clear IPO and 2023 timeline marker.
- Slide 67: A simple equation layout breaks gross bookings into consumers, engagement and spend, turning a financial model into one diagram.
- Slide 73: A clean bar chart pairs adjusted EBITDA with free cash flow across three periods, with conversion percentages called out above.
- Slide 21: Combining a bar chart, a margin line and a short list of key figures on one slide keeps the segment story tight.
Details
- Company: Uber
- Year: 2024
- Type: Investor presentation
- Industry: Mobility and delivery platform
- Pages: 82
Review score: 8 out of 10, Strong
Presentation quality, judged with the SlideDeck Co review heuristic. Ask, evidence and idea merit are not rated here.
The deck has a clear route from company overview through Mobility, Delivery, economic impact and profitable growth, with consistent dividers, section labels, action titles and one idea per page. Visual craft is disciplined: slide 5 uses large numerals on a dark road graphic, slide 67 shows the consumers x engagement x spend model clearly, and the simple bar charts (slides 21, 38, 40) are easy to read. The weaknesses are real: some pages carry tiny footnotes and small chart labels (slides 8, 26, 71, 72), a few image-led slides add little (slides 54, 56, 59), and slide 73 leaves its 2024-2026 bars without values, which weakens the inflection point claim.
Worth keeping: Keep the section divider system, the action titles, the large numerals on slides 5, 10 and 52, and the multiplicative growth model on slides 23 and 67.
Most useful repair: Enlarge or cut the small chart labels and footnotes on slides 26, 71 and 72, and put values on the projected bars on slide 73.
What would change the score: I would trim the lifestyle and stock image pages in the economic impact section (slides 54, 56, 59, 60) and tighten the long run of similar chart pages in Mobility (slides 25 to 33).
Confidence high. 72 of 82 pages inspected on contact sheets, 4 at readable size. Reviewed 2026-11-10. Model-assisted review (claude-sonnet-5-5).
Full text of the slides (82 slides)
Every slide's words and a description of its charts and images, so the deck can be searched and rebuilt. Also available as Markdown.
Slide 1
INVESTOR
UPDATE
February 2024
Uber
Visuals: One photograph, boxed (not full-bleed), rectangular with square corners, placed on the left. It shows a young woman with voluminous dark curly hair and small hoop earrings, wearing a mustard-yellow crew-neck sweater and olive-green trousers, looking down and to her left while holding a silver smartphone in her right hand. Her left arm reaches toward the rear of a dark red car at the left edge. A tan leather handbag hangs from her shoulder, with a multicolour scarf (blue, pink, lilac, yellow stripes) knotted over its handle. Behind her is a blurred street with a pale building, green tree foliage and out-of-focus pedestrians. Warm late-afternoon natural light, with a glowing red tail light on the car in the lower left. Dominant colours: mustard yellow, olive green, deep red, tan and soft green. The subject is cropped at the right edge and the car at the left and bottom edges. A small Uber wordmark logo (black lowercase bold sans-serif 'Uber') sits at the bottom right. No overlay or tint on the photograph.
Slide 2
Forward-Looking Statements
This presentation contains forward-looking statements regarding, among other things, our future business expectations, products, strategies and goals, including the future financial, strategic and operating performance of the
Company. These forward-looking statements contained in this presentation are based on current expectations, estimates and assumptions and are contingent on many factors, including, among other things, market conditions and the
Company’s execution. Actual results may differ materially from the results predicted, and reported results should not be considered as an indication of future performance. Forward-looking statements include all statements that are not
historical facts and can be identified by terms such as “anticipate,” “believe,” “contemplate,” “continue,” “could,” “estimate,” “expect,” “hope,” “intend,” “may,” “might,” “objective,” “ongoing,” “plan,” “potential,” “predict,” “project,” “should,”
“target,” “will,” or “would” or similar expressions and the negatives of those terms. Forward-looking statements involve known and unknown risks, uncertainties, and other factors that may cause our actual results, performance, or
achievements to be materially different from any future results, performance, or achievements expressed or implied by the forward-looking statements.
These risks, uncertainties, and other factors relate to, among others: competition; managing our growth and corporate culture; financial performance, including our ability to attain and sustain profitability and our ability to attain and
sustain positive cash flow; investments in new products or offerings; our ability to attract drivers, consumers, and other partners to our platform; our brand and reputation and other legal and regulatory developments and proceedings,
particularly with respect to our relationships with drivers and couriers. In addition, other potential risks and uncertainties that could cause actual results to differ from the results predicted include, among others, those risks and
uncertainties included under the captions “Risk Factors” and “Management’s Discussion and Analysis of Financial Condition and Results of Operations” in our annual report on Form 10-K for the year ended December 31, 2022, and
subsequent annual reports, quarterly reports and other filings filed with the Securities and Exchange Commission from time to time. All information provided in this presentation is as of the date hereof and any forward-looking
statements contained herein are based on assumptions that we believe to be reasonable as of such date. We undertake no duty to update this information unless required by law.
Non-GAAP Financial Measures
To supplement our financial information, which is prepared and presented in accordance with generally accepted accounting principles in the United States of America, or GAAP, we use the following non-GAAP financial measures:
Adjusted EBITDA; Non-GAAP Costs and Operating Expenses; Free Cash Flow; as well as revenue growth rates in constant currency. The presentation of this financial information is not intended to be considered in isolation or as a
substitute for, or superior to, the financial information prepared and presented in accordance with GAAP. We use these non-GAAP financial measures for financial and operational decision-making and as a means to evaluate
period-to-period comparisons. We believe that these non-GAAP financial measures provide meaningful supplemental information regarding our performance by excluding certain items that may not be indicative of our recurring core
business operating results. We believe that both management and investors benefit from referring to these non-GAAP financial measures in assessing our performance and when planning, forecasting, and analyzing future periods.
These non-GAAP financial measures also facilitate management’s internal comparisons to our historical performance. We believe these non-GAAP financial measures are useful to investors both because (1) they allow for greater
transparency with respect to key metrics used by management in its financial and operational decision-making and (2) they are used by our institutional investors and the analyst community to help them analyze the health of our
business.
There are a number of limitations related to the use of non-GAAP financial measures. In light of these limitations we provide specific information regarding the GAAP amounts excluded from these non-GAAP financial measures and
evaluating these non-GAAP financial measures together with their relevant financial measures in accordance with GAAP. For more information on these non-GAAP financial measures, please see the section titled “Non-GAAP
Reconciliations” included at the end of this presentation. In regards to forward looking non-GAAP guidance and targets provided in this presentation, we are not able to reconcile the forward-looking non-GAAP Adjusted EBITDA or Free
Cash Flow measures to the closest corresponding GAAP measure without unreasonable efforts because we are unable to predict the ultimate outcome of certain significant items. These items include, but are not limited to significant
legal settlements, unrealized gains and losses on equity investments, tax and regulatory reserve changes, restructuring costs and acquisition and financing related impacts.
Uber | Investor Update
2
Visuals: The only non-text visual is the Uber wordmark logo in the bottom-left footer: the word 'Uber' in solid black bold sans-serif lettering, shown as a flat one-colour mark with no outline, shadow or background. It sits left of a thin black vertical bar separator. No photographs, charts, tables, diagrams or illustrations are present.
Slide 3
COMPANY
OVERVIEW
Uber | Investor Update
3
Visuals: Photograph occupying the right half (x 50 to 100, full height), full-bleed and not boxed. Subject: a narrow two-lane road cut into a limestone cliff, curving left to right along a lake shore at dusk or night. Long-exposure light trails: white headlight streaks on the left lane and red-orange taillight streaks on the right lane, both sweeping into the curve. Left of the road is a dark, still lake with soft horizontal reflections. Upper left shows a distant town with scattered warm yellow lights across the far shore. Foreground and lower left are dense dark green trees and a bent pine. A guardrail follows the road edge. Lighting is low ambient blue-hour light with warm artificial light trails. Dominant colours: slate blue-grey, near-black, dark green, with white and red-orange streaks. Composition: diagonal sweep of the road from lower right toward upper left, with the cliff occupying the upper right. No overlay or tint. Small white map-pin icon at top left (96 by 96 px source, white fill, solid pin shape with a small black centre dot). White Uber wordmark at bottom left, next to a thin vertical white bar separator. None else.
Slide 4
Company Overview
Committed to our mission
We reimagine the way the world
moves for the better
Uber | Investor Update
4
Visuals: Photograph: a smiling woman with dark hair looks out of the side window of a car, in profile facing right and slightly upward. She is framed from the head to the shoulders, cropped at the edges, filling the full slide. The left side shows a blurred, out-of-focus street scene with green and grey tones and a car door edge in the foreground. Lighting is soft and low-key, coming from the window on the left, with warm yellow-ochre tones in her top and dark brown-black shadows elsewhere. Dominant colours: near-black, warm ochre yellow, muted green-grey at upper left. A dark black overlay tints the entire photograph, darkening it. The image is full-bleed with no border. Small Uber wordmark logo in the footer, white, left of 'Investor Update'.
Slide 5
Company Overview / We’ve proven out our / platform’s promise — / and we’re just getting / started / 91M / Monthly Active / Platform Consumers / Q4’18 / $50B / Gross Bookings / IPO¹ / ($1.8B) / Adjusted EBITDA² / 150M / Monthly Active / Platform Consumers / Q4’23 / $138B / Gross Bookings / 2023 / $4.1B / Adjusted EBITDA² / Uber | Investor Update / 5 / 1. FY’18 is the first available full fiscal year data at the time of IPO / 2. See Non-GAAP Reconciliations
Visuals: Full-bleed photograph of a rugged desert mountain landscape at dusk: large brown and tan boulder formations on the upper left and top, green desert shrubs and palm-like trees in the middle and lower left, and a dark night-time foreground. The photograph is covered by a near-black tint (#000000) that darkens it heavily. A dark slate road (#2B323B) rises as a wide S-curve from the bottom centre up to the right edge and exits at the top right, with a white dashed centre line running along it. Two map-pin style markers sit on the road: an orange IPO¹ pin at upper right (white disc with orange ring and orange stem pointing down to the road) and a green 2023 pin at centre right (white disc with green ring and green stem pointing down to the road). No charts, tables or other graphics.
Slide 6
An outstanding management team committed to relentless / innovation and improvement / Dara Khosrowshahi / Chief Executive Officer / Joined Uber in 2017 / Prashanth Mahendra-Rajah / Chief Financial Officer / Joined Uber in 2023 / Jill Hazelbaker / Senior Vice President, Marketing & / Public Affairs / Joined Uber in 2015 / Nikki Krishnamurthy / Chief People Officer / Joined Uber in 2018 / Tony West / Senior Vice President, Chief Legal / Officer, and Corporate Secretary / Joined Uber in 2017 / Gus Fuldner / Senior Vice President, / Safety & Core Services / Joined Uber in 2013 / Pierre-Dimitri Gore-Coty / Senior Vice President, Delivery / Joined Uber in 2012 / Albert Greenberg / Vice President, Platform Engineering / Joined Uber in 2021 / Sundeep Jain / Chief Product Officer and / Senior Vice President, Engineering / Joined Uber in 2018 / Andrew Macdonald / Senior Vice President, Mobility & / Business Operations / Joined Uber in 2012 / Uber | Investor Update / 6
Visuals: Ten circular headshot photographs, each a head-and-shoulders portrait cropped to a circle against a plain mid-grey studio backdrop with soft even lighting, subject centred and looking at camera. Row 1, left to right: Dara Khosrowshahi, a smiling bald man with a short grey beard in a grey crew-neck sweater; Prashanth Mahendra-Rajah, a smiling man with short greying hair in a dark navy suit jacket over a light blue open-collar shirt; Jill Hazelbaker, a smiling woman with long wavy blonde hair in a black top; Nikki Krishnamurthy, a smiling woman with long brown hair and dark red lipstick in a mustard-orange top; Tony West, a smiling man with short dark hair in a light blue open-collar shirt. Row 2, left to right: Gus Fuldner, a smiling man with swept light brown hair in a lavender-blue collared shirt; Pierre-Dimitri Gore-Coty, a man with short dark brown hair and a slight smile in a pale blue collared shirt; Albert Greenberg, a smiling older man with short greying hair in a dusty pink collared shirt; Sundeep Jain, a smiling man with short dark hair in a dark grey crew-neck sweater over a dark shirt; Andrew Macdonald, a smiling man with short light brown hair in a blue striped collared shirt. The Uber wordmark logo sits bottom left in black, with no other icons, charts or graphics.
Slide 7
Company Overview
As we've scaled, our platform has shown enormous power
Breadth of offerings / with unmatched / global scale
Shared and / compounding / marketplace tech
Renowned brand and / differentiated / membership program
Operational excellence
Uber
Consumer and earner impact
Financial impact
Best-in-class experience
Higher engagement
Better retention
Faster time to market and ramp of new offerings
Lower customer acquisition and tech costs
Higher margins and investment returns
Uber | Investor Update
7
Visuals: Four-pillar graphic: a wide black rounded band containing four centred text pillars separated by three thin vertical grey divider lines at roughly 26%, 50% and 74% of slide width. Beneath it a tapered black wedge narrows from the band's full width down to the Uber app icon at the centre, linking the band to the blue panel. Central Uber app icon: white rounded square with a thick black border and the black 'Uber' wordmark. Blue panel contains two columns: left with a white group-of-people icon above the heading 'Consumer and earner impact' and three white check marks beside three bullets; right with a white banknote icon above the heading 'Financial impact' and three white check marks after three right-aligned bullets. Footer shows the Uber wordmark logo in black. No chart, table or photograph.
Slide 8
Company Overview
Consumers are using more of our products and spending / more on our platform
More than a third of monthly / consumers¹ are multi-product²
Multi-product consumers spend over 3x / more than single-product consumers³
34%
21%
3.0x
3.4x
Q1'21 Q2'21 Q3'21 Q4'21 Q1'22 Q2'22 Q3'22 Q4'22 Q1'23 Q2'23 Q3'23 Q4'23
Q4’21
Q4’23
Average single-product consumer
Average multi-product consumer
1. Consumers defined as the number of unique consumers in markets where we operate Mobility and Delivery who completed a Mobility ride and/or received a Delivery order on our platform at least once in a / given month, averaged over each month in the quarter
2. Multi-product consumers defined as active consumers in markets where we operate Mobility and Delivery who used two or more products (either within a line of business or across lines of businesses) in a / given month, averaged over each month in the quarter
3. Single-product consumers defined as active consumers in markets where we operate Mobility and Delivery who used one product in a given month, averaged over each month in the quarter
Uber | Investor Update
8
Visuals: Chart 1 (left, rendered as an image, column chart): title 'More than a third of monthly consumers¹ are multi-product²'. Categories on x-axis: Q1'21, Q2'21, Q3'21, Q4'21, Q1'22, Q2'22, Q3'22, Q4'22, Q1'23, Q2'23, Q3'23, Q4'23 (no axis title or units printed). Y-axis not printed; the bars are a single series in blue #3B6EE8 (approximate) with no legend. Printed values: Q1'21 = 21% and Q4'23 = 34%. Estimated values with no printed label (about): Q2'21 about 24%, Q3'21 about 25%, Q4'21 about 26%, Q1'22 about 26%, Q2'22 about 28%, Q3'22 about 29%, Q4'22 about 30%, Q1'23 about 29%, Q2'23 about 31%, Q3'23 about 32%. Highlighted points: first and last bars are the labelled points; a grey #AFAFAF elbow arrow with rounded corners runs from above the 21% bar, horizontally across the top, to an arrowhead just above the 34% bar. Baseline is a dark grey horizontal axis line at about y 77%, x 5.5% to 45.1%. Chart 2 (right, drawn with filled rectangles, clustered column chart): title 'Multi-product consumers spend over 3x more than single-product consumers³'. Categories on x-axis: Q4'21 and Q4'23 (labels in Medium weight, about 1.7% of slide height). Y-axis not printed; baseline black line at about y 77%, x 59.4% to 90.6%. Series 1 'Average single-product consumer' in black #000000; Series 2 'Average multi-product consumer' in blue #276EF1. Bars: Q4'21 single-product black bar x 61.1%, y 65.7%, w 5.3%, h 11.2%; Q4'21 multi-product blue bar x 66.5%, y 43.1%, w 5.3%, h 33.8%; Q4'23 single-product black bar x 77.9%, y 66.0%, w 5.3%, h 10.9%; Q4'23 multi-product blue bar x 83.4%, y 40.4%, w 5.3%, h 36.5%. Printed values: 3.0x (Q4'21, next to the first grey arrow) and 3.4x (Q4'23). Bar heights are not labelled; relative heights are as drawn. Grey #AFAFAF stepped arrows: one from the top of the Q4'21 black bar rising then turning right to the Q4'21 blue bar (x 63.5%, y 42.1%, w 2.7%, h 22.8%); one from the top of the Q4'23 black bar to the Q4'23 blue bar (x 80.2%, y 39.7%, w 2.7%, h 25.4%). Legend below the chart, left to right: black square then 'Average single-product consumer', blue square then 'Average multi-product consumer'. Bars have square corners and no outline. Divider: thin light grey #D0D0D0 vertical line at x about 50%. Logo: small Uber wordmark image at bottom left, x 1.6%, y 92.4%, 4.4% by 4.7%, black on white.
Slide 9
Company Overview
Cross-promotion at scale drives efficiencies in CAC
The Mobility and Delivery apps are meaningful
channels of growth for one another
We have a dedicated product team building our
cross-promotion paths
31%
of Delivery First Trips come
from the Mobility app1
22%
of Mobility First Trips come
from the Delivery app1
The cost of incremental acquisition is
50% that of paid channels2
Paid channels
CRM
Uber | Investor Update
1. Markets where we operate Mobility and Delivery as of Q4’23
2. FY’23 US Delivery (non-iOS) consumer acquisition costs
9
Visuals: Two boxed photographs side by side on the left, each with a dark overlay and a large white statistic over it. Left photo: a delivery courier in a dark jacket and grey helmet handing a green paper bag to a customer, outdoors with blurred green foliage behind; the image is boxed with square corners, not full-bleed, and a dark tint of roughly 50 percent black overlays it. Right photo: a woman in a grey-blue blazer leaning on the open door or hood of a white car, with blurred grey street behind; boxed, square corners, with the same dark tint. Lighting is soft daylight, dominant colours are dark grey, muted green and white. Chart: a two-bar column chart with no axes, no gridlines and no legend. Bar 1 labelled Paid channels is a pale mint bar (about #D9EBD4) with no printed value, spanning about 67% to 75% of slide width and rising from the baseline to about 43.6% of slide height. Bar 2 labelled CRM is a solid green bar (#34A853) with no printed value, spanning about 79.5% to 87.4% width and rising to about 59% of slide height. Both bars sit on a thin black baseline (about 0.2% of slide height) from about 65% to 90% width at about 76.4% of slide height. A grey (#AFAFAF) curved arrow of about 3 px stroke with rounded corners rises from the top of the Paid channels bar, runs horizontally at about 39% of slide height, and drops down to a filled grey triangular arrowhead pointing down onto the top of the CRM bar at about 56% of slide height. The arrow is the only connector; the 50% headline figure is the printed comparison.
Slide 10
Company Overview / Growing Uber One member base driving / higher engagement / 19M / 3x member growth since / Q4’21 / 30% / Total Gross Bookings / Coverage¹ / 3.4x / Member vs. non / member monthly / spend² / 45% / Delivery Gross Bookings / Coverage / Uber | Investor Update / 1. Percentage of Mobility and Delivery Gross Bookings coming from members as of Dec’23 / 2. Global monthly spend as of Q4’23 / 10 / 10:11 / Welcome to Uber One, Eric / See all the ways you can start saving on Day 1: / $0 Delivery Fee / Save on food, groceries, and more / Up to 10% off orders / Get discounts on Uber Eats / 6% back on rides / Earn Uber Cash while you ride / Exclusive offers / Member-only promotions / Continue
Visuals: Four small gold icons and one phone mockup. Icon 1 (x 2.9%, y 37.7%, 3.3 by 5.9%) is a gold-outlined ring enclosing a dark brown stylised glyph, sitting above 19M. Icon 2 (x 24.1%, y 37.7%) is a gold shopping bag with a dark brown handle and a dark brown coin-like symbol, sitting above 30%. Icon 3 (x 47.3%, y 37.7%) is a gold banknote with a dark brown coin at right, sitting above 3.4x. The phone mockup (x 70.2%, y 4.7%, 28.7 by 94.4%) is a black smartphone with rounded corners and soft grey drop shadow; its screen shows a dark app welcome screen with gold confetti particles scattered across it, a red status pill reading 10:11, a white circular close button, a welcome headline, a 2 by 2 grid of dark brown rounded tiles each with a gold icon (shopping bag, price tag, car, gift box), and a gold Continue button near the bottom with a white home indicator bar beneath. No charts or tables.
Slide 11
Company Overview / Driver and courier engagement remains strong; more ways to / flexibly earn via the Uber Driver app / Single driver app = higher retention1… / …and higher engagement2 / +19pp Delivery-only / +1pp Mobility-only / 1.7x Delivery-only / 1.1x Mobility-only / Delivery-only / Mobility-only / Cross-platform / Delivery-only / Mobility-only / Cross-platform / Uber | Investor Update / 11 / 1. US 28-day earner retention data as of Q4’23 / 2. US supply hours per earner as of Q4’23
Visuals: Two vertical bar charts, each with three bars, rendered as images. Left chart: 'Single driver app = higher retention'. Categories on the x-axis: Delivery-only (green), Mobility-only (blue), Cross-platform (black). No numeric axes or gridlines are shown. Bar heights are unlabelled except for callouts: Delivery-only about 51% of plot height, Mobility-only about 44%, Cross-platform about 43%; the callout above Cross-platform reads '+19pp Delivery-only / +1pp Mobility-only'. Right chart: '…and higher engagement'. Categories: Delivery-only (green), Mobility-only (blue), Cross-platform (black). Bar heights about 60%, 48% and 45% of the plot height respectively; callout above Cross-platform reads '1.7x Delivery-only / 1.1x Mobility-only'. Both charts share a baseline (thin dark grey line) and no legend. Highlighted points: the Cross-platform bar is the tallest in both charts and carries the callout. Dominant colours: green #06C167, blue #276EF1, black #000000. Thin vertical divider line between the charts, light grey. The Uber logo is a small wordmark image at bottom-left.
Slide 12
Company Overview
Uber’s platform provides for low cost supply acquisition
Courier acquisition and upsell is
50%
~20%
of Mobility driver first trips come
of the cost of new driver acquisition
from the courier pool
1
New / Resurrected
Courier Acquisition
Drivers
& Upsell
Uber | Investor Update
12
1. US data as of FY’23
Visuals: Chart: vertical bar chart with two bars and a connecting elbow arrow, no chart title, no axis numbers, no y-axis, no value labels. Baseline is a black horizontal line. Bar 1 (left) is light blue, labelled 'New / Resurrected Drivers', full height relative to the arrow start. Bar 2 (right) is a solid blue bar, labelled 'Courier Acquisition & Upsell', about 50% of the height of bar 1 (about) with no printed value. A grey (#AFAFAF) elbow arrow, about 6 px thick with rounded corners, starts above the top of bar 1, runs right and down, and ends in a downward arrowhead above bar 2 to show the 50% relationship. No legend. No highlighted points. Right side: two smartphone screenshots side by side, each in a black rounded phone frame with a soft shadow. Left phone: a driver menu screen with a grey map strip on the right edge; top shows avatar and name 'Olamide' with a 4.90 star rating; menu items listed in large type: Inbox (with blue badge 4), Earn with Rides, Opportunities, Earnings, Uber Eats Pro, Wallet, Account; a thin divider then small items Refer Friends, Account, Help. Right phone: a 22:47 status bar, a close X at upper left, a white car with a driver illustration in blue trousers and a person in the car window, heading 'Start accepting UberX trips', body text 'Rides and deliveries — you can do both. Sign up today, and you’ll receive trips once you’re approved.', two feature rows with small blue icons: 'More opportunities to earn' and 'Maximum control', and a black full-width 'Sign up' button at the bottom. Dominant colours of screenshots: white, black, light grey and blue. Uber logo at bottom left, black, not cropped.
Slide 13
Company Overview
Business platform: more ways for partners to reach customers
Uber
for Business
Uber
Health
Uber
Direct
Uber
Connect
Advertising
Uber
Investor Update
13
Visuals: Five full-height vertical illustrated panels, each a flat-vector illustration cropped to a tall rectangle and darkened by a black tint, each carrying a white centred label. Panel 1 (Uber for Business): a close-up of a laptop on a desk, its screen showing a green dashboard with the word 'business', the figures 70, 83% and 44M, bar and donut charts, and a hand typing on the keyboard; the laptop is in the foreground, blue-teal background, cool dark tones. Panel 2 (Uber Health): a grey wall with a white medical cross and a grey counter; a man seen from behind in a green jacket and blue sleeves with a blue shoulder strap, holding a small red bag, standing in a grey, low-key scene. Panel 3 (Uber Direct): interior of a car with brown leather seats, a cardboard box and a light blue paper bag in the boot, warm ochre and brown tones with dark red shadows. Panel 4 (Uber Connect): a smiling young man with curly dark hair in a blue jacket against a pale blue sky and green foliage at top-left, holding out a large ochre cardboard box with both hands. Panel 5 (Advertising): a woman with dark hair in a yellow top and blue patterned skirt holding a smartphone, with floating blue percentage badges, yellow coupon tokens and small cars on a terracotta and tan background, a striped awning at top-right. Lighting is flat and even, composition is centred on the subject in each panel, and there is no border on the panels. Small blue-and-white Uber wordmark image sits in the footer, about 4.4% wide, with no other logos.
Slide 14
Company Overview / Advertisers reach unique consumers and drive action across / Uber’s advertising ecosystem / Video Journey Ad in / Uber App / Video Tablet Ad with Video & QR Code / Knock, knock. / The Heismans are here. / Tebow & RGIII surprise fans with game day eats. / Scan to watch more. / From awareness… / Homepage Billboard / in Uber Eats App / ...to action / Post-Checkout Ad in / Uber Eats App / Meet at your pickup spot on Broadway / 5 min / Ride details / License plate is not available / White Oldsmobile Intrigue / Arjun 4.75★ / Your price may include government mandated fees (NYC Sales Tax, NYS Black Car Fund surcharge, and NYS Congestion surcharge). / Any pickup notes? / 00:01 / Nissan Heisman House / Watch More → / Ad / Search Uber Eats / Chick-fil-A / $0 Delivery Fee · 15 min / Starbucks / $0 Delivery Fee / Get $5 off $15 this Rivalry Weekend → / Top picks: Breakfast and Brunch / Dunkin’ / $0 Delivery Fee · 10 min / Brooklyn B… / $4.49 Delivery / Home / Grocery / Browse / Carts / Account / 00:25 / Nissan Heisman House / Tebow & RGIII deliver game day eats. / Watch More → / Ad / Delivery details / Address / New York, NY, USA / Apt / Suite / Floor: 1 / Change / Drop-off options / Meet at my door / Change / Service / Standard / Add delivery instructions / Uber | Investor Update / 14
Visuals: Timeline diagram: one black horizontal line about 1.1% of slide height thick across the full width at about 32.4% from top, interrupted by the Uber app icon (black rounded square with white Uber wordmark, left at about 5.3% x) and the Uber Eats icon (green rounded square with white stacked Uber / Eats wordmark, at about 59.2% x). Four black ring markers (black ring with white centre, about 3% wide and 5.3% tall) sit on the line at about 19.2%, 40.8%, 73.8% and 89.1% x. Device 1 (left): a black smartphone frame at about 13.3% x showing an Uber rider app screen (map at top, status time 10:33, card ‘Meet at your pickup spot on Broadway’ with a ‘5 min’ badge, grey ‘Ride details’ button, driver photo of a white Oldsmobile with rating 4.75) with a video ad card overlaid at lower left (about 12.9% to 25.7% x, 69.2% to 86.9% y): a saturated red panel with a large Nissan logo in dark red relief, a red timer label ‘00:01’ at top-left, a speaker icon at lower right, and a white caption band with ‘Nissan Heisman House’, ‘Watch More →’ and ‘Ad’. Device 2 (centre): a wide black tablet frame (#1F1F1F, rounded corners about 3% radius, soft drop shadow) at about 26.8% to 55.1% x and 44.8% to 74.5% y containing a video ad still: left half is a photo of a living room with several people cheering and a man in a dark shirt, bright indoor daylight, warm and cool mixed tones; right half is a solid black panel with Nissan and Heisman logos at top, large white text ‘Knock, knock. / The Heismans are here.’, smaller white copy and a white QR code (black modules, about 8% of slide width) at lower left of the panel. A small ‘Ad’ tag sits lower-left of the photo; a bottom control bar shows a red progress line, Uber logo, and icons labelled Tip, Sleep, Volume and Brightness. Device 3 (right, homepage): a black smartphone frame at about 68.3% x with an Uber Eats home screen (search field ‘Search Uber Eats’, merchant cards Chick-fil-A and Starbucks, ‘Top picks: Breakfast and Brunch’ row with food photos, Dunkin’ and Brooklyn B cards, bottom tab bar with Home, Grocery, Browse, Carts, Account). Overlaid on it is a billboard card (about 67.7% to 80.6% x, 60.4% to 70.2% y) with a photo of a brick mansion with a row of Nissan vehicles in front, a white ‘NISSAN HEISMAN HOUSE’ wordmark over the building, and a white strip reading ‘Get $5 off $15 this Rivalry Weekend →’; the card has square corners and a faint shadow. Device 4 (far right): a black smartphone frame at about 83.3% x showing a checkout screen (status 12:20) with an overlaid video ad card (about 82.6% to 95.6% x, 48.1% to 68.9% y, rounded corners about 2% radius, white card with shadow) containing a video still of a man in a car interior with a Nissan logo overlay, timer ‘00:25’ and speaker icon, then ‘Nissan Heisman House’, ‘Tebow & RGIII deliver game day eats.’ and a white pill ‘Watch More →’ with ‘Ad’ at right; below, the screen shows a ‘Delivery details’ list with Address, Drop-off options (Meet at my door), Service (Standard), grey Change buttons and a pill ‘Add delivery instructions’. Footer: Uber wordmark image in black at lower left. No other photographs.
Slide 15
Company Overview
Power of our shared technical platform: more data, more capabilities
Identity
Unified login, authorization, personalization
Dispatching
Upfront assignment, queuing, batching, positioning
Infrastructure
Storage, indexing/search, data flow, frameworks, configs, pipelines, ML labeling
Maps
Routing/navigation, pickup/dropoff points, ETAs
Pricing
Dynamic pricing/surge
Support
Agent network, automation, workflow, support channels
Payments
Unified wallet, local payment methods, risk and fraud tools
Trip life-cycle
State management, post processing, error management, receipts
Localization
Language, tax, compliance
Ordering
On demand, scheduled, multi-job
UberX
Reserve
UberX Share
Black
Taxi
Food
Alcohol
Grocery
Connect
Convenience
HCV
Freight
Uber | Investor Update
15
Visuals: Ten rounded-free light grey rectangles (#F3F3F3) form a 5 by 2 card grid with no text outside the cards other than the headings and bodies listed in elements. A black horizontal rule with a centred black semicircular arc and a black downward arrow sits between the card grid and the icon row. Eleven 3D-style rendered icons, each with a bold label beneath: a white UberX car; a Reserve calendar with clock; an UberX Share white car with two people standing beside it; a black Black car; a yellow Taxi car; a bowl of food with a drink glass for Food; a bottle and glass for Alcohol; a red basket with bread and bottles for Grocery; a brown cardboard box for Connect; paper bags, a milk carton and a toilet roll for Convenience; a white HCV van; an orange Freight truck. The icons are soft-lit, with dominant colours white, grey, black, yellow, red, orange and brown, and no cropping or overlays.
Slide 16
Company Overview
Massive data sets and shared
architecture enhance AI
capabilities
20K
models trained
per month
10M
peak predictions
per second
Efficient Marketplace
Matching, Routing, Dispatch,
Pricing, Incentives
+$10
$7-12 extra per trip
7 AM – 10 AM • 3 eligible areas •
Personalization
Eats Feed, Search, Rides
Inspired by your Uber rides
Based on rides to or from merchant partners
Marufuku Ramen
$0 Delivery Fee • 25 min
Kiwa H
$0 D
Risk & Safety
ID verification, Fraud &
incident prevention
GenAI for Productivity
Code, Data & Oncall assistants,
Automated testing & fixes
expenses = []
for line in expenses_string.split
if line.startswith("#"):
continue
date, value, currency = line.s
expenses.append((datetime.date
float(value),
currency))
return expenses
Support Beta
Powered by AI
End chat
Wed, Feb 27, 9:41 AM
Hello! I'm your support assistant, here to answer questions about driving and delivering with Uber. I'm not a human, so I'm available 24/7.
What are some options for the Margherita pizza under $20.
Here are some affordable Margherita pizza options.
GenAI for Automations
Support bots, Document
automations
GenAI for Magical UX
for consumers and earners
Uber | Investor Update
16
Visuals: Left half: full-bleed photograph of abstract blurred bokeh and streaks of fibre-optic light on a near-black ground, with teal, cyan, blue and some magenta glints, scattered out of focus, no people, no text. Right half, six screenshot cards, each boxed with a thin light-grey edge, soft drop shadow and small corner radius, all the same size (about 19% by 22% of the slide): (1) Efficient Marketplace: a map of San Francisco Bay Area in pale blue-grey and white with a blue outlined zone and a blue pill badge reading +$10, below it a white panel with a grey drag handle, '$7-12 extra per trip' in bold black and '7 AM – 10 AM • 3 eligible areas •' in small black, and a black Uber-style up-arrow logo at right. (2) Personalization: white card headed 'Inspired by your Uber rides' with a round arrow button at right, a food photo of gyoza or dumplings on a white oval plate from above, the label 'Marufuku Ramen' with a green leaf badge and '$0 Delivery Fee • 25 min' in orange-brown, and a cropped second card at the right edge reading 'Kiwa H' and '$0 D'. (3) Risk & Safety: flat vector illustration of a smiling woman with dark hair in a bun and gold hoop earrings, in an olive-green top, against a pale blue background with a lighter blue circle behind her head, white corner-bracket face-scan frame in the corners, and a blue circle with a white check mark at lower right. (4) GenAI for Productivity: dark code editor screenshot in navy-black with syntax colours (pink keywords, light blue and white text, grey line numbers) showing a Python snippet, cropped at the right edge. (5) GenAI for Automations: white chat window with a black Uber logo circle at top left, 'Support' in bold with a light blue 'Beta' tag, 'Powered by AI' underlined with an info icon, grey timestamp 'Wed, Feb 27, 9:41 AM', a pale blue-grey bubble of assistant text, and a grey pill 'End chat' button at top right; cropped at bottom. (6) GenAI for Magical UX: white chat screen with a black user bubble at top right, a light grey assistant bubble with a green sparkle icon at left, and two product cards with photos of Margherita pizza, cropped at bottom edge. Footer logo: the Uber wordmark in white, lowercase bold, at bottom-left on the dark panel.
Slide 17
Company Overview / Core business and shared tech are clearly extensible: multiple / multi-billion dollar adjacencies, with more to come / UberX / Online food / delivery / Uber / Reserve / ~10x¹ / Grocery / & Retail / ~2x¹ / Hailables / ~4x¹ / And / more… / Advertising / Last-mile / logistics / Enterprise / solutions / And / more… / Travel / Uber | Investor Update / 1. Trip growth FY’21-FY’23 / 17
Visuals: Diagram: a single light-grey tapered band (about #E4E4E4 fading to #F4F4F4 at the right edge) runs behind all bubbles, wide at the left (roughly 0 to 100% width, 27% to 90% height) and narrowing toward the right, as if a funnel or growth ramp. Two grey curly braces (stroke about #8C8C8C, about 0.3% of slide width) sit in front of the band: the left brace at about x 29.4% to 34.5%, y 26.7% to 88%, opening toward the central cluster; the right brace at about x 66.9% to 72%, y 26.7% to 88%, opening toward the right cluster. Bubbles (circles, each with a 2-3 px white ring and soft drop shadow): UberX black circle partly cropped off the left edge; Online food delivery large green circle overlapping UberX's lower right; Uber Reserve large black circle; Grocery & Retail green circle overlapping the upper right of Uber Reserve; Hailables orange circle overlapping the lower right of Uber Reserve; a small teal 'And more…' circle at lower left of the central cluster; Advertising pale-blue circle; Enterprise solutions pale-orange circle; Last-mile logistics pale-green circle; a small light-cyan 'And more…' circle; Travel pale-blue circle. Labels are centred in each bubble. Superscript 1 marks footnote 1 after Uber Reserve, Grocery & Retail, and Hailables values. Logo: the Uber wordmark (black, 2048 by 1247 px) at bottom left.
Slide 18
Company Overview
Driving sustainable earnings growth at scale
3-Year Outlook
Gross Bookings Growth
(Constant currency1)
Mid to high teens CAGR
Primarily driven by MAPCs and Trips per
MAPC growth
Adjusted EBITDA2 Growth
High 30s% to 40% CAGR
Healthy profitability expansion, while
opportunistically reinvesting into
longer-term growth
Free Cash Flow2 as %
of Adjusted EBITDA2
(Annual basis)
90%+
Significant and improving Free Cash Flow
conversion
Uber | Investor Update
1. Constant currency growth is calculated by translating our current period financial results using the corresponding prior period’s
monthly exchange rates for our transacted currencies other than the U.S. dollar
2. See Non-GAAP Reconciliations
18
Visuals: Table with 3 columns and 3 data rows plus a header bar. Header bar above column 2 reads '3-Year Outlook' in white on black. Column 1 row labels: 'Gross Bookings Growth (Constant currency1)', 'Adjusted EBITDA2 Growth', 'Free Cash Flow2 as % of Adjusted EBITDA2 (Annual basis)'. Column 2 values, each on a filled cell: row 1 'Mid to high teens CAGR' on navy #002661; row 2 'High 30s% to 40% CAGR' on blue #175BCC; row 3 '90%+' on bright blue #276EF1; all values in white bold. Column 3 descriptions: 'Primarily driven by MAPCs and Trips per MAPC growth'; 'Healthy profitability expansion, while opportunistically reinvesting into longer-term growth'; 'Significant and improving Free Cash Flow conversion'. Horizontal black rules separate the header and each row. One small black Uber wordmark logo (image 2048 by 1247 pixels) at bottom left, unboxed.
Slide 19
Company Overview
What sets us apart
Leading global platform / to go anywhere and get / anything
Category-defining leadership / serving multiple multi-trillion dollar / markets with products leveraging / our technology, infrastructure and / platform
Substantial and / sustainable growth / opportunities
Further penetration of market / opportunities through innovation / and expansion within anchor / categories, with a focus on / sustainable growth
At a financial inflection / turbocharged by / platform benefits
Robust Adjusted EBITDA / generation and Free Cash Flow / conversion driven by operating / leverage, capital discipline, and / structurally lower customer / acquisition costs and higher / lifetime value
Uber | Investor Update
19
Visuals: Three white monochrome icons, one per column, each about 3 percent wide and 5.6 percent tall, sitting above the column headings. Left icon: a circle containing a globe-like grid with a diagonal cross, solid white. Middle icon: an outlined line chart, an L-shaped axis with a rising zigzag trend line ending in an arrow-tip angle, solid white. Right icon: a solid white banknote outline with a central filled circle. Two thin grey vertical divider lines run from about y 28 percent to y 85 percent, at about x 33.3 percent and x 66.6 percent. The Uber wordmark logo in white sits in the footer at bottom left. No photographs or charts.
Slide 20
MOBILITY
Make every journey better
Uber | Investor Update
20
Visuals: Icon: a white solid car pictogram (front-facing sedan with two windows and two wheels) at the top-left corner, about 3.1% wide by 5.6% tall, built from a 512 by 512 pixel image. Logo: the Uber wordmark in white at the bottom-left corner, a 2048 by 1247 pixel image about 4.4% wide by 4.7% tall. Photograph: occupying the right 60.1% of the slide at full height, 1920 by 1280 pixels, so it is cropped at the top and bottom and is full-bleed to the right edge. Subject: a young man with short dark hair in a dark navy crew-neck sweater over a light collared shirt, leaning in from the left to open or enter the rear passenger door of a black sedan. He looks to the left of frame, his right hand is on the car's door frame, and his left hand holds a phone with a teal-green case showing an app screen. In the lower-left of the photograph an olive-green garment or bag is out of focus. Composition: the man is in the left half of the image, the car's rear side window, chrome window trim and door edge run diagonally across the right half, with a shallow depth of field and motion blur on the foreground. Lighting: natural, soft daylight with warm highlights on the car's paintwork and chrome. Dominant colours: black and deep navy, warm amber and brown reflections, olive green, teal on the phone case. No overlay or tint is visible.
Slide 21
Mobility / Industry-leading scale, making every journey better / Growth / ~$70B in Gross Bookings / (+32% YoY)1 / $69B / $42B / 2018 2019 2020 2021 2022 2023 / Profitability / ~$5B in Adjusted EBITDA2 / $5.0B / $1.5B / 2018 2019 2020 2021 2022 2023 / Adj. EBITDA ($) / Adj. EBITDA Margin3 / Market Leadership / Global player operating in >70 countries / 10/10 / Category leader in all top 10 countries / Uber | Investor Update / 1. Growth rate shown on a constant currency basis / 2. See Non-GAAP Reconciliations / 3. Adjusted EBITDA as a % of Gross Bookings / 21
Visuals: Three visuals. (1) Growth column: vertical bar chart, solid blue #276EF1 bars with no gridlines and no y-axis, a black baseline at the bottom, year category labels 2018 to 2023 beneath. Labelled values: 2018 $42B and 2023 $69B; the other bars carry no printed value, so their heights are about $50B (2019), about $26B (2020), about $36B (2021) and about $53B (2022), estimated from bar height against the 2023 bar. No legend and no highlighted points. (2) Profitability column: combined chart with light blue #C9DAF8 vertical bars (Adj. EBITDA, $) and a black smoothed line with black dot markers (Adj. EBITDA Margin, %) on the same baseline. Years 2018 to 2023 under the bars. Labelled values: bar 2018 $1.5B and bar 2023 $5.0B; other bars are unlabelled, so about $2.1B (2019), about $1.2B (2020), about $1.6B (2021) and about $3.3B (2022) are estimates. The margin line has no printed values or axis. Legend below the chart at about 81 percent height: light blue square then 'Adj. EBITDA ($)', black dot then 'Adj. EBITDA Margin' with superscript 3. (3) Market Leadership column: large blue numerals '10/10' as a typographic figure, no chart. No photographs or icons other than the Uber wordmark in the footer.
Slide 22
Mobility / Mobility is firing on all cylinders / Supply / +75% +56% / Drivers1 / Vehicles1 / Demand / +39% +13% / Consumers1 / Trips Per / Consumer1 / New geographies: / “Unlock” markets now delivering $3B Gross / Bookings annual run rate2 / Expanding use cases: / 15% → 30% of Trips on non-UberX products1 / Low cost products: / Moto + Auto account for 13% of consumer first Trips / and 19% of Vehicle first Trips.3 UberX Share / successfully launched in 13 countries / Cost reduction: / Driving down costs like support and payments to / improve leverage ~70bps as a % of Gross / Bookings4 / Uber | Investor Update / 22 / 1. Average monthly in Q4’23 vs. Q4’21 / 2. Q4’23 Gross Bookings annual run rate from Argentina, Germany, Italy, Japan, South Korea, & Spain / 3. As of Q4’23 / 4. Q4’23 vs. Q4’21
Visuals: none. Apart from the typography there is one thin light-grey horizontal rule dividing the metric grid (see elements); no charts, photographs, icons or illustrations. The bottom-left logo is the Uber wordmark, a small raster image.
Slide 23
Mobility
We keep adding fuel to the Mobility growth algorithm
# of / Consumers
×
Trips per / Consumer
×
Gross / Bookings / per Trip
=
Mobility / Gross / Bookings
More Demand
More Supply
# of / Drivers
×
Supply Hours / per Driver
Uber | Investor Update
23
Visuals: Diagram: an equation row of four rounded squares with operators between them. Box 1 is dark blue #1948A3 with white text '# of Consumers'. Box 2 is bright blue #276EF1 with white text 'Trips per Consumer'. Box 3 is light blue #6DAAFB with white text 'Gross Bookings per Trip'. Box 4 is black #000000 with white text 'Mobility Gross Bookings'. Black bold multiplication signs sit between boxes 1 and 2 and between boxes 2 and 3, and a black bold equals sign sits between boxes 3 and 4. Below, two full-width grey #666666 pills labelled 'More Demand' (upper) and 'More Supply' (lower) with white bold text. Grey dashed curved arrows with filled arrowheads run down the left side from the top pill to the bottom pill and back up along the right side, forming a loop. Below, two navy #002661 pills labelled '# of Drivers' and 'Supply Hours per Driver' are joined by a black bold multiplication sign. A small Uber wordmark logo sits in the footer. Boxes and pills carry soft drop shadows.
Slide 24
Mobility
Success in Mobility starts with drivers, the engine of growth
Local, on-the-ground operational execution
has significantly increased our driver base
+75%
Tech innovation and power of the
platform → structural supply advantage
+ Upfront fares & destination
+ Earnings transparency
+ Multi-gig earning opportunities
+ Earnings heatmap
+ Safety features
+ Reserved Trips
+ Deactivation Review Center
Jan’22
Dec’23
Uber | Investor Update
1. Chart reflects monthly active Mobility drivers
24
Visuals: Chart: vertical bar chart of monthly active Mobility drivers, Jan 2022 to Dec 2023, 24 bars (one per month) in solid blue #4285F4-like tone (close to #3C7DF0). Bars rise left to right; first bar is about 15% of chart height, last bar about 100%. No y-axis, no gridlines, no numeric labels on bars. X-axis baseline is a thin black line at about y 90% spanning x 8% to x 42%. Axis labels: 'Jan’22' at the left end and 'Dec’23' at the right end, both bold. A grey (#AFAFAF) elbow arrow starts above the first bar near its top, runs horizontally across the top of the bars and points right to the final bar; callout '+75%' sits above the arrowhead. Highlighted points: first and last bars are the reference points of the arrow. Legend: none. Right side: a phone mockup (black rounded bezel, screen showing a mobile app screen titled 'Choose how you would like to earn', subtitle 'You can always change this later on.', three option cards: 'Delivery' (faded, greyed out, with checkmark), 'Rides' (selected, bold border, blue check, small car illustration, text 'Pick up local passengers and drive them to their desired destination.'), 'Grocery' (partly visible, shopping basket illustration, text 'Perform shopping duties at stores and deliver items to their desired location.'), and a black 'Next' button across the bottom). The phone sits at the lower right of the right column, overlapping nothing, with a soft drop shadow. Uber logo (black wordmark) at bottom left, small.
Slide 25
Mobility
Driver growth will come from both traditional base and new pools of supply
Uber is the platform of choice
in a growing gig economy
Driver Platform Preference1
US
Brazil
UK
Mexico
Uber
Competitor
Uber + Taxi = Better Together
✔ New York City
✔ San Francisco
✔ Los Angeles
✔ Paris
✔ London
✔ Rome
✔ Rio de Janeiro
✔ Cancun
2.5x
Ggrowth in active taxis2
(~5% of overall driver base)
Fleet partnerships add
high-quality and highly
engaged supply
18% of global
supply hours
come from
Fleets3
Compared to non-Fleet supply:
● More supply hours per vehicle
● Higher rate of accepted dispatches
● Lower driver cancellation rate
Uber | Investor Update
1. Preference among multi-apping drivers for Uber vs. main competitor as of Q4’23
2. Average monthly in Q4’23 vs. Q4’21
3. As of Q4’23
25
Visuals: 1) Bar chart (left column), titled 'Driver Platform Preference' with superscript 1, grouped vertical bars, four categories: US, Brazil, UK, Mexico (labels under baseline at y about 77 percent). Two series: Uber (blue) and Competitor (light grey). No axis scale, no axis units, and no printed values; bar heights are relative estimates: US Uber about 62 percent of plot height, Brazil Uber about 55, UK Uber about 68, Mexico Uber about 57; Competitor bars: US about 23, Brazil about 19, UK about 10, Mexico about 20. Baseline is a black horizontal line at y about 76 percent. Legend below at y 82.6 percent: blue square labelled Uber, grey square labelled Competitor. No highlighted points. 2) Checklist of eight blue check marks with city names in two columns: New York City, San Francisco, Los Angeles, Paris; London, Rome, Rio de Janeiro, Cancun. 3) Big number '2.5x' in blue with caption 'Growth in active taxis' (superscript 2) and '(~5% of overall driver base)'. 4) Pie chart (right column), two slices: a dark blue slice of about 18 percent starting at 12 o'clock and running clockwise, and a pale blue remainder of about 82 percent; no labels inside the pie; the 18 percent value is printed beside it in blue. 5) Three-bullet list with black solid dot bullets. 6) Uber logo wordmark in the bottom-left corner. No photographs or illustrations.
Slide 26
Mobility
Even in our most mature markets, we are growing consumers
at a strong pace — with lots of runway left
Matching the higher penetration rates in our portfolio is a tens-of-billions of Gross Bookings opportunity
Monthly consumer penetration
Average monthly consumers1 / Total population 18+
@UK penetration,
US would add
~$13B annual GB
@Mexico penetration,
India would add
~$11B annual GB
20%
10%
0%
Australia
Brazil
UK
Canada
US
Mexico
France
Spain
India
Germany
Q4’23 penetration
Q4’21 penetration
Uber | Investor Update
1. Consumers who took at least one Mobility Trip in a given month
26
Reserve helps us unlock
suburban consumers:
> 40% of Reserve Trips are non-airport
75% of these originate in the suburbs
Visuals: Stacked column chart titled Monthly consumer penetration, subtitle Average monthly consumers (superscript 1) / Total population 18+. Y axis 0% to 20% in 10% steps, no gridlines, unit percent of total population 18+. X axis categories in order: Australia, Brazil, UK, Canada, US, Mexico, France, Spain, India, Germany. Two series per column: Q4’23 penetration (light blue, top segment) and Q4’21 penetration (blue, bottom segment). No values printed on bars; estimates: Australia Q4’21 about 13.5%, Q4’23 about 19%; Brazil Q4’21 about 15%, Q4’23 about 18.5%; UK Q4’21 about 9.6%, Q4’23 about 14%; Canada Q4’21 about 6.9%, Q4’23 about 12%; US Q4’21 about 7%, Q4’23 about 9.9%; Mexico Q4’21 about 7%, Q4’23 about 9.8%; France Q4’21 about 3.4%, Q4’23 about 4.3%; Spain Q4’21 about 1.8%, Q4’23 about 3.3%; India Q4’21 about 0.9%, Q4’23 about 1.6%; Germany Q4’21 about 0.9%, Q4’23 about 1.5%. Two grey (#AFAFAF) elbow arrows with arrowheads: one runs from the top of the US column upward then left, ending at the left pointing to the @UK penetration annotation; the other runs from the top of the India column upward then left, ending at the Mexico column top. Callout box at upper right contains two stat lines with a small blue chevron and a blue elbow arrow linking 40% to 75%. Logo image at bottom left is the Uber wordmark in black.
Slide 27
Mobility
We still have plenty of headroom to increase consumers
across our key use cases
Airports is a $10B business, but we are still
<10% penetrated1 on global airport Trips
Uber for Business serves 170K orgs globally,
but we are still <10% penetrated in the SAM4
Global scale
fuels trial:
New consumers are
2x
more likely to take their first
trip to or from an airport2
Better
product-market fit:
~20%
of US airport drop off Trips
are now on Reserve3
Matching
Fortune 500
capture rates
and wallet share
globally = $12B5
Global Uber for
Business SAM
Total Addressable
Spend Among
Existing Fortune 500
Accounts
Fortune 500
Uber Spend
Illustrative-only
Uber | Investor Update
27
1. Uber airport consumers / total originating + departing airport passengers as reported by OAG
2. Share of total Mobility first Trips which are to/from an airport is 2x vs. share of total Mobility Trips which are to/from an airport
3. As of Q4’23
4. Serviceable addressable market is business spend across U4B-served use-cases in Travel, Eats, Health, Transit, Ops/Logistics
5. Account capture is % of enterprise and mid-market companies signed up for Uber for Business
Visuals: Four visual items. (1) Stat '2x' in large bold blue #276EF1 type, centred in the left column, with caption 'New consumers are' above and 'more likely to take their first trip to or from an airport' with superscript 2 below. (2) Stat '~20%' in large bold blue #276EF1 type, centred in the middle of the left half, with caption 'of US airport drop off Trips are now on Reserve' with superscript 3. (3) Nested circle diagram, no axes: a large pale grey #F3F3F3 circle (about 66.9% to 96.6% x, 36.7% to 89.6% y) labelled 'Global Uber for Business SAM'; inside it a light blue #C9DAF8 circle (about 73.3% to 90.1% x, 59.8% to 89.6% y) labelled 'Total Addressable Spend Among Existing Fortune 500 Accounts'; inside that a solid mid-blue #4285F4 circle (about 78.3% to 85.7% x, 76.5% to 89.7% y) labelled 'Fortune 500 Uber Spend' in white. Circles are bottom-aligned and share a common bottom edge. A small italic caption 'Illustrative-only' sits at lower right of the grey circle. (4) Callout: a rectangle with dotted blue #276EF1 outline (about 52.5% to 64.4% x, 41.6% to 59.7% y) containing 'Matching Fortune 500 capture rates and wallet share globally = $12B' with superscript 5; a dotted blue leader line runs from its right edge down-right to the grey circle. The Uber logo image is a small wordmark at bottom left.
Slides 28 to 82 continue in the full text file.
Download this deck
The hosted PDF of every library deck is free for readers of the SlideDeck Co newsletter. Join with your email and the viewer and download appear here.
Preparing a results presentation or business update of your own? The SlideDeck Co Standard Deck is a slide library for business reviews, updates and plans.







