

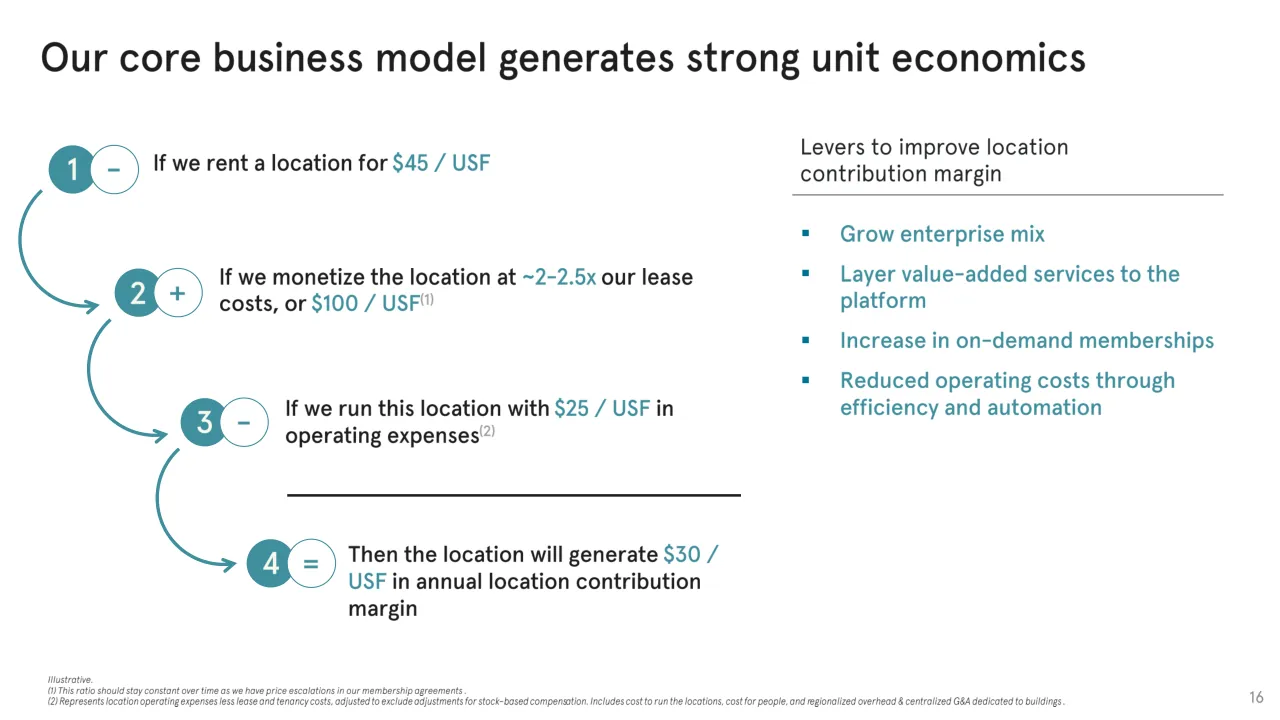
The deck opens with a legal disclaimer and forward-looking statement warnings, then a company overview covering locations, desks, memberships and the flexible workspace model. It moves through its key principles and a strategy shift from founder-led growth to a centralized focus on core WeWork desk business with profitability, then reports operating metrics including occupancy, revenue backlog and net retention. Later sections explain the business model and unit economics, optimize the location fleet by maturity, enterprise mix and market, and show occupancy cohorts for non-mature and mature buildings. An appendix covers KPI definitions, glossary, occupancy trends and non-GAAP reconciliations. The deck closes with a supplementary diligence section that repeats the disclaimer and gives a cohort analysis of top seven markets. Slides showing the location contribution margin walkthrough and the occupancy distribution charts are worth studying for how numbers carry the argument.
Slides worth studying
Questions about this deck
How many locations, desks, cities and countries does The We Company (WeWork) have according to its investor presentation?
Slide 3 states that The We Company has 600 locations, 676K desks, in 122 cities in 32 different countries.
What net retention rate does The We Company (WeWork) report in its investor presentation?
Slide 12 reports a 121% net membership retention rate for the period from September 1, 2018 to September 1, 2019. Slide 4 adds that the company averages ~4% gross churn.
What strategy does The We Company (WeWork) describe in its key principles?
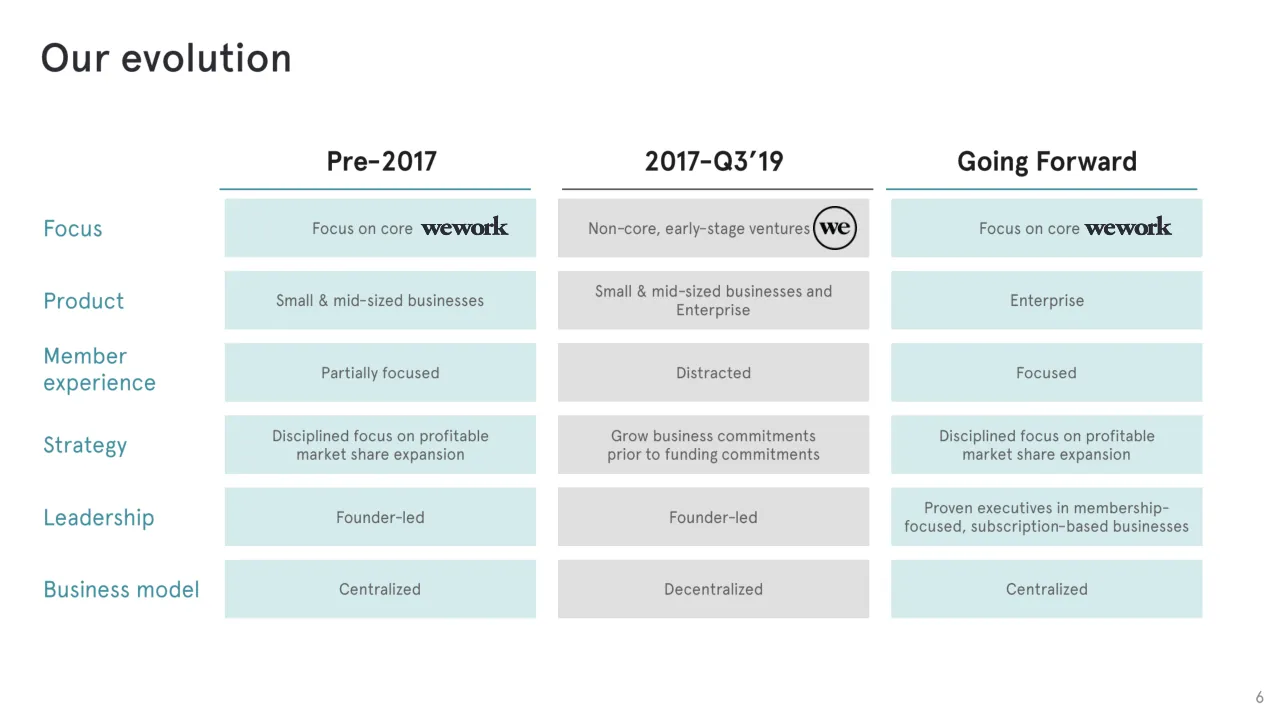
Slide 5 says the company will focus on the core WeWork desk business, prioritize disciplined growth with profitability, and right-size its operations for its long-term strategy. Slide 6 contrasts this with the 2017 to Q3'19 period, when non-core, early-stage ventures were part of the focus.
How many slides does The We Company (WeWork) investor presentation have, and how is it structured?
The deck has 49 slides. It opens with a disclaimer on slide 2, moves through the company overview, key principles and business model, and includes an appendix with KPI definitions, glossary and non-GAAP reconciliations, closing with a supplementary diligence section.
Details
- Company: The We Company (WeWork)
- Year: 2019
- Type: Investor presentation
- Industry: Flexible workspace / Real estate
- Pages: 49
Review score: 7 out of 10, Effective
Presentation quality, judged with the SlideDeck Co review heuristic. Ask, evidence and idea merit are not rated here.
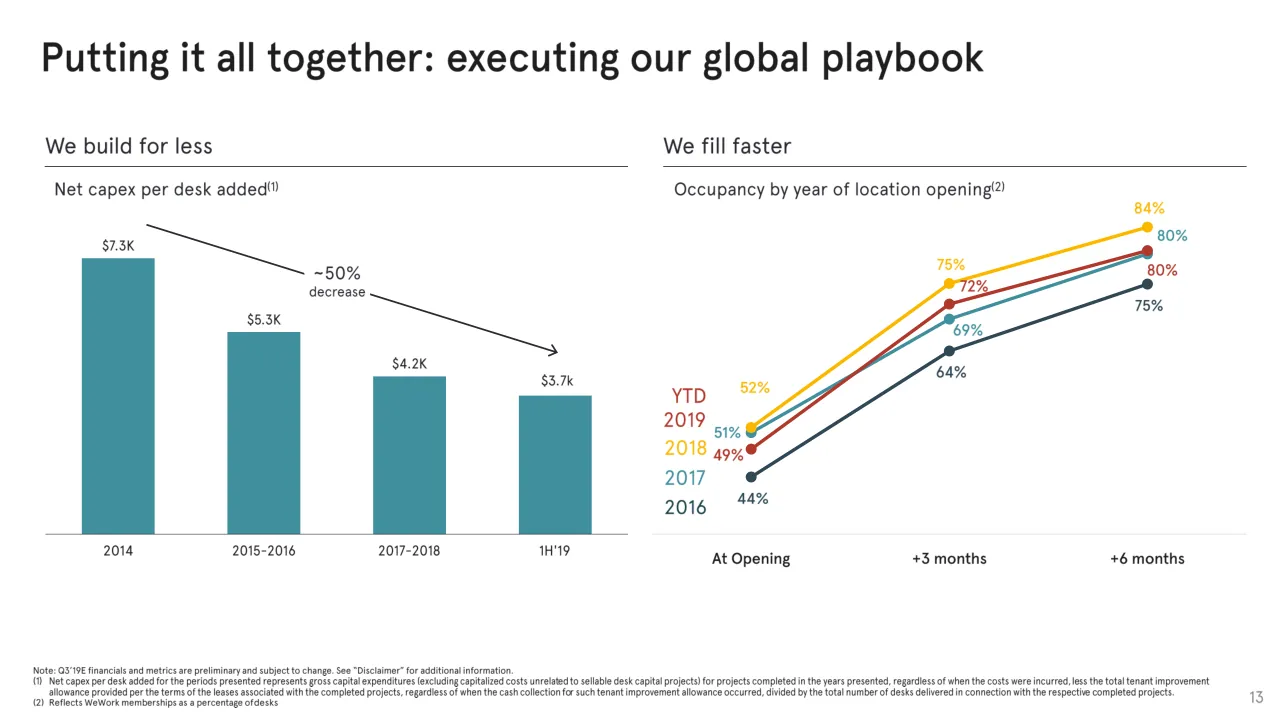
The deck follows a clear route from company overview and strategy shift (slide 6) through metrics, unit economics (slide 16) and fleet maturity, with consistent identity, strong action titles and well-built charts such as slide 13, where direct labels and a stated takeaway carry the point. Weaknesses are consequential: slides 2, 34 and 47 are full-page legal text, the footnotes on most pages are too small to read, and the appendix reconciliations (slides 30 to 32, 41 to 43) are dense tables with no emphasis. Several analytic slides (20, 22, 23, 29) pack many small charts with tiny labels, so the audience must work to find the point, though this suits a read-ahead investor document.
Worth keeping: Keep the unit-economics walkthrough on slide 16, the before-and-after build and fill charts on slide 13, and the three-column evolution table on slide 6, which use one accent colour and direct takeaways.
Most useful repair: Shrink or move the disclaimers to one back page, enlarge footnotes, and add a highlighted key row or callout to the reconciliation tables so the reader sees the figure that matters.
What would change the score: I would raise the minimum text size and cut the multi-panel slides 20, 22 and 23 down to one message each with an action title.
Confidence medium. 49 of 49 pages inspected on contact sheets, 4 at readable size. Reviewed 2026-11-08. Model-assisted review (claude-sonnet-5-5).
Full text of the slides (49 slides)
Every slide's words and a description of its charts and images, so the deck can be searched and rebuilt. Also available as Markdown.
Slide 1
wework / Investor Presentation / October 11, 2019
Visuals: One logo: the white lowercase 'wework' wordmark in a bold, high-contrast serif, placed at about x 36.4%, y 38.7%, w 27.6%, h 10.1%. Two placed 2 by 2 pixel images at x 28.6%, y 55.0%, w 44.9%, h 9.4% and x 40.9%, y 65.4%, w 19.3%, h 5.1%. At that size they read as flat single-colour fills (near-background or white), not photographs, and they are not visible as content. No photographs, charts, or icons.
Slide 2
Disclaimer / The information contained in this presentation is solely for the purpose of familiarizing potential investors with The We Company (“The We Company” or the “Company”), and is subject to completion and amendment and is not investment advice. Concurrently with being provided this presentation, you are being given access to a data room maintained by the Company for more complete information about the Company and the offering. It is strongly recommended that you review, and you will be deemed to have reviewed, all of documents and other information in the data room before making an investment decision. / This presentation is being provided solely for your confidential use with the express understanding that you will not release any portion of this document, discuss the information contained herein, or make reproductions of or use this presentation for any other purpose without the prior express written permission of the Company. This presentation is being provided to you on the condition that you are agreeing to hold it in strict confidence and in accordance with the confidentiality agreement entered into with the Company, as well as that you are agreeing to abide by the terms of this legend. / This presentation contains “forward-looking statements”. These statements are often, but not always, made through the use of words or phrases such as “may”, “should”, “could”, “predict”, “potential”, “believe”, “will likely result”, “expect”, “continue”, “will”, “anticipate”, “seek”, “estimate”, “intend”, “plan”, “projection”, “would” and “outlook”, or the negative version of those words or phrases or other comparable words or phrases of a future or forward-looking nature. These forward-looking statements include, but are not limited to, statements concerning the following: our expectations regarding financial performance, including but not limited to revenue, expenses, potential profitability, backlog, run-rate revenue, non-GAAP measures and other results of operations; our expectations regarding future operating performance, including but not limited to our expectations regarding future locations, scale, desk capacity, memberships and enterprise membership percentage and retention rate; and statements regarding financing arrangements, including outstanding funding commitments and the timing and terms on which such commitments may be funded. These forward-looking statements are not historical facts, and are based on current expectations, estimates and projections about our industry as well as certain assumptions made by management, many of which, by their nature, are inherently uncertain and beyond our control. It is not possible for us to predict all risks, nor can we assess the impact of all factors on our business or the extent to which any factor, or combination of factors, may cause actual results to differ materially from those contained in any forward-looking statements we may make. In light of these risks, uncertainties and assumptions, the future events and trends discussed in this presentation, and our future levels of activity and performance, may not occur and actual results could differ materially and adversely from those anticipated or implied in the forward-looking statements. Any forward-looking statement speaks only as of the date on which it is made, and we do not undertake any obligation to publicly update or revise any forward-looking statement, whether as a result of new information, future developments or otherwise, except as required by law. / This presentation also contains certain estimates of financial results and metrics as of and for the three months and nine months ended September 30, 2019. No representation can be or is being made with respect to those estimates, and you should not rely on such estimates. Neither the Company’s independent auditors nor any other third party has examined, reviewed or compiled these results or metrics nor expresses an opinion or other form of assurance with respect thereto. The estimates as of and for the three months and nine months ended September 30, 2019 are preliminary, based on management’s current expectations, but are subject to change, including between now and at such time as final results are released. You must make your own determinations as to the reasonableness of these estimates and should also note that if one or more assumptions are not met, these estimates may not be achieved. In addition, to the extent this presentation contains any projections, estimates or statements with respect to the Company’s future results or future events, such information is based on current management estimates and assumptions, some of which may not materialize or may change, and is subject to risks and uncertainties over which the Company has no control or ability to predict. Unanticipated events may occur that could affect the outcome of such projections, estimates and statements. You must make your own determinations as to the reasonableness of these projections, estimates and statements and should also note that if one or more estimates change, or one or more assumptions are not met, or one or more unexpected events occur, the performance and results set forth in such projections, estimates and statements may not be achieved. The Company can give no assurance as to its future operations, performance, results or events. / This presentation contains information concerning our solutions and our industry, including market size and growth rates of the markets in which we participate, that are based on industry surveys and publications or other publicly available information, other third-party survey data and research reports commissioned by us and our internal sources. This information involves many assumptions and limitations, and you are cautioned not to give undue weight to this information. We have not independently verified this third-party information. Similarly, other third-party survey data and research reports commissioned by us, while believed by us to be reliable, are based on limited sample sizes and have not been independently verified by us. In addition, projections, assumptions and estimates of the future performance of the industry in which we operate and our future performance are necessarily subject to uncertainty and risk due to a variety of factors, including those described above. These and other factors could cause results to differ materially from those expressed in the estimates made by independent parties and by us. / This presentation includes certain financial measures not presented in accordance with generally accepted accounting principles in the United States (“GAAP”), including Location Contribution Margin, Adjusted EBITDA and Other Adjusted Location Operating Expenses. These financial measures are not measures of financial performance in accordance with GAAP and may exclude items that are significant in understanding and assessing the Company’s financial results. Therefore, these measures should not be considered in isolation or as an alternative to net loss or other measures of profitability, liquidity or performance under GAAP. You should be aware that the Company’s presentation of these measures may not be comparable to similarly titled measures used by other companies, which may be defined and calculated differently. See the appendix for a reconciliation of certain of these non-GAAP measures to the most directly comparable GAAP measure. / The brands and logos included herein are the property of third-party owners and are used for informational purposes only. Such use should not be considered an endorsement of the third-party owner or its services and should not be considered endorsement of the products or services of the Company by the third-party owner. / 2
Slide 3
This is our company / We have 600 locations, 676K desks, in 122 cities in 32 different countries / Flexible workspace is a market-validated real estate solution that has been around for decades / Conventional wisdom is that flexible workspace will have a small, but growing place in the global real estate market due to its evidenced sustained tenant demand / We think we do it better than anyone because of our member experience and scale — and we have the market share and occupancy to prove it / We’ve invested $6B(1) to create our current franchise over the past 5 years / What that means: We run or have pipeline visibility on 969K desks, excluding our international JVs / — 182K mature desks / — 337K non-mature desks / — 451K desks in development / Our business is 43% Enterprise / 57% small & mid-sized businesses (“SMB”) / Enterprise is a more intuitive business, but our SMB business continues to be very strong because small businesses are the most poorly served businesses by the traditional lease-based real estate market / Our members like us because they get space from us at a ~66%(2) discount to their alternatives, and their employees prefer the environment to traditional offices / Note: All metrics reflect Whole excluding India, unless otherwise noted; Q3’19E financials and metrics are preliminary and subject to change. See “Disclaimer” for additional information. Components may not add due to rounding. / (1) Represents gross capital expenditures from FY 2014 through Q2 ’19 / (2) Building Owners and Managers Association (BOMA); CoStar Office Market Statistics; International Facility Management Association (IFMA); CBRE Office Occupancy Costs and Cushman Global Occupancy Report 2017. Represents cost savings relative to standard-lease and custom buildout. Comparison data represents annualized costs based on an average of ten select city centers in the United States, Europe, South America and Asia. “Standard lease” includes the costs associated with food and beverage, events, utilities, insurance, property taxes, facilities management and base rent. “Build-out” includes the costs associated with construction, procurement and design services offset by a tenant improvement allowance and amortized over the illustrative five year lease. / 3
Slide 4
This is our company (cont’d)
We can offer space more affordably while charging ~2-2.5x our lease cost because we:
Buy in bulk
Have a scaled construction platform with standardized build-out procedures
Receive subsidies from landlords
Utilize square footage more efficiently than any lessor we know of, while curating the space to optimize member experience
We average ~4% gross churn, but have a net member retention rate of 121% driven by existing member firms who want more space
Landlords like us because we aggregate demand, can close quickly, and improve the perception of their building
Keep topics of focus:
Our vision for the business
Our unit economics
Our cost structure
Our new location occupancy and sales cadence
Our strategy for managing a recession
We want you to feel the confidence we do about how we intend to fill our pipeline of buildings in a profitable manner
4
Slide 5
Key principles / 1 / We remain committed to our members, our employees, our landlord partners and our investors / 2 / Our unparalleled expansion, global brand, best-in-class product, and unique value proposition have enabled us / to secure a first-mover advantage in a growing category, while our business structure is designed and expected / to provide resiliency across business cycles / 3 / We will focus on the core WeWork desk business, prioritize disciplined growth with profitability, and right-size / our operations to account for this long-term strategy / 4 / Our business model has strong underlying economics – our locations generate recurring revenues and consistent / cash flows, which we expect will only improve as our portfolio matures and our enterprise offering grows / 5 / Our management team has a proven track record of leading membership-based businesses, has worked closely / together over the past few years, and is excited to execute on our new strategy / 5
Visuals: None apart from five filled teal circular number badges (1 to 5) in a left column, each about 2.8% of slide width and 5% of slide height, with white numerals. No photographs, charts, tables, icons or logos.
Slide 6
Our evolution
Pre–2017
2017–Q3’19
Going Forward
Focus
Focus on core wework
Non-core, early-stage ventures we
Focus on core wework
Product
Small & mid-sized businesses
Small & mid-sized businesses and Enterprise
Enterprise
Member experience
Partially focused
Distracted
Focused
Strategy
Disciplined focus on profitable market share expansion
Grow business commitments prior to funding commitments
Disciplined focus on profitable market share expansion
Leadership
Founder-led
Founder-led
Proven executives in membership-focused, subscription-based businesses
Business model
Centralized
Decentralized
Centralized
6
Visuals: Table-style comparison grid, six rows by three columns with a row-label column. Column headers: Pre–2017, 2017–Q3’19, Going Forward. Row labels: Focus, Product, Member experience, Strategy, Leadership, Business model. Cell values: Focus row: Pre–2017 'Focus on core' followed by the wework wordmark; 2017–Q3’19 'Non-core, early-stage ventures' followed by the circled 'we' logo; Going Forward 'Focus on core' followed by the wework wordmark. Product row: Small & mid-sized businesses / Small & mid-sized businesses and Enterprise / Enterprise. Member experience row: Partially focused / Distracted / Focused. Strategy row: Disciplined focus on profitable market share expansion / Grow business commitments prior to funding commitments / Disciplined focus on profitable market share expansion. Leadership row: Founder-led / Founder-led / Proven executives in membership-focused, subscription-based businesses. Business model row: Centralized / Decentralized / Centralized. Logos: three, the wework wordmark in dark charcoal serif lowercase bold (two instances, about 7% of slide width each) and the 'we' mark, a black serif 'we' inside a black circle outline about 3.3% by 5.9% of slide. Header rules: teal #3A8FA0 under Pre–2017 and Going Forward, dark grey #555555 under 2017–Q3’19, each about 0.3% of slide height thick. Cell fills are flat with no imagery.
Slide 7
90-day game plan
Focus on business
Focus on
core WeWork
desk business
in select target markets
Reduction
in headcount across Ventures,
G&A and growth-related
functions
Community
teams will not be impacted
Desk openings
will reach record high in Q4
Expand relationships with
~3,350
existing WeWork
enterprises(2)
Reenergize
employees
Realign
performance incentives
Partner
with landlords, enterprises, and
cities
Divest
non-core businesses(1):
Note: All metrics reflect WholeCo excluding India, unless otherwise noted
(1) In October 2019 we communicated to investors that we were closing RISE. We are now reevaluating our decision.
(2) Enterprise list as of September 30, 2019.
7
Visuals: Seven company logos in the lower left of column one, arranged in three rows below the 'non-core businesses(1):' line. Row one: Conductor (green dot-cluster mark with black lowercase wordmark), The Wing (black stylised W mark above small caps 'THE WING'), Managed by Q (black Q mark above tiny 'MANAGED BY Q'). Row two: Meetup (red-pink script wordmark), Space IQ (orange hexagon mark with orange wordmark 'Space IQ'). Row three: tesm (yellow lowercase wordmark), WAVE GARDEN (black bold stacked caps wordmark). Each logo is on white with no boxes or shadows. No photographs or charts.
Slide 8
Despite the noise, we have continued to perform
Metrics represent WholeCo as of Q3'19, excluding India, unless otherwise noted
Locations / & Desks
• 600 locations across 122 cities, 32 countries, and six continents as of Q3'19
• Added record 108k desks in Q3'19, a +119% YoY increase
• 676k total desks as of September '19
Occupancy / & Memberships
• Reached 580K memberships (539K WeWork memberships + 42K On-demand memberships)
• 43% of total memberships were enterprise, a +3 point increase QoQ
• Occupancy declined to 80% in Q3'19 (vs. 83% in Q2 '19), driven by record increase in desk adds
• Mature location occupancy dipped to 87% in Q3'19 (vs. 89% in Q2 '19) driven by China (Naked Hub) + Pacific / locations
– Excluding China, mature location occupancy was 88%
Revenue / & Backlog
• Run-rate revenue(1) increased by +106% YoY to $4.1B, WeWork run-rate revenue of $3.3B, up 77% YoY
• Revenue backlog increases due to growth in enterprise, record Q3'19 TCV sales and desk sales, and longer signed / commitments(2)
– Q3'19E revenue backlog(1) estimated to have increased by +$300M QoQ to $4.3B – an 8x increase since Q4 '17
– Desk sales of 167K in Q3'19, up 37% YoY and compared to 152K in Q2 '19(1)(2)
– Total contract value sold in Q3'19 of $1.5B, up 69% YoY and compared to $1.4B in Q2 '19(1)(2)
• Commitment lengths increased to 23 months for enterprise members (compared to 20 months in 2018) and 14 / months for non-enterprise members (compared to 9 months in 2018)
Note: Q3'19E financials and metrics are preliminary and subject to change. See “Disclaimer” for additional information. Components may not add due to rounding. See definitions in the back.
(1) Includes India
(2) Figures have been revised downward since providing this information to investors on October 10, 2019. Desk and total contract value sales are subject to change after quarter close due to changes in membership agreements and cancellations that had not yet been reflected.
8
Visuals: No photographs, charts, tables, logos or icons. Three solid rectangular label blocks act as shapes: teal #408F9E at top (Locations & Desks), dark slate #304957 in the middle (Occupancy & Memberships), and mid-gray #A0A0A0 at bottom (Revenue & Backlog), each with white centred label text. Superscript reference numbers (1) and (2) appear inline in the bullets.
Slide 9
Where we are
Metrics represent Q3'19 WholeCo, excluding India, unless otherwise indicated
Global network & brand
Scale
Member-centric
600
Locations
676K
Desks
580K
Total Memberships
122
32
Cities
Countries
$4.2B
Run-rate revenue(1)
43%
Enterprise Membership
Percentage
6
Continents
$4.3B
Revenue backlog(1)
121%
Net retention rate(2)
Note: Metrics represent WholeCo, excluding India, as of Q3'19E financials. Q3'19E financials and metrics are preliminary and subject to change. See “Disclaimer” for additional information.
(1) Including India
(2) Represents September 1, 2018 to September 1, 2019
9
Visuals: Three small line icons sit at the bottom of the columns, one per column. (1) Under Global network & brand: a filled teal globe showing the Americas, about 5% wide and 9% tall, centred in column 1. (2) Under Scale: a solid dark slate office tower icon, a multi-storey building with rows of rectangular windows and two lower wings, about 9% wide and 16% tall, centred in column 2. (3) Under Member-centric: an outline grey icon of a desk row with two office chairs, a circular clock with an upward arrow above, and a potted plant at right, about 10% wide and 12% tall. No charts or photographs. Colours: teal #408F9E and #1F6F7F for globe, slate #304957 for building, grey #616161 for the outline icon.
Slide 10
Solutions for companies of all sizes
Small business / (1–19 employees)
Medium business / (20–499 employees)
Enterprise / (500+ employees)
Limited credit / No design / build capabilities
No head of real estate / Limited visibility
Fixed cost and term / Enhanced culture / Global, scalable solution
57%
of total memberships
43%
of total memberships
Note: Metrics represent WholeCo, excluding India, as of Q3'19
10
Visuals: Three photographs and two drawn shapes. (1) Small business photo, about 24% width by 42.7% height, boxed with square corners, no overlay: an indoor atrium with large fiddle-leaf plants and palms, a blue wall with a staircase behind, and beige columns; a man in a light blue shirt sits with an open silver laptop on a dark grey built-in bench sofa, with two cane-seat chairs in the foreground and a small round grey side table; warm daylight from above, dominant colours green, blue, beige and grey. (2) Medium business photo, about 24% width by 42.5% height, boxed, no overlay: a meeting room with a white wall-mounted whiteboard covered in handwriting, a long table with a red-edged top and yellow-orange chairs, several people standing and seated (a man in dark shirt standing, a woman in white top at the whiteboard, a bald man and a woman with laptops at the table), two black-and-orange pendant lamps overhead, daylight from a large window on the right; dominant colours white, red, orange and grey. (3) Enterprise photo, about 25% width by 42.7% height, boxed, no overlay: an open-plan lounge with a long dark grey wooden table and tan chairs in the foreground, a tablet on a stand, an orange drink glass, a man in a grey blazer on a phone, other people standing in the background, black globe pendant lights, floor-to-ceiling windows showing a city skyline; dominant colours grey, tan, white and orange. (4) A teal plus sign, about 3.8% wide by 6.5% tall, solid #3A8A9A, centred vertically between the medium and enterprise photos. (5) A teal curly brace, about 50% wide by 4.8% tall, stroke #3A8A9A about 2 px, opening upward, spanning from the left edge of the small photo to the right edge of the medium photo, with its point centred between the two columns and pointing down toward the 57% figure.
Slide 11
Better day at work for less
Better place to work(1)
80%
of members report
increased productivity
since joining WeWork
78%
of enterprise members say
we have helped them
attract
and retain talent
Enhanced flexibility for specific real estate needs
15 years
Shorter
lease
term
Complete
flexibility
Illustrative Enterprise
Lease Term (2)
wework
FIXED
VARIABLE
New lease accounting standards may further incentivize
CFOs to sign flexible / short-term commitments
WeWork vs standard lease cost per employee
10 representative city centers in the United States, Europe, South America and Asia
$21,594
66%
savings
Buildout:
Construction
Procurement
Operations:
Base rent
Maintenance
Cleaning
Printing
Utilities
Insurance
Property tax
F&B
Events
Design
$4,436
$17,158
$7,304
Standard lease
+ Buildout
+ Operations(3)
wework(4)
(1) Source: Global Impact Report commissioned by us and produced in partnership with HR&A Advisors, Inc. (“Global Impact Report”) and WeWork member census.
(2) Represents average term of our leases with third party landlords.
(3) Sources: Building Owners and Managers Association (BOMA); CoStar Office Market Statistics; International Facility Management Association (IFMA); CBRE Office Occupancy Costs; Cushman Global Occupancy Report 2017; and third-party research. Comparison data represents annualized costs based on an average of ten select city centers in the United States, Europe, South America and Asia that are representative of our key markets. “Standard lease” includes the costs associated with food and beverage, events, utilities, insurance, property taxes, facilities management and base rent. “Build-out” includes the costs associated with construction, procurement and design services offset by a tenant improvement allowance amortized over an illustrative five-year lease.
(4) Represents average revenue per WeWork membership for the six months ended June 30, 2019 across the same ten select city centers as above.
11
Visuals: Three graphics. (1) Left: two large percentage statistics, no chart. (2) Middle: a simple two-bar comparison chart with no axes or scale, baseline drawn under both bars. Left bar is dark teal #006178, labelled '15 years' above and 'Illustrative Enterprise Lease Term (2)' below, with the label FIXED beneath in dark teal. Right bar is light blue #8FD3DF, labelled 'Complete flexibility' above and the wework logo below, with the label VARIABLE beneath in light blue #56B4D2. A thin black annotation arrow runs from the top of the tall bar to the top of the short bar, with the words 'Shorter lease term' sitting on it; a short horizontal arrow runs from FIXED to VARIABLE. (3) Right: a stacked bar chart with no axis scale. Total bar for 'Standard lease + Buildout + Operations' is $21,594 at top, split into a top teal segment #408F9E labelled $4,436 (Buildout: Construction, Procurement) and a larger dark teal segment #306B76 labelled $17,158 (Operations: Base rent, Maintenance, Cleaning, Printing, Utilities, Insurance, Property tax, F&B, Events, Design), with curly brackets beside each group. A second, shorter light bar #ADD6DE labelled $7,304 sits beside it under the wework logo. A thin black arrow runs from the $21,594 label down to the $7,304 label, with the '66% savings' callout in bright blue #1A9BD2 at top right, joined to the total bar by a short leader line. The category labels are 'Standard lease + Buildout + Operations(3)' and 'wework(4)'. No values are estimated; all are printed.
Slide 12
Our members grow with us
121%
Net membership
Retention Rate(1)
Memberships
Sept. 2018
Sept. 2019
Memberships attributable to memberships that joined in:
Pre-2016
2016
2017
2018
2019
Note: Q3'19E financials and metrics are preliminary and subject to change. See “Disclaimer” for additional information.
(1) Our net retention rate of 121% for the period from September 1, 2018 to September 1, 2019 illustrates our ability to increase the penetration of our existing member organizations over the last year. It measures the net impact of member organizations who joined from January 1, 2016 to September 1, 2018 who increased, reduced or cancelled WeWork memberships throughout the period from September 1, 2018 to September 1, 2019, but excludes WeWork memberships from our IndiaCo locations.
12
Visuals: Chart: stacked area chart, five series, showing membership growth. No axis numbers, scale ticks or units are printed on the slide. The y-axis is titled Memberships (rotated 90 degrees, reading upward). The x-axis is unlabelled except for two tick labels, Sept. 2018 at about 50% of the chart width under a vertical divider line, and Sept. 2019 at the right edge. Series from bottom to top: Pre-2016 (grey #9E9E9E, lowest band, about 6% of slide height at right edge), 2016 (pale blue-grey #CFDDE4), 2017 (light steel blue #9EBACA), 2018 (mid steel blue #6E98AF), 2019 (dark slate #304957 at top, widening sharply after about 2019 mark). Each band thickens left to right, with total height rising from about 20% of plot height at the left to the full height at the right. No data labels or printed values exist apart from the 121% callout. Highlighted: the 121% callout in large dark slate type; the vertical divider at about 50% x marks the Sept. 2018 boundary. Legend: label 'Memberships attributable to memberships that joined in:' followed by five square swatches with labels: Pre-2016 (#9E9E9E), 2016 (#CFDDE4), 2017 (#9EBACA), 2018 (#6E98AF), 2019 (#004D52 dark teal). Composition: chart fills the middle band, horizontally spanning, no border, no gridlines.
Slide 13
Putting it all together: executing our global playbook
We build for less
We fill faster
Net capex per desk added(1)
Occupancy by year of location opening(2)
$7.3K
$5.3K
$4.2K
$3.7k
~50%
decrease
2014
2015-2016
2017-2018
1H'19
YTD
2019
2018
2017
2016
52%
75%
84%
80%
80%
72%
69%
51%
49%
44%
64%
75%
At Opening
+3 months
+6 months
Note: Q3'19E financials and metrics are preliminary and subject to change. See “Disclaimer” for additional information.
(1) Net capex per desk added for the periods presented represents gross capital expenditures (excluding capitalized costs unrelated to sellable desk capital projects) for projects completed in the years presented, regardless of when the costs were incurred, less the total tenant improvement allowance provided per the terms of the leases associated with the completed projects, regardless of when the cash collection for such tenant improvement allowance occurred, divided by the total number of desks delivered in connection with the respective completed projects.
(2) Reflects WeWork memberships as a percentage of desks
13
Visuals: Two charts. Left: vertical bar chart titled 'Net capex per desk added(1)', four teal bars with no y-axis or gridlines and value labels above each bar: 2014 $7.3K, 2015-2016 $5.3K, 2017-2018 $4.2K, 1H'19 $3.7k; x-axis categories 2014, 2015-2016, 2017-2018, 1H'19; a dark charcoal (#2B2B33) curved-free straight arrow runs diagonally from above the first bar down to above the last bar, labelled '~50%' over 'decrease'. Right: line chart titled 'Occupancy by year of location opening(2)', y-axis unlabelled, x-axis categories At Opening, +3 months, +6 months; four series with markers and labelled values: 2018 (yellow #F5B800) 52%, 75%, 84%; 2017 (teal #3F93A3) 51%, 69%, 80%; YTD 2019 (red #C0392B) 49%, 72%, 80%; 2016 (navy #1F3A4D) 44%, 64%, 75%. Legend is a vertical stack of coloured year labels at the left of the line chart, ordered YTD 2019, 2018, 2017, 2016 from top to bottom, each in its series colour. No points are highlighted beyond the labelled values; no axis ranges are printed.
Slide 14
As our locations mature, occupancy improvements drive location
contribution margin expansion
Occupancy
Location contribution margin(1)
Location contribution
margin per desk(1)
80%
69%
84%
90%
89%
Total Consolidated
0-6
months
7-12
months
13-24
months
24+
months
10%
0-6
months
5%
17%
21%
Total Consolidated
7-12
months
13-24
months
24+
months
(24%)
$253
0-6
months
$121
$447
$707
Total Consolidated
7-12
months
13-24
months
24+
months
($402)
Non-cash GAAP straight-line lease cost as a % of membership and service revenue
15%
44%
21%
12%
4%
Benefit of non-cash amortization of lease incentives as a
% of membership and service revenue
(5%)
(8%)
(4%)
(5%)
(5%)
Note: Charts represent 1H'19 figures
(1) Defined as membership and service revenue less location operating expenses excluding stock-based compensation; please reference non-GAAP reconciliations in Appendix
14
Visuals: Three vertical bar charts with category axes. Panel 1 Occupancy: column chart, Total Consolidated 80% (dark bar) followed by 0-6 months 69%, 7-12 months 84%, 13-24 months 90%, 24+ months 89%; reference dashed amber line at about 80%. Panel 2 Location contribution margin (1), percent: Total Consolidated 10% (dark bar), 0-6 months (24%) as a negative bar below the baseline, 7-12 months 5%, 13-24 months 17%, 24+ months 21%; dashed amber reference line at about 10%. Panel 3 Location contribution margin per desk (1), US dollars: Total Consolidated $253 (dark bar), 0-6 months ($402) negative bar, 7-12 months $121, 13-24 months $447, 24+ months $707; dashed amber reference line at about $253. No axis scales or gridlines are printed. Under panels 1 and 2 a two-row value table: row 1 'Non-cash GAAP straight-line lease cost as a % of membership and service revenue' with values 15% (Total Consolidated), 44% (0-6 months), 21% (7-12 months), 12% (13-24 months), 4% (24+ months); row 2 'Benefit of non-cash amortization of lease incentives as a % of membership and service revenue' with values (5%), (8%), (4%), (5%), (5%) in the same columns. Highlighted points: the Total Consolidated bars and the amber dashed reference lines. No legend, no photographs, no logos.
Slide 15
Our Business Model
Slide 16
Our core business model generates strong unit economics / 1 - / If we rent a location for $45 / USF / 2 + / If we monetize the location at ~2-2.5x our lease costs, or $100 / USF(1) / 3 - / If we run this location with $25 / USF in operating expenses(2) / 4 = / Then the location will generate $30 / USF in annual location contribution margin / Levers to improve location contribution margin / ▪ Grow enterprise mix / ▪ Layer value-added services to the platform / ▪ Increase in on-demand memberships / ▪ Reduced operating costs through efficiency and automation / Illustrative. / (1) This ratio should stay constant over time as we have price escalations in our membership agreements . / (2) Represents location operating expenses less lease and tenancy costs, adjusted to exclude adjustments for stock-based compensation. Includes cost to run the locations, cost for people, and regionalized overhead & centralized G&A dedicated to buildings . / 16
Visuals: Diagram: four step nodes connected by curved arrows that run from the lower-left of each node down and right to the next node. Node 1 is a filled teal circle with white numeral 1 next to an outlined white circle containing a minus sign. Node 2 is a filled teal circle with white numeral 2 next to an outlined circle containing a plus sign. Node 3 is a filled teal circle with white numeral 3 next to an outlined circle containing a minus sign. Node 4 is a filled teal circle with white numeral 4 next to an outlined circle containing an equals sign. Arrows are teal #408F9E curves about 2.5 pt thick with arrowheads pointing at the next node. A solid black horizontal line about 0.3% of slide height thick sits between node 3 and node 4, spanning from about 22.4% to 57.9% of width. Three thin filled squares are not visible; the bullets are teal square glyphs.
Slide 17
Revenue building blocks / How WeWork desks generate revenue / Based on September 2019 / 676K / desks / 80% / Total Occupancy / × / 539K / WeWork Memberships / × / $514 / ARPM(1) / × 12 / WeWork Run-rate Revenue(2) / WeWork run-rate revenue(2) / 74% YoY WeWork Growth / $0.7B / $0.8B / $1.0B / $1.1B / $1.4B / $1.6B / $1.9B / $2.2B / $2.7B / $3.0B / $3.4B / 1Q17 / 2Q17 / 3Q17 / 4Q17 / 1Q18 / 2Q18 / 3Q18 / 4Q18 / 1Q19 / 2Q19 / 3Q19E / Ventures / 0.0B / 0.0B / 0.1B / 0.0B / 0.1B / 0.2B / 0.1B / 0.2B / 0.3B / 0.4B / 0.8B / Total / 0.7B / 0.8B / 1.1B / 1.1B / 1.5B / 1.8B / 2.0B / 2.4B / 3.0B / 3.3B / 4.2B / Note: Figures as of September 2019; total desks and physical memberships exclude India; financial figures represent WholeCo (including JVs). Q3'19E financials and metrics are preliminary and subject to change. See "Disclaimer" for additional information. / (1) Implied average membership and services revenue per physical membership. Includes IndiaCo. / (2) Run-rate revenue represents monthly membership and services revenue multiplied by 12 (E.g. September 2019 run-rate revenue represents September 2019 revenue multiplied by 12). Includes India. / 17
Visuals: Chart: vertical column chart titled 'WeWork run-rate revenue(2)', x-axis of quarters 1Q17 to 3Q19E, y-axis in US$ billions (no visible axis, values printed on bars), linear scale with bar heights proportional to values. Series 'Run-rate revenue' values printed on bars: 1Q17 $0.7B, 2Q17 $0.8B, 3Q17 $1.0B, 4Q17 $1.1B, 1Q18 $1.4B, 2Q18 $1.6B, 3Q18 $1.9B, 4Q18 $2.2B, 1Q19 $2.7B, 2Q19 $3.0B, 3Q19E $3.4B. Bars 1Q17 to 2Q19 are teal #408F9E; the 3Q19E bar is light blue #ADD6DE and is the only estimate. Callout: dashed yellow #FCB800 rectangle reading '74% YoY WeWork Growth' with a yellow arrow pointing up and right from the bar tops toward the top right. Table beneath the chart: rows 'Ventures' (0.0B, 0.0B, 0.1B, 0.0B, 0.1B, 0.2B, 0.1B, 0.2B, 0.3B, 0.4B, 0.8B) and 'Total' (0.7B, 0.8B, 1.1B, 1.1B, 1.5B, 1.8B, 2.0B, 2.4B, 3.0B, 3.3B, 4.2B) aligned under the quarter labels; the Total row has a light blue-grey fill #CBDAE0 with dark rules. Left formula diagram: '676K' desks × '80%' Total Occupancy (boxed in yellow outline) → downward dark triangle → '539K' WeWork Memberships × '$514' ARPM(1) (boxed in yellow outline) × 12 → downward dark triangle → 'WeWork Run-rate Revenue(2)'. Multiplication signs are bold dark-slate X glyphs #304957; the × before 12 is smaller and grey. Lighting and photography: none, flat vector graphics.
Slide 18
How we define location contribution margin
1H 2019
(in millions)
$1,349
Excludes benefit of / TI amortization of / $69mm
($707)
($371)
($198)
$69
$142
Membership & / service / revenue
Cash lease / costs(1)
Other adjusted / location / operating / expenses(2)
Impact of non- / cash straight-line / lease cost / adjustment
Benefit of / non-cash / amortization / of lease / incentives (3)
Location / contribution / margin
2x Rev. / Rent / Multiplier
% membership & / service revenue:
(52%)
(28%)
(15%)
5%
10%
Membership and service revenue
+ Monthly fees we collect from members
+ Incremental services revenue (IT, printing, etc.)
Building costs
– Cash lease costs represent cash rent and tenancy / costs we pay landlords
– Other adj. location opex(2)
• Costs for people that run the buildings (e.g., / Community Team)
• Costs to operate the buildings (e.g., utilities, / consumables, cleaning, member tech, repair and / maintenance expenses)
• Regionalized overhead & centralized G&A / dedicated to buildings (e.g., billing, collections, / payables, purchasing)
– Non-cash expenses, including the impact of straight- / line lease cost and benefit of lease incentive / amortization
– Excludes corporate G&A, growth and new market / development, corporate sales & marketing and pre- / opening costs
Note: Represents WholeCo as of six months ended June 30, 2019
(1) Lease cost excluding adjustments for the impact of straight-lining of lease cost relating to lease holidays and lease escalation. Tenancy costs include real estate and related taxes and common area maintenance charges ('CAM') relating to our leased locations used for member community operations.
(2) Other adjusted location expenses represents location operating expenses less cash lease and tenancy costs, adjusted to exclude adjustments for impact of straight-lining of lease and stock-based compensation.
(3) Benefit of non-cash amortization of lease incentives represents cash received for TI allowances and broker commissions
18
Visuals: Waterfall chart titled '1H 2019' with '(in millions)' unit label; no visible axes or gridlines; baseline is a thin grey horizontal line at about 79% of slide height. Six bars left to right: Membership & service revenue $1,349 (teal solid bar, full height from baseline, about #3E8A96); Cash lease costs ($707) (grey #A0A0A0 floating bar from $1,349 down); Other adjusted location operating expenses ($371) (grey #A0A0A0 floating bar); Impact of non-cash straight-line lease cost adjustment ($198) (grey #A0A0A0 floating bar); Benefit of non-cash amortization of lease incentives $69 (dark grey #5A5A5A thin bar); Location contribution margin $142 (teal solid bar, about #3E8E9B). Connector lines are thin grey horizontal lines between bar tops and bottoms. A dashed-outline speech callout with a dashed tail points to the Cash lease costs bar reading 'Excludes benefit of TI amortization of $69mm'. Below the chart, a light blue-grey box labelled '2x Rev. / Rent Multiplier' sits under the Cash lease costs column. Beneath the bars a row reads '% membership & service revenue:' with values (52%), (28%), (15%), 5%, and 10% (the 10% in teal). No legend, no highlighted points beyond the teal bars and the dark benefit bar.
Slide 19
Optimizing the Fleet
Slide 20
Drivers of location contribution margin / Location maturity(1) / 32% of locations have been open for >24 months / Market / maturity(2)(3) / 43% of locations in Top 7 markets / Enterprise / membership(3)(4) / 25% of locations have >50% / enterprise members / 32% / 19% / 24% / 14% / 17% / 21% / 5% / 0-6 / months / 10% / Location contribution margin / as a % of membership and service revenue / Total / Consolidated / 15% / (5%) / (24%) / 7-12 / months / 13-24 / months / 24+ / months / Mature / locations / outside / Top 7 / markets / Mature / locations / in Top 7 / markets / Mature / locations / w/ >50% / SMB / members / Mature / locations / w/ >50% / enterprise / members / Non-cash GAAP straight-line lease cost / as a % of membership and service revenue / 44% / 21% / 12% / 4% / 3% / 4% / 4% / 1% / Benefit of non-cash lease incentives / as a % of membership and service revenue / (8%) / (4%) / (5%) / (5%) / (5%) / (5%) / (5%) / (5%) / (5%) / Note: Charts represent 1H '19 location contribution margin / (1) Based on number of months a location has been open as of June 1, 2019. / (2) Includes our seven largest markets by memberships as of June 1, 2017, which represents 29 cities with open locations as of June 1, 2019, including Boston, Los Angeles, Santa Monica, Pasadena, Irvine, Manhattan Beach, Long Beach, Burbank, West Hollywood, Costa Mesa, Culver / City, El Segundo, Playa Vista, London, New York, Astoria, Brooklyn, Long Island City, San Francisco, Oakland, Mountain View, San Mateo, Mill Valley, Berkeley, Emeryville, Chicago, Washington, D.C., McLean and College Park. Excludes our corporate headquarters in New York, San / Francisco and London, as well as two WeLive locations. / (3) Mature locations defined as locations that have been open for greater than 24 months. / (4) Enterprises defined as members with 500+ employees / 20
Visuals: Vertical bar chart with a bidirectional axis around a zero baseline at about 54.4% of slide height; no printed axis scale. Title: none beyond slide headers. Series 'Location contribution margin as a % of membership and service revenue': Total Consolidated 10% (grey bar #9B9B9B), 0-6 months (24%) negative bar (dark slate #304957 extending below baseline), 7-12 months 5% (about, #304957), 13-24 months 17% (#304957), 24+ months 21% (#304957), Mature locations outside Top 7 markets 14% (#6E98AF), Mature locations in Top 7 markets 24% (#6E98AF), Mature locations w/ >50% SMB members 19% (#408F9E), Mature locations w/ >50% enterprise members 32% (#408F9E). Second bar marks at Total Consolidated: 15% and (5%) shown as values with thin rules under them, not bars. Dashed horizontal reference line in amber/yellow #F2B705 at about 47.7% of slide height across the chart width, unlabelled. Highlighted points: none beyond colour grouping. Table with two rows and nine columns: Non-cash GAAP straight-line lease cost as a % of membership and service revenue: 44%, 21%, 12%, 4%, 3%, 4%, 4%, 1% (under 0-6 months through enterprise bar; the Total column is blank). Benefit of non-cash lease incentives as a % of membership and service revenue (teal text #3B8E9C): (8%), (4%), (5%), (5%), (5%), (5%), (5%), (5%); each value underlined by a short grey rule.
Slide 21
Growing base of strong, recurring cash flows as locations mature / Non- Mature Locations / FY '17 / FY '18 / 1H '19 / 144 / 288 / 346 / Mature Locations(1) / 79% of mature locations (89% of mature desks excluding JV's) generated positive location contribution margin / 53 / 122 / 161 / FY '17 / FY '18 / 1H '19 / % of total locations / 73% / 70% / 68% / 27% / 30% / 32% / Avg. occupancy / 75% / 82% / 78% / 88% / 90% / 88% / Location contribution margin % / 4% / 7% / 5% / 20% / 22% / 21% / Location contribution margin / desk (annualized) / $200 / $352 / $222 / $1,275 / $1,434 / $1,413 / Impact of non-cash straight-line lease cost % / 24% / 22% / 21% / 4% / 3% / 4% / Benefit of non-cash amortization of lease incentives % / 7% / 5% / 5% / 4% / 5% / 5% / (1) Represents locations that have been open for greater than 24 months. Excludes India and WeLive locations / 21
Visuals: Two vertical bar charts with no chart titles beyond their header bars. Left chart, Non-Mature Locations, dark slate bars (#304957) with value labels above: FY '17 = 144, FY '18 = 288, 1H '19 = 346, category axis labels FY '17, FY '18, 1H '19 below, thin light grey baseline, no y-axis, no legend. Bar heights are proportional to values (about 144:288:346). Right chart, Mature Locations, steel blue bars (#6E98AF) with value labels above: FY '17 = 53, FY '18 = 122, 1H '19 = 161, category labels FY '17, FY '18, 1H '19 below, thin grey baseline, no y-axis, no legend. A dashed-outline callout box above the 1H '19 bar contains the text 79% (teal, bold) of mature locations (89% of mature desks excluding JV's) generated positive location contribution margin, with a thin dashed pointer line running from the box bottom-right down to the top of the 1H '19 bar. Table: columns are row label, FY '17, FY '18, 1H '19 (non-mature), FY '17, FY '18, 1H '19 (mature); rows are % of total locations (73%, 70%, 68% | 27%, 30%, 32%), Avg. occupancy (75%, 82%, 78% | 88%, 90%, 88%), Location contribution margin % (4%, 7%, 5% | 20%, 22%, 21%), Location contribution margin / desk (annualized) ($200, $352, $222 | $1,275, $1,434, $1,413), Impact of non-cash straight-line lease cost % (24%, 22%, 21% | 4%, 3%, 4%), Benefit of non-cash amortization of lease incentives % (7%, 5%, 5% | 4%, 5%, 5%). Rows Avg. occupancy and Location contribution margin / desk are shaded pale blue-grey with dashed outlines. Horizontal thin grey rules separate the table header area and the lower rows.
Slide 22
Consistent execution – location occupancy / As of September 2019 / Non- Mature Locations / Mature Locations(1) / n = 423 locations / n = 177 locations / 22 / 11 / 19 / 17 / 20 / 30 / 51 / 68 / 133 / 52 / 1 / – / 1 / 1 / 3 / 10 / 25 / 58 / 72 / 6 / <20% / 20% - 30% / 30% - 40% / 40% - 50% / 50% - 60% / 60% - 70% / 70% - 80% / 80% - 90% / 90% - 100% / 100% / <20% / 20% - 30% / 30% - 40% / 40% - 50% / 50% - 60% / 60% - 70% / 70% - 80% / 80% - 90% / 90% - 100% / 100% / Occupancy / Memberships / 2.6k / 2.9k / 7.9k / 11.1k / 14.8k / 23.1k / 39.9k / 65.8k / 152.1k / 41.8k / 0.0k / NA / 0.1k / 0.2k / 1.6k / 7.8k / 18.7k / 57.2k / 86.0k / 6.1k / Avg. / Memberships / per Building / 120 / 260 / 416 / 653 / 739 / 771 / 782 / 968 / 1,143 / 804 / 27 / NA / 103 / 182 / 525 / 780 / 746 / 987 / 1,194 / 1,008 / Note: Represents WholeCo excl. India Q3 2019 figures. Q3'19 figures and metrics are preliminary and subject to change. See “Disclaimer” slide. Numbers on x-axis are inclusive of lower end of range and exclusive of higher end of range (e.g. 40,50 ) / (1) Represents locations that have been open for greater than 24 months or greater. Excludes India and WeLive locations / 22
Visuals: Chart 1: vertical bar chart titled Non- Mature Locations, n = 423 locations, x-axis Occupancy bands <20% to 100% in 10-point steps (percent of occupancy, bands inclusive of lower and exclusive of higher end), y-axis unlabelled count of locations with no printed scale, bar values printed above each bar: <20% 22; 20%-30% 11; 30%-40% 19; 40%-50% 17; 50%-60% 20; 60%-70% 30; 70%-80% 51; 80%-90% 68; 90%-100% 133 (highlighted as tallest bar); 100% 52. Bars are dark slate #304957. Chart 2: vertical bar chart titled Mature Locations(1), n = 177 locations, same x-axis bands, bar values: <20% 1; 20%-30% no bar (dash shown); 30%-40% 1; 40%-50% 1; 50%-60% 3; 60%-70% 10; 70%-80% 25; 80%-90% 58; 90%-100% 72 (tallest bar); 100% 6. Bars are steel blue #6E98AF. No legend; each panel is titled by its header bar. Table beneath the charts with three rows: Occupancy (band labels as above); Memberships left panel 2.6k, 2.9k, 7.9k, 11.1k, 14.8k, 23.1k, 39.9k, 65.8k, 152.1k, 41.8k; right panel 0.0k, NA, 0.1k, 0.2k, 1.6k, 7.8k, 18.7k, 57.2k, 86.0k, 6.1k; Avg. Memberships per Building left panel 120, 260, 416, 653, 739, 771, 782, 968, 1,143, 804; right panel 27, NA, 103, 182, 525, 780, 746, 987, 1,194, 1,008. Grey horizontal rules separate the table rows.
Slide 23
Consistent execution – non-mature location occupancy
As of September 2019
Locations open ≤ 3 months
Median = 58%
Average = 59%
n = 119 locations
21
9
12
10
9
9
9
13
6
21
Occupancy (%)
< 20% / 20% - / 30% - / 40% - / 50% - / 60% - / 70% - / 80% - / 90% - / 100%
30% / 40% / 50% / 60% / 70% / 80% / 90% / 100%
Locations open 4–6 months
Median = 86%
Average = 78%
n = 44 locations
1
4
2
1
3
7
7
12
7
Locations open 7–12 months
Median = 89%
Average = 82%
n = 130 locations
2
3
5
6
13
18
19
49
15
Occupancy (%)
Locations open 13–24 months
Median = 91%
Average = 85%
n = 130 locations
5
5
14
30
65
11
Note: Represents WholeCo excl. India Q3 2019 figures. Note: Q3'19 financials are preliminary and subject to change. See “Disclaimer” for additional information. Numbers on x-axis are inclusive of lower end of range and exclusive of higher end of range (e.g. 40,50)
23
Visuals: Four vertical bar charts, each with a bold heading, a teal horizontal rule beneath the heading, a 3-line statistics block at top-left of the plot, and a single category x-axis of ten occupancy bins labelled < 20%, 20% - 30%, 30% - 40%, 40% - 50%, 50% - 60%, 60% - 70%, 70% - 80%, 80% - 90%, 90% - 100%, 100%. Only the top-left chart has a y-axis label 'Occupancy (%)' at the left of the bottom row; the bars are labelled with their counts above each bar, and there are no gridlines or y-axis tick values. Bars are solid teal #408F9E with no outline. Bar values are printed, so no estimates are needed. Chart 1, Locations open ≤ 3 months (n = 119 locations, Median 58%, Average 59%): < 20% = 21; 20% - 30% = 9; 30% - 40% = 12; 40% - 50% = 10; 50% - 60% = 9; 60% - 70% = 9; 70% - 80% = 9; 80% - 90% = 13; 90% - 100% = 6; 100% = 21. Chart 2, Locations open 4–6 months (n = 44 locations, Median 86%, Average 78%): < 20% = 1; 20% - 30% = no bar (0); 30% - 40% = 4; 40% - 50% = 2; 50% - 60% = 1; 60% - 70% = 3; 70% - 80% = 7; 80% - 90% = 7; 90% - 100% = 12; 100% = 7. Chart 3, Locations open 7–12 months (n = 130 locations, Median 89%, Average 82%): < 20% = no bar (0); 20% - 30% = 2; 30% - 40% = 3; 40% - 50% = 5; 50% - 60% = 6; 60% - 70% = 13; 70% - 80% = 18; 80% - 90% = 19; 90% - 100% = 49; 100% = 15. Chart 4, Locations open 13–24 months (n = 130 locations, Median 91%, Average 85%): < 20%, 20% - 30%, 30% - 40% and 40% - 50% have no bars (0); 50% - 60% = 5; 60% - 70% = 5; 70% - 80% = 14; 80% - 90% = 30; 90% - 100% = 65; 100% = 11. No legend and no highlighted points; the tallest bar in each chart is the 90% - 100% bin except charts 1 and 2, where the tallest bars are < 20% and 90% - 100% respectively. The chart 1 heading shows the symbol ≤ with the 3 underlined.
Slide 24
Enterprise continues to drive significant revenue backlog
Enterprise Memberships(1)
Total Enterprise Memberships
% of Total Memberships
39K
51K
62K
81K
109K
154K
191K
214K
264K
25%
28%
28%
30%
34%
38%
41%
40%
43%
3Q '17
4Q '17
1Q '18
2Q '18
3Q '18
4Q '18
1Q '19
2Q '19
3Q '19
Average New Commitment Length
(in months)
23
20
17
14
10
8
7
14
9
1
2016
2017
2018
Q3 '19 E
Non-Enterprise
Enterprise
Total
Committed Revenue Backlog(2)
$0.1B
$0.5B
$2.6B
$3.5B
$4.0B
+$4.3B
9x increase
4Q '16
1Q '17
2Q '17
3Q '17
4Q '17
1Q '18
2Q '18
3Q '18
4Q '18
1Q '19
2Q '19
3Q '19E
3
Note: KPIs displayed as first day of last month in a given period. Q3'19E financials and metrics are preliminary and subject to change. See “Disclaimer” for additional information.
(1) Enterprise Memberships are defined as organizations who have +500 full time employees globally. Enterprise membership percentage represents total enterprise memberships divided by total memberships
(2) Committed revenue backlog for a particular calendar quarter represents total contractual value, inclusive of discounts, of new reservations for desks entered into during that quarter that members will occupy in future months as well as remaining contractual value on prior commitments. For month-to-month commitments, the relevant commitment period used for calculating backlog is one month. Although backlog reflects reservations that are considered to be firm, cancellations, deferrals or scope adjustments may occur and may not be reflected until later periods
24
Visuals: Three charts. (1) Enterprise Memberships: combined bar and line chart. Bars (teal #408F9E) are Total Enterprise Memberships for quarters 3Q '17 to 3Q '19 with printed values 39K, 51K, 62K, 81K, 109K, 154K, 191K, 214K, 264K, shown inside the bar tops in white. Line (dark slate #2D3E50, circular markers) is % of Total Memberships with printed values 25%, 28%, 28%, 30%, 34%, 38%, 41%, 40%, 43%, labelled above each marker. Legend at top-left: teal rectangle for Total Enterprise Memberships and dark line with dot for % of Total Memberships. No y-axis or gridlines printed. (2) Average New Commitment Length (in months): line chart, x-axis categories 2016, 2017, 2018, Q3 '19 E; no y-axis printed. Three series: Enterprise (dark slate #2D3E50 line with dots) values 1, 10, 20, 23; Total (yellow #FCB800 line with dots) values 1, 8, 14, 17; Non-Enterprise (teal #408F9E line with dots) values 1, 7, 9, 14. All series start at 1 in 2016. Legend at bottom: Non-Enterprise, Enterprise, Total. (3) Committed Revenue Backlog: vertical bar chart, dark teal #306B76 bars, last bar 3Q '19E in lighter teal #408F9E. X-axis categories 4Q '16, 1Q '17, 2Q '17, 3Q '17, 4Q '17, 1Q '18, 2Q '18, 3Q '18, 4Q '18, 1Q '19, 2Q '19, 3Q '19E. Printed values: $0.1B (4Q '16), $0.5B (4Q '17), $2.6B (4Q '18), $3.5B (1Q '19), $4.0B (2Q '19), +$4.3B (3Q '19E). Unlabelled bars are about $0.2B (1Q '17), about $0.3B (2Q '17), about $0.3B (3Q '17), about $0.7B (1Q '18), about $1.1B (2Q '18), about $1.6B (3Q '18), with values in between being estimates only. No y-axis printed. A yellow #FCB800 diagonal arrow with arrowhead at upper right runs from above the 4Q '17 bar up to the top right, and a dashed yellow #FCB800 rectangle labelled 9x increase in grey italic sits on the arrow between 3Q '18 and 4Q '18 bars. Chevron: light grey #D8D8D8 triangular shape pointing right, between the two columns.
Slide 25
Appendix
Slides 26 to 49 continue in the full text file.
Download this deck
The hosted PDF of every library deck is free for readers of the SlideDeck Co newsletter. Join with your email and the viewer and download appear here.
Preparing a results presentation or business update of your own? The SlideDeck Co Standard Deck is a slide library for business reviews, updates and plans.







