
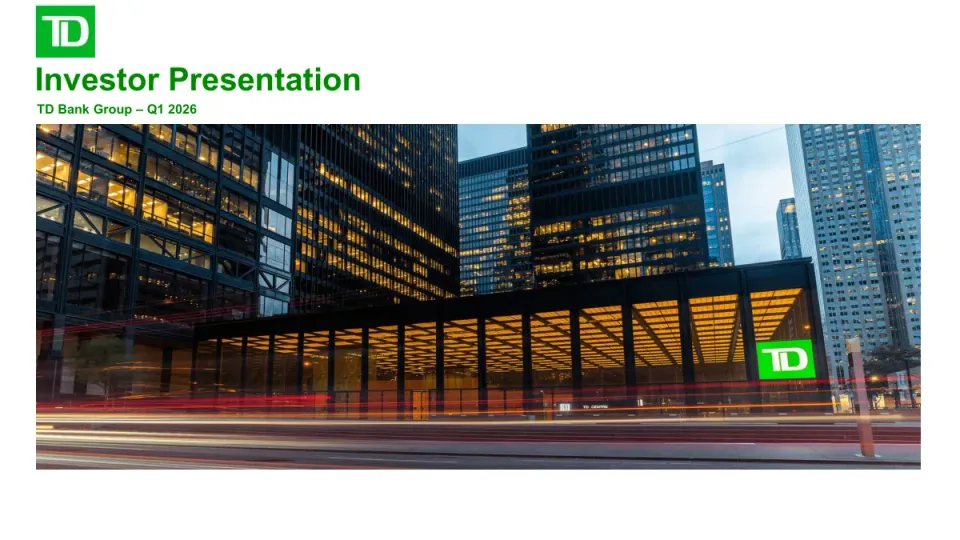
This is TD Bank Group's Q1 2026 investor presentation, opening with a forward-looking statements caution and a title slide, then a snapshot of the bank's businesses, national ranking and the Q1 2026 performance figures. The middle sections cover the four business lines and their F'26 strategic priorities, cost reduction and restructuring, the U.S. BSA/AML remediation, AI initiatives and digital engagement. Credit is the largest block, with allowance and impairment trends, provision ratios by segment, and detail on Canadian residential real estate lending, commercial lending and U.S. personal and commercial portfolios. Later sections address capital and CET1 movements, TLAC, liquidity, funding, credit ratings, covered bonds, bail-in and NVCC loss absorption, and interest rate sensitivity. The appendix covers economic outlook and interest rate views, followed by endnotes defining non-GAAP measures and footnotes for each slide. The deck is built as a dense, data-heavy sequence of tables and charts with a consistent slide header and repeated forward-looking disclaimers.
Slides worth studying
Questions about this deck
How many slides does the TD Bank Group Q1 2026 investor presentation have?
The deck has 55 pages. Slide 3 notes that explanatory endnotes are included on Slides 48-53.
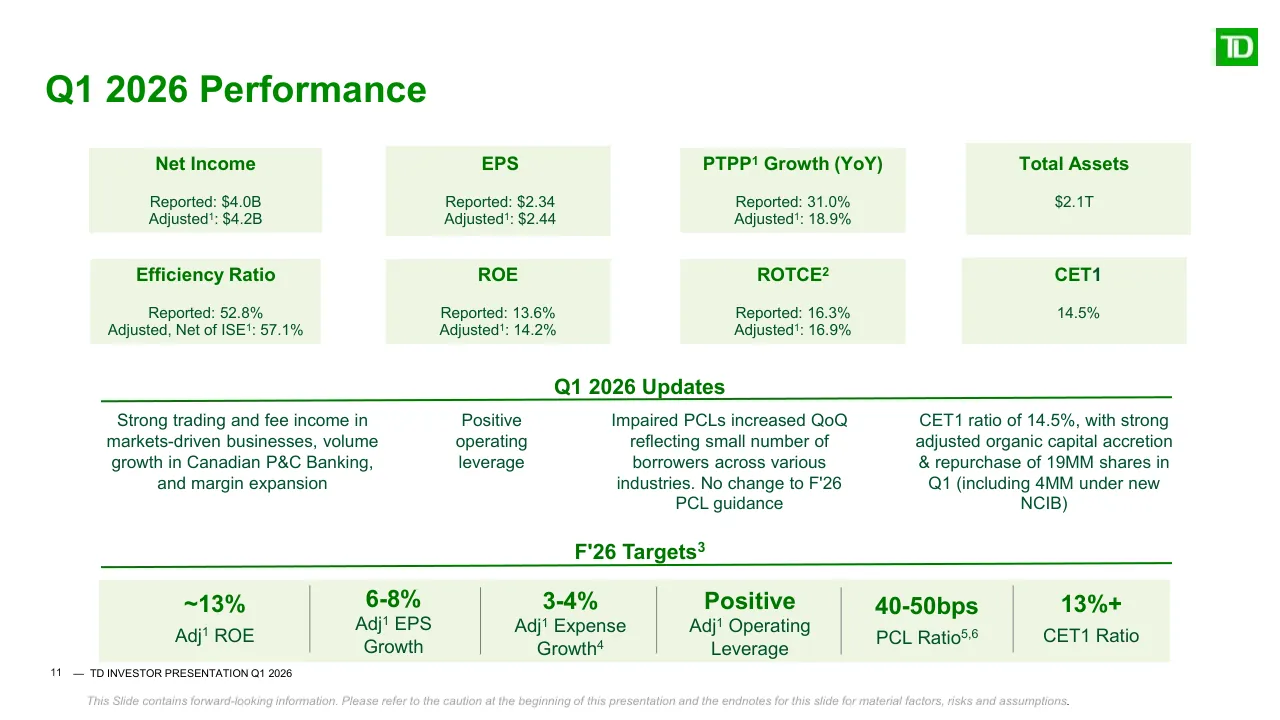
What Q1 2026 net income and EPS does TD Bank Group report in its investor presentation?
Slide 12 shows Q1 2026 net income of $4.0B reported and $4.2B adjusted, and EPS of $2.34 reported and $2.44 adjusted.
What CET1 ratio does TD Bank Group report for Q1 2026?
Slide 5 lists a Common Equity Tier 1 capital ratio of 14.5%, ranked 1st in Canada and 1st in North America. Slide 12 also reports a CET1 ratio of 14.5% for Q1 2026.
What cost reduction targets does TD Bank Group outline in its investor presentation?
Slide 13 states that the bank is targeting about $2-2.5B in annualized cost savings over the medium-term, and expects F'26 savings of about $900MM pre-tax. It also notes a completed restructuring program with total charges of $886MM pre-tax.
Details
Review score: 6 out of 10, Needs substantial work
Presentation quality, judged with the SlideDeck Co review heuristic. Ask, evidence and idea merit are not rated here.
This is a disciplined, consistently branded investor reference deck with clean tables, readable headers and a coherent section route (snapshot, strategy, credit, capital, funding), but it is mostly data pages with topic titles rather than message titles. Slides 27, 29, 30 and 31 give one thin highlight bullet beside large tables, so the audience must find the point themselves, and many pages (25, 26, 34, 39, 41, 43) are very small text or dense blocks that are hard to read live. Slides 7 and 12 are well organised and legible, yet slide 12 mixes eight metrics, four updates and six targets with little emphasis on what matters most. It works as a read-ahead document for analysts, but substantial revision would be needed for it to communicate a case on screen.
Worth keeping: Keep the consistent green header and footer system, the clean banded tables on slides 27 and 30, and the three-pillar structure with targets strip on slides 7 and 8.
Most useful repair: Rewrite topic titles as takeaway statements and give each table or chart slide a stated conclusion, especially slides 27 to 31 where one short bullet sits beside a large table.
What would change the score: I would split or trim the densest pages (slides 12, 36, 39, 41, 43) and move the long forward-looking text on slide 2 and the endnotes on slides 49 to 54 into a handout, with the first slide's empty lower area and the sparse slide 55 tidied.
Confidence medium. 55 of 55 pages inspected on contact sheets, 4 at readable size. Reviewed 2026-11-08. Model-assisted review (claude-sonnet-5-5).
Full text of the slides (55 slides)
Every slide's words and a description of its charts and images, so the deck can be searched and rebuilt. Also available as Markdown.
Slide 1
TD
Investor Presentation
TD Bank Group – Q1 2026
Title Slide
S E C T I O N O N E
Visuals: Photograph: a dusk view of TD Centre in Toronto, with dark glass office towers lit by warm amber interior lights. In the centre is a low black-framed pavilion with a glowing amber lattice ceiling and glass walls, and a small white 'TD CENTRE' sign on its facade. A bright green square TD logo sign sits on the right side of the pavilion. In the foreground, long red and white light trails from vehicles run across the road and pavement. The sky is pale blue-grey at dusk. Composition is a wide landscape crop, unboxed, not full-bleed, with a sharp focus and no overlay or tint. Dominant colours are dark navy-black, amber, red and blue-grey. Logo: the TD mark in white on a green square, top-left, and a second TD mark on the pavilion sign.
Slide 2
Caution Regarding Forward-Looking Statements
From time to time, the Bank (as defined in this document) makes written and/or oral forward-looking statements, including in this document, in other filings with Canadian regulators or the United States (U.S.) Securities and Exchange Commission (SEC), and in other communications. In addition, representatives of the Bank may make forward-looking statements orally to analysts, investors, the media, and others. All such statements are made pursuant to the “safe harbour” provisions of, and are intended to be forward-looking statements under, applicable Canadian and U.S. securities legislation, including the U.S. Private Securities Litigation Reform Act of 1995. Forward-looking statements include, but are not limited to, statements made in this document and/or on the conference call, the Management’s Discussion and Analysis (2025 MD&A) in the Bank’s 2025 Annual Report under the heading “Economic Summary and Outlook”, under the headings “Key Priorities for 2026” and “Operating Environment and Outlook” for the Canadian Personal and Commercial Banking, U.S. Banking, Wealth Management and Insurance, and Wholesale Banking segments, and in other statements regarding the Bank’s objectives and priorities for 2026 and beyond and strategies to achieve them, the regulatory environment in which the Bank operates, targets and commitments, the Bank’s anticipated financial performance and the outlook for the Bank’s operations or the Canadian, U.S. and global economies.
Forward-looking statements are typically identified by words such as “will”, “would”, “should”, “suggest”, “seek”, “believe”, “expect”, “anticipate”, “intend”, “ambition”, “strive”, “confident”, “estimate”, “forecast”, “outlook”, “plan”, “goal”, “commit” “target”, “"objective", "timeline", possible”, “potential”, “predict”, “project”, “foresee”, “may”, and “could” and similar expressions or variations thereof, or the negative thereof, but these terms are not the exclusive means of identifying such statements. By their very nature, these forward-looking statements require the Bank to make assumptions and are subject to inherent risks and uncertainties, general and specific. Especially in light of the uncertainty related to the physical, financial, economic, political, and regulatory environments, such risks and uncertainties – many of which are beyond the Bank’s control and the effects of which can be difficult to predict – may cause actual results to differ materially from the expectations, predictions, forecasts, projections, estimates, targets, or intentions expressed in the forward-looking statements. Examples of such risk factors include: general business and economic conditions in the regions in which the Bank operates; geopolitical risk (including policy, trade and tax-related risks and the potential impact of any new or elevated tariffs or any retaliatory tariffs); inflation, interest rates and recession uncertainty; risks associated with the remediation of the Bank's U.S. Bank Secrecy Act (BSA)/anti-money laundering (AML) program and Enterprise AML program; regulatory oversight and compliance risk; the ability of the Bank to execute on long-term strategies, shorter-term key strategic priorities, including the successful completion of acquisitions and dispositions and integration of acquisitions, the ability of the Bank to achieve its financial or strategic objectives with respect to its investments, business retention plans, and other strategic plans; risks associated with the insured deposit account agreement between the Bank and The Charles Schwab Corporation; technology and cyber security risk (including cyber-attacks, data security breaches or technology failures) on the Bank’s technologies, systems and networks, those of the Bank’s customers (including their own devices), and third parties providing services to the Bank; data risk; model risk; external fraud activity; insider risk; conduct risk; the failure of third parties to comply with their obligations to the Bank or its affiliates, including relating to the care and control of information, and other risks arising from the Bank’s use of third-parties; the impact of new and changes to, or application of, current laws, rules and regulations, including consumer protection laws and regulations, tax laws, capital guidelines and liquidity regulatory guidance; environmental and social risk (including climate-related risk); exposure related to litigation and regulatory matters; increased competition from incumbents and new entrants (including Fintechs and big technology competitors); shifts in consumer attitudes and disruptive technology; ability of the Bank to attract, develop, and retain key talent; changes in foreign exchange rates, interest rates, credit spreads, equity prices and commodity prices; downgrade, suspension or withdrawal of ratings assigned by any rating agency, the value and market price of the Bank's common shares and other securities may be impacted by market conditions and other factors; the interconnectivity of financial institutions, including existing and potential international debt crises; increased funding costs and market volatility due to market illiquidity and competition for funding; and critical accounting estimates and changes to accounting standards, policies, and methods used by the Bank; and the occurrence of natural and unnatural catastrophic events and claims resulting from such events. The Bank cautions that the preceding list is not exhaustive of all possible risk factors and other factors could also adversely affect the Bank’s results. For more detailed information, please refer to the “Risk Factors that May Affect Future Results” section of the 2025 MD&A, and the sections related to strategic, credit, market (including equity, commodity, foreign exchange, interest rate, and credit spreads), operational (including technology, cyber security, process, systems, data, third-party, fraud, infrastructure, insider and conduct), model, insurance, liquidity, capital adequacy, compliance, financial crime, reputational, environmental and social risk in the "Managing Risk" section of the 2025 MD&A, as may be updated in subsequently filed quarterly reports to shareholders and news releases (as applicable) related to any events or transactions discussed under the headings “Significant Events” or “Update on the Remediation of the U.S. Bank Secrecy Act (BSA)/Anti-Money Laundering (AML) Program and Enterprise AML Program” in the relevant MD&A, which applicable releases may be found on www.td.com. All such factors, as well as other uncertainties and potential events, and the inherent uncertainty of forward-looking statements, should be considered carefully when making decisions with respect to the Bank. The Bank cautions readers not to place undue reliance on the Bank’s forward-looking statements.
Material economic assumptions underlying the forward-looking statements contained in this document and/or on the conference call are set out in the 2025 MD&A under the headings “Economic Summary and Outlook” and “Significant Events”, under the headings “Key Priorities for 2026” and “Operating Environment and Outlook” for the Canadian Personal and Commercial Banking, U.S. Banking, Wealth Management and Insurance, and Wholesale Banking segments, each as may be updated in subsequently filed quarterly reports to shareholders and news releases (as applicable).
Any forward-looking statements contained in this document and/or on the conference call represent the views of management only as of the date hereof and are presented for the purpose of assisting the Bank’s shareholders and analysts in understanding the Bank’s financial position, objectives and priorities and anticipated financial performance as at and for the periods ended on the dates presented, and may not be appropriate for other purposes. The Bank does not undertake to update any forward-looking statements, whether written or oral, that may be made from time to time by or on its behalf, except as required under applicable securities legislation.
1
— TD INVESTOR PRESENTATION Q1 2026
Slide 3
TD Bank Group / Overview of TD Bank Group / Credit Update / Strong Balance Sheet & Capital Position / NB: Explanatory endnotes are included on Slides 48-53. / 2 / — TD INVESTOR PRESENTATION Q1 2026
Visuals: One photograph and one logo, plus three chevron icons. Photograph: a low-angle view looking up at a modern building facade. A large green-tinted glass and metal corner panel carries a cream-white TD wordmark on a raised angled sign. Above it, grey-silver aluminium and dark glass window bands rise into a pale blue sky with white clouds at the top-left. The dark tower on the upper right is in shadow. Lighting is soft daylight. Dominant colours are green (about #1E7A32), silver-grey, and pale sky blue. The image is cropped at the panel edge and is not full-bleed across the slide, with no overlay or tint. Logo: the green square TD logo with a white TD wordmark, top-right. Chevrons: three thin right-pointing chevron strokes, one in each band. The first is dark green #03522C, and the other two are light green #B1D57F.
Slide 4
TD Snapshot
Our Businesses
Canadian Personal & Commercial Banking
Personal banking, credit cards and auto finance
Small business, commercial banking, merchant solutions
and equipment finance
U.S. Banking
Personal banking, credit cards and auto finance
Small business and commercial banking
Advice-based wealth and asset management
Wealth Management & Insurance
Self-directed, advice-based wealth, and asset management
Home, Auto, Small Business, Life and Health Insurance
Wholesale Banking
Research, investment banking and capital market services
Global transaction banking
Presence in key global financial centres including Toronto,
New York, London, Tokyo and Singapore
Q1 2026 (C$) Canadian P&C Banking U.S. Banking Wealth Mgmt. & Insurance
Financial Strength
Deposits¹ $495B $423B $37B
Loans² $615B $243B $8B
AUA³,⁴ - $63B $771B
AUM⁴ - $15B $610B
Earnings⁵ (rep.) $7.5B $2.6B $2.9B
Network Highlights
Employees⁶ 33,660 29,877 15,872
Customers⁷ ~16MM >10MM >6MM
Branches 1,043 1,049 -
ATMs⁸ 3,345 2,354 -
Mobile Users⁹ 8.7MM 5.2MM Not Disclosed
2,092 retail locations
in North America
Legend
TD Securities
TD Wealth
TD Wealth operates in 684 cities across North America and 7 cities globally
TD Securities operates in 30 cities across the world
3 — TD INVESTOR PRESENTATION Q1 2026
Visuals: Four solid dark green header bars (#006700) stacked down the left column, each carrying a white bold heading with a green square-bullet list beneath. On the right: (1) an illustration of a light grey North America map with province and state borders in thin mid-grey lines and small green dots (#33B233) marking retail locations, concentrated in Ontario, Quebec, the Prairies and the US Northeast and Southeast; a few dark dots mark TD Wealth points. (2) A data table with a dark green header row (#006700) and two light grey section rows, with bold row labels and right-aligned numeric values, columns Q1 2026 (C$), Canadian P&C Banking, U.S. Banking and Wealth Mgmt. & Insurance, rows listed in the text field. (3) A pale green caption box reading 2,092 retail locations in North America. (4) An illustration of a light grey world map with green dots (TD Securities) clustered over North America, Western Europe and East Asia and dark grey dots (TD Wealth) over North America and Japan; a small legend at bottom-left of the map reads Legend, TD Securities (green dot), TD Wealth (dark dot). (5) A pale green bottom caption box spanning the lower right with two centred lines of text. No charts or photographs.
Slide 5
Top 10 North American Bank
Q1 2026 (C$ except otherwise noted)
TD Bank Group
Canadian Ranking¹
North American Ranking²
Total assets
$2,099B
2nd
6th
Total deposits
$1,245B
2nd
6th
Market capitalization
$212.7B
2nd
6th
Reported net income (trailing four quarters)
$21.8B
1st
4th
Adjusted net income³ (trailing four quarters)
$15.6B
n/a
n/a
Average number of full-time equivalent staff
104,841
1st
5th
Common Equity Tier 1 capital ratio⁴
14.5%
1st
1st
4
— TD INVESTOR PRESENTATION Q1 2026
Visuals: One data table, no chart, photograph or diagram. Columns: (1) row label, blank header cell beneath 'Q1 2026 (C$ except otherwise noted)'; (2) 'TD Bank Group'; (3) 'Canadian Ranking¹'; (4) 'North American Ranking²'. Rows, with values as printed: Total assets | $2,099B | 2nd | 6th. Total deposits | $1,245B | 2nd | 6th. Market capitalization | $212.7B | 2nd | 6th. Reported net income (trailing four quarters) | $21.8B | 1st | 4th. Adjusted net income³ (trailing four quarters) | $15.6B | n/a | n/a. Average number of full-time equivalent staff | 104,841 | 1st | 5th. Common Equity Tier 1 capital ratio⁴ | 14.5% | 1st | 1st. Ordinal suffixes (nd, st, th) are printed as small superscripts. Highlights: the TD Bank Group column is shaded light grey on alternate cells; no cell is coloured beyond that. The TD logo (green square with white 'TD' letters) is the only other visual element.
Slide 6
Scaled, Diversified North American Bank / Four key business lines / Canadian Personal & Commercial Banking / The Personal Bank is a premier retail banking franchise delivering personalized / solutions through a full suite of products and services across deposits, investing, / payments and lending. / Business Banking is a premier, client-centric franchise that delivers deep sector / expertise, valuable advice, and a broad range of products and services to meet / the needs of business owners. / U.S. Banking / Includes the Bank's personal, business banking and wealth management / operations in the U.S. / Wealth Management & Insurance / Wealth Management offers wealth solutions to retail clients in Canada through the / self-directed brokerage, advice-based, and asset management businesses. / Insurance offers property and casualty insurance through direct channels and to / members of affinity groups, as well as life and health insurance products to / customers across Canada. / Wholesale Banking / Operating under the brand names TD Securities and TD Cowen, Wholesale / Banking offers global markets and corporate and investment banking services to / its corporate, government, and institutional clients. / Q1 2026 Reported Earnings Mix 1 / Canadian / Personal & / Commercial / Banking, / 46% / U.S. Banking, / 24% / Wealth / Management / & Insurance, / 17% / Wholesale / Banking, 13% / 5 — TD INVESTOR PRESENTATION Q1 2026
Visuals: Chart: donut chart titled 'Q1 2026 Reported Earnings Mix' with superscript footnote marker 1, showing four segments of reported earnings share, with percentage labels printed on the segments (no axes, no legend, no gridlines). Segments clockwise from top: Canadian Personal & Commercial Banking 46% (fill #008A00, dark-medium green, the largest arc on the left and top-left, spanning roughly from 12 o'clock counter-clockwise to about 5 o'clock); U.S. Banking 24% (fill #163D22, very dark green, upper-right arc from 12 o'clock to about 3 o'clock); Wealth Management & Insurance 17% (fill #AED99E, pale green, right-lower arc); Wholesale Banking 13% (fill #86CA72, medium-light green, bottom arc). Labels are white bold text on the two dark segments (Canadian and U.S. Banking) and dark #1C1C1C bold text on the two light segments (Wealth Management and Wholesale). Donut has a white hole at about 50% of the outer diameter and thin white separator lines between segments. No highlighted points. Logo: TD logo, a green square (#00A000 approx.) with a white stylised 'TD' mark, at the top-right corner, not cropped.
Slide 7
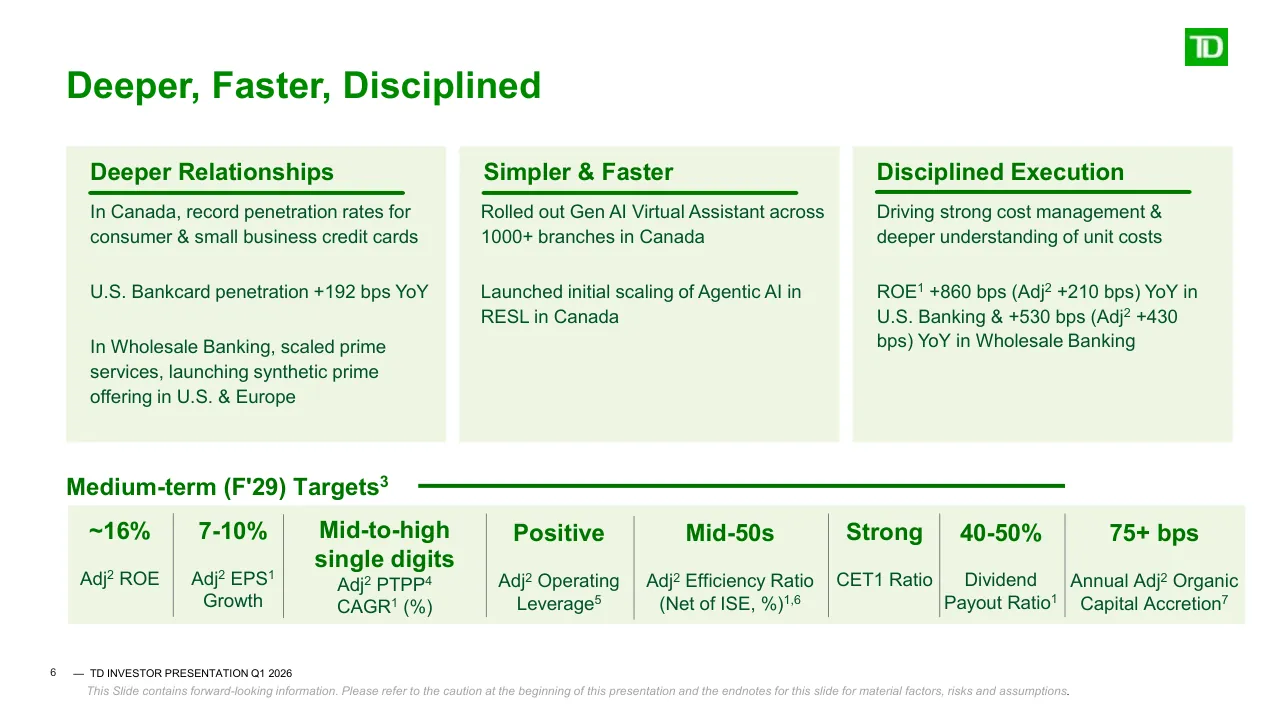
Deeper, Faster, Disciplined
Deeper Relationships
In Canada, record penetration rates for consumer & small business credit cards
U.S. Bankcard penetration +192 bps YoY
In Wholesale Banking, scaled prime services, launching synthetic prime offering in U.S. & Europe
Simpler & Faster
Rolled out Gen AI Virtual Assistant across 1000+ branches in Canada
Launched initial scaling of Agentic AI in RESL in Canada
Disciplined Execution
Driving strong cost management & deeper understanding of unit costs
ROE¹ +860 bps (Adj² +210 bps) YoY in U.S. Banking & +530 bps (Adj² +430 bps) YoY in Wholesale Banking
Medium-term (F'29) Targets³
~16%
7-10%
Mid-to-high single digits
Positive
Mid-50s
Strong
40-50%
75+ bps
Adj² ROE
Adj² EPS¹ Growth
Adj² PTPP⁴ CAGR¹ (%)
Adj² Operating Leverage⁵
Adj² Efficiency Ratio (Net of ISE, %)¹˒⁶
CET1 Ratio
Dividend Payout Ratio¹
Annual Adj² Organic Capital Accretion⁷
6
— TD INVESTOR PRESENTATION Q1 2026
This Slide contains forward-looking information. Please refer to the caution at the beginning of this presentation and the endnotes for this slide for material factors, risks and assumptions.
Visuals: A small TD logo in the top-right corner: a green square with white 'TD' letters, roughly 42 by 37 pixels. No photographs or charts. The medium-term targets band is a row of eight text-based metrics divided by thin grey vertical rules, not a chart. Column values: ~16% over Adj² ROE; 7-10% over Adj² EPS¹ Growth; Mid-to-high single digits over Adj² PTPP⁴ CAGR¹ (%); Positive over Adj² Operating Leverage⁵; Mid-50s over Adj² Efficiency Ratio (Net of ISE, %)¹˒⁶; Strong over CET1 Ratio; 40-50% over Dividend Payout Ratio¹; 75+ bps over Annual Adj² Organic Capital Accretion⁷. The three green underline bars under the card headings are horizontal lines, about 0.5% of slide height thick, rounded ends.
Slide 8
Canadian P&C Banking – F'26 Strategic Priorities
Deeper Relationships
Simpler & Faster
Disciplined Execution
Outgrow Canadian population growth in net new clients and lead in core banking and primacy
Deepen client relationships across CPB, CBB, and Wealth Management
Transform RESL homebuying and retention through specialization and speed while delivering strong returns
Accelerate Credit Card growth by streamlining processes, and modernizing policies and technology
Expand CBB distribution by investing in frontline bankers and focusing on relationship banking
Modernize and automate processes and platforms, and leverage AI to deliver efficient, seamless, and personalized experiences
Deliver simpler and faster client experiences for onboarding and mobile first experiences
Leverage AI and automation to enhance auto-adjudication rates in TD Auto Finance and Small Business Banking, while streamlining CBB credit processes
Leverage automation, digital tools and AI-at-scale to drive cost savings and improve efficiency
Redesign key business processes and streamline operations to realize cost reduction
Deliver disciplined expense management through resource optimization and third-party spend reduction
Drive distribution transformation to meet clients' evolving needs and create reinvestment opportunities
7
— TD INVESTOR PRESENTATION Q1 2026
Slide 9
U.S. Banking – F'26 Strategic Priorities / Deeper Relationships / Reimagine retail, providing capacity to deliver advice enabled by digital capabilities / Scale Bankcard franchise and expand Nordstrom partnership / Deepen mass-affluent penetration by scaling advisors, improving referrals, and tailoring investment products and services / Accelerate Commercial Bank profitability with profitable relationships, expanded lead agent roles through TD Securities partnership / Simpler & Faster / Continue balance sheet restructuring efforts that simplify the business / Deploy AI to automate operational processes and improve productivity and insights for front-line colleagues / Transform data and technology architecture to deliver a scalable, cloud-native, modular environment / Disciplined Execution / Continue remediating the U.S. BSA/AML program and strengthening the governance and control environment / Improve efficiency by meeting the cost takeout target / Optimize store network, drive unit cost improvement and re-engineer processes and reduce third party spend / 8 / — TD INVESTOR PRESENTATION Q1 2026
Visuals: None photographic. Three flat pale-green rectangular panels (left #E5F1D4 at 63% opacity, middle and right #EFF6E4) each carry a heading with a thick dark-green horizontal rule beneath it, running about 25 percent of the panel width. A small square TD logo (green square with white TD letters) sits top-right. No charts, tables or diagrams.
Slide 10
Wealth Management & Insurance – F'26 Strategic Priorities
Deeper Relationships
Deepen client relationships with CPB, CBB and TD Insurance, and drive referrals from Direct Invest to Advice businesses within Wealth
Expand advisor base in Wealth by leveraging talent development and acquisition programs
Accelerate Direct Investing client acquisition through the launch of the new TD Easy Trade app and enhancements to the Long-Term and Active Trader platforms
Drive mutual funds and ETF asset growth in Canada and drive Institutional asset management growth globally
Drive growth in profitable segments and regions in Insurance through digital marketing excellence and execution of new client acquisition strategies
Simpler & Faster
Simplify client experiences in Wealth by deploying new self-serve, digital onboarding and account funding capabilities
Increase advisor capacity in Wealth by reinventing businesses process and launching new digital capabilities, leveraging AI
Complete the unification of Private Wealth Management's discretionary offerings and realize $40MM of run-rate platform savings
Introduce new client-facing AI capabilities in Insurance to drive increased adoption of digital self-service tools and increase digital share of transactions
Disciplined Execution
Reduce structural costs in Wealth through productivity initiatives, distribution transformation and leveraging automation and AI
Strengthen risk and control environment by modernizing infrastructure and enhancing governance
Sustainably lower expense base in Insurance by re-envisioning business processes with AI and increasing automation
Mitigate losses from climate change in Insurance by managing geographic footprint and supporting clients with risk-reduction advice
9
— TD INVESTOR PRESENTATION Q1 2026
Slide 11
Wholesale Banking – F'26 Strategic Priorities
Deeper Relationships
Strengthen client relationships by aligning resources to priority sectors
Continue to streamline and enhance the global transaction banking platform
Expand fixed income product suite and advance e-trading capabilities across Global Markets
Scale Prime Services by building a globally integrated platform with new capabilities
Simpler & Faster
Continue to simplify organizational structure and hire top talent
Upgrade core systems to simplify processes and modernize infrastructure
Move to an agile, product-led delivery model to build smarter tools that streamline workflows
Invest in AI tools and training to support productivity
Disciplined Execution
Strengthen risk management and compliance by increasing agility, automating processes, and enhancing controls
Reduce costs through process simplification, technology modernization, real estate and vendor optimization, and AI-driven efficiencies
Advance disciplined approach to capital deployment through client level returns focus and strategic balance sheet deployment
10
— TD INVESTOR PRESENTATION Q1 2026
Slide 12
Q1 2026 Performance
Net Income
Reported: $4.0B
Adjusted1: $4.2B
EPS
Reported: $2.34
Adjusted1: $2.44
PTPP1 Growth (YoY)
Reported: 31.0%
Adjusted1: 18.9%
Total Assets
$2.1T
Efficiency Ratio
Reported: 52.8%
Adjusted, Net of ISE1: 57.1%
ROE
Reported: 13.6%
Adjusted1: 14.2%
ROTCE2
Reported: 16.3%
Adjusted1: 16.9%
CET1
14.5%
Q1 2026 Updates
Strong trading and fee income in markets-driven businesses, volume growth in Canadian P&C Banking, and margin expansion
Positive operating leverage
Impaired PCLs increased QoQ reflecting small number of borrowers across various industries. No change to F'26 PCL guidance
CET1 ratio of 14.5%, with strong adjusted organic capital accretion & repurchase of 19MM shares in Q1 (including 4MM under new NCIB)
F'26 Targets3
~13%
Adj1 ROE
6-8%
Adj1 EPS Growth
3-4%
Adj1 Expense Growth4
Positive
Adj1 Operating Leverage
40-50bps
PCL Ratio5,6
13%+
CET1 Ratio
11
— TD INVESTOR PRESENTATION Q1 2026
This Slide contains forward-looking information. Please refer to the caution at the beginning of this presentation and the endnotes for this slide for material factors, risks and assumptions.
Visuals: Visuals: a small TD logo at the top right, a square green tile about 3.3% wide by 5.2% high, with a white TD monogram, placed at x 95.0 y 3.9 (image 42 by 37 pixels). Eight pale green rectangles (#EFF6E4) hold the metric figures: Net Income, EPS, PTPP Growth (YoY), Total Assets in the upper row; Efficiency Ratio, ROE, ROTCE, CET1 in the lower row. Two thin green horizontal rules (#007400, about 0.3% stroke) run under the Q1 2026 Updates and F'26 Targets headings, each slightly tilted, rising to the right. One pale green band (#EFF6E4) holds six target cells separated by thin grey-green vertical dividers (about 0.1% width, roughly #8FB08F) at about x 24.2, 37.6, 51.3, 65.7 and 79.2. No charts, photographs or icons.
Slide 13
Driving structural cost reduction across TD
Completed Restructuring Program
Program size
$200MM pre-tax / $148MM after-tax restructuring charges in Q1'26
Total restructuring program charges of $886MM pre-tax
Impact on expenses
Expect F'26 savings of ~$500MM pre-tax1
Expect fully realized annual cost savings of ~$775MM pre-tax1 (87% savings yield)
Creates capacity to invest to evolve the Bank and accelerate capabilities
Savings drivers
Employee severance and other personnel-related costs, real estate optimization, asset impairment and other rationalization, including certain business wind-downs
~3% FTE reduction including attrition and talent redeployment
Disciplined Cost Management
Targeting ~$2-2.5B in annualized cost savings over the medium-term, delivered across 6 key cost initiatives: (1) Distribution Transformation, (2) Automation & AI, (3) Technology & Data Modernization, (4) Procurement, (5) Global Delivery Workforce, & (6) Cost Moderation2
Expect F'26 savings of ~$900MM pre-tax (~$400MM savings in addition to ~$500MM restructuring savings)2
This Slide contains forward-looking information. Please refer to the caution at the beginning of this presentation and the endnotes for this slide for material factors, risks and assumptions.
12
— TD INVESTOR PRESENTATION Q1 2026
Visuals: One small illustration-free logo: the TD bank mark, a green square (#00A000 approx.) about 3.3% wide by 5.2% high in the top-right corner, containing white stylised TD letters. No charts, tables, photographs or diagrams. Five filled rectangles act as shapes: two dark green section bands, and three pale green label boxes behind the row labels. Bullets are small filled dark green squares (Wingdings square glyph).
Slide 14
U.S. BSA / AML Remediation1
Management remediation actions, including demonstrated sustainability, will continue through 2026 and 2027
2024
2025
2026
2027
2028
Internal Audit Validation and Monitor and Regulatory Engagement
Following Monitor and Regulatory Review, additional management remediation actions may be required that would take
place after 2027
Examples of Completed Actions:
Examples of what is in flight
Deployed first phase of new KYC platform to certain business users,
enabling single Know Your Customer profile
Adopted new data driven financial crime risk assessment methodology
& processes
Enhanced customer screening procedures, including new automated
system capabilities for customer onboarding
Additional deployment of new Know Your Customer strategic platform
Further deployments of machine learning and specialized AI
Continued focus on lookback reviews as required under the OCC and
FinCEN consent orders
Roll-out of dedicated financial crime risk management data
environments in support of advanced detection capabilities
Continued training and development of colleagues
The U.S. BSA/AML remediation program remains subject to risks and uncertainties, including the review
by the Monitor, and approval by our Regulators, FinCEN and the DOJ
Note: "Management Remediation Actions" is considered by the Bank to consist of the root cause assessments, data preparation, design, documentation,
frameworks, policies, standards, training, processes, systems, testing, and implementation of controls, as well as the hiring of resources.
This Slide contains forward-looking information. Please refer to the caution at the beginning of this presentation and the endnotes for this slide for material factors, risks and assumptions.
13
— TD INVESTOR PRESENTATION Q1 2026
Visuals: Five green map-pin icons placed along a horizontal dark green timeline bar, one above each year label, at the x positions of the years 2024, 2025, 2026, 2027 and 2028. The timeline bar fades from dark green #006700 at left to white at its right end. Above the timeline, a green chevron-tipped banner (#006700) spans most of the width. Below the timeline, a grey (#A6A6A6) right-pointing chevron box spans from the 2025 pin area to the right edge and contains white text. Two green headings sit over horizontal dark green rules, one per column. Bullets are small green square markers. A small TD logo (bright green square with white TD letters) sits at top right. No photographs or charts.
Slide 15
Executing AI-at-scale and innovating for our Clients
AI
TD Invent
Aim to deliver $1B in value¹
TD Invent
Our strategic, bank-wide umbrella effort to power innovation
Medium-term target value¹
~$500MM
&
~$500MM
Annualized
Revenue Uplift
Annualized
Cost Savings
• U.S. Banking now offers Shop with Points at Amazon in the U.S. for eligible TD credit cardholders to instantly redeem their points at checkout on Amazon.com.
• KONEK, developed with Canada's leading FIs, including TD, and powered by Interac, provides a secure, flexible multi-rail online payment solution. It is now live with its first national merchant and several small businesses.²
• TD is the first FI to join leading companies as a funding member of OIN 2.0., expanding OIN's patent cross-licensing model beyond Linux OSS packages relating to AI, cyber, cloud and other new technologies.³
• TD's patent portfolio now includes 3,600 assets, reflecting a 20-year commitment to disciplined, long-term innovation.
• 2026 BIG Innovation Awards: Recognized across multiple categories, including Organizational Innovation for Colleague Onboarding and Individual Innovation honours for AI leadership⁴
14
— TD INVESTOR PRESENTATION Q1 2026
This Slide contains forward-looking information. Please refer to the caution at the beginning of this presentation and the endnotes for this slide for material factors, risks and assumptions.
Visuals: Non-text elements: (1) TD logo tile, top right: green square with white stylised TD letters. (2) TD Invent wordmark: 'TD' in black bold sans followed by 'Invent' in green sans, placed left of the tagline. (3) Outlined box in the left column, about 3% to 31% wide and 39% to 60% high, with a 0.2% green stroke (#006700) and square corners; a green header tab 'Medium-term target value¹' overlaps its top edge; inside, two large figures '~$500MM' (about 4.4 % of slide height, bold condensed sans, dark green) separated by a bold '&', each with a caption beneath. (4) Green bullet dots (#00B624) at the left of each of five bullets. (5) BIG Innovation 2026 award badge, bottom right, about 85.5% to 94.7% horizontally and 76% to 90% vertically: a yellow-gold shield-shaped outline with a yellow ribbon band at its sides, black 'BIG' over 'INNOVATION' lettering, a black line-drawn light bulb, and '20' and '26' flanking the bulb on a light-yellow band; white interior.
Slide 16
Digital leadership enables deeper engagement and growth
Canada1,2
U.S.1,2
Home & Auto Insurance1
Clients Digitally Engaged
(% of total customers)5
71.9
79.2
90+
Q1/25
Q1/26
Medium-term
target7
TD MyInsurance Transactions
(millions)6
1.4
1.9
3+
LTM8
Q1/25
LTM8
Q1/26
Medium-term
target7
Mobile Users (millions)3
+5.0%
8.2
8.7
11
Q1/25
Q1/26
Medium-term
target7
Self-Serve Transactions
(% of all financial
transactions)4
+80bps
93.0
93.8
96
Q1/25
Q1/26
Medium-term
target7
Mobile Users (millions)3
+1.8%
5.1
5.2
6+
Q1/25
Q1/26
Medium-term
target7
Self-Serve Transactions
(% of all financial
transactions)4
+180bps
84.2
86.0
90
Q1/25
Q1/26
Medium-term
target7
+39%
This Slide contains forward-looking information. Please refer to the caution at the beginning of this presentation and the endnotes for this slide for material factors, risks and assumptions.
15 — TD INVESTOR PRESENTATION Q1 2026
Visuals: Six small bar charts, all with the same three-bar structure: a Q1/25 bar (light grey), a Q1/26 bar (light green), and a Medium-term target bar (mid green) with its value printed inside in white. Each chart has a horizontal baseline and no y-axis, gridlines or legend. Each chart carries a black-outlined oval callout with an arrow connecting the Q1/25 bar top to the Q1/26 bar top showing the change. Canada Mobile Users (millions): Q1/25 8.2, Q1/26 8.7, target 11, callout +5.0%. Canada Self-Serve Transactions (% of all financial transactions): Q1/25 93.0, Q1/26 93.8, target 96, callout +80bps. U.S. Mobile Users (millions): Q1/25 5.1, Q1/26 5.2, target 6+, callout +1.8%. U.S. Self-Serve Transactions (% of all financial transactions): Q1/25 84.2, Q1/26 86.0, target 90, callout +180bps. Home & Auto Clients Digitally Engaged (% of total customers): Q1/25 71.9, Q1/26 79.2, target 90+, callout +730 bps. TD MyInsurance Transactions (millions): LTM Q1/25 1.4, LTM Q1/26 1.9, target 3+, callout +39%. Superscript footnote numbers appear in the headings and labels. No logos other than the TD logo at top right, which is a green square with a white TD monogram.
Slide 17
TD logo / More human. / Q1 2026 Brand and Sustainability Highlights / CHARM INDUSTRIAL / Announced multi-year agreement with Charm to purchase carbon removal credits / MassDevelopment / Purchased ~US$23MM MassDevelopment bond to support affordable housing in Massachusetts / Announced expansion of low-cost and no-cost banking options for Indigenous Peoples from Canada / 2026 / Brand Finance® / TOP 100 GLOBAL BRAND / 1 / 16 — TD INVESTOR PRESENTATION Q1 2026
Visuals: Five logo and image elements and one icon. (1) TD 'More human.' lockup: a solid bright green (about #33BB00) square with the white stylised 'TD' letters, followed by the black bold sans-serif wordmark 'More human.' with a period; the lockup is about 41% of slide width, placed at x 5.9 y 26.7. (2) CHARM INDUSTRIAL logo: a dark grey (about #4D4D4D) four-leaf clover/ clover-knot emblem to the left of the word 'CHARM' in a grey (about #4D4D4D) bold serif with 'INDUSTRIAL' in small caps below between double rules; at x 50.8 y 29.9 w 20.2 h 8.5. (3) MassDevelopment logo: a stacked geometric emblem of three interlocking blocks in navy (about #0B2E5E), cyan blue (about #1B9AD6) and lime green (about #7DC242) to the left of the wordmark 'MassDevelopment' in navy (about #0B2E5E) on the 'Mass' part and cyan (about #1B9AD6) on 'Development'; at x 72.5 y 30.3 w 23.3 h 6.7. (4) Brand Finance Top 100 Global Brand badge: a navy (about #1F3F8F) laurel wreath around a shield with a wave pattern and three dots, '2026' above the shield in navy, 'Brand Finance®' in navy below, then 'TOP 100' and 'GLOBAL BRAND' in navy capitals; the badge is shown on a white panel with a thin light-grey (about #D9D9D9) left edge and top edge line, placed at x 16.5 y 46.3 w 18.6 h 39.0 (265 by 312 px), not cropped, unboxed except for that grey edge, with the superscript '1' to its right at about x 32.7 y 78.4. (5) Key-and-hand icon: a bright green (about #1DB954) key with a dollar sign in the bow, above a dark green (about #0B6B3A) outlined open hand; the icon sits on a very pale green (about #EEF7EC) square tile at x 67.5 y 60.5 w 10.1 h 12.7 (102 by 72 px). Lighting is flat, no shadows; no photographs.
Slide 18
TD Bank Group
Overview of TD Bank Group
Credit Update
Strong Balance Sheet & Capital Position
17 — TD INVESTOR PRESENTATION Q1 2026
Visuals: Photograph: a low-angle view up the corner of a modern glass and metal office tower. A large green cladding panel carries a white, italic TD logo (letters 'TD') on a raised sign block at left. The sky at upper left is pale blue with white clouds, and the glass facade is grey and reflective. Lighting is soft daylight. Dominant colours are green, grey and white. The image is cropped to a full-height rectangle with a hard vertical edge at x 60.1%. It is not overlaid or tinted. Logo: the TD logo, a green square with white 'TD' letters, at top right. Chevrons: three thin right-pointing chevron icons, one at the left of each bar, at approximately x 45.9%, with heights of about 4.6% of the slide. The top chevron is light green, the middle chevron is dark green, and the bottom chevron is light green.
Slide 19
Well-reserved for elevated economic and credit uncertainty / Allowance Coverage Ratio (bps)1 / 140 / 126 / 120 / 101 / 100 / 97 / 99 / 95 / 89 / 86 / 74 / Q1’20 2 / 2020 2 / 2021 / 2022 / 2023 / 2024 / 2025 / Q1'26 / 18 / — TD INVESTOR PRESENTATION Q1 2026
Visuals: One line chart, titled Allowance Coverage Ratio (bps) with a superscript 1. The y-axis is labelled 100, 120 and 140 with a broken (non-zero) base and tick marks; no unit is printed beyond bps in the title. The x-axis has categories Q1'20 (superscript 2), 2020 (superscript 2), 2021, 2022, 2023, 2024, 2025 and Q1'26, drawn as a smooth curved line. Series values printed on the chart: Q1'20 74, 2020 126, 2021 97, 2022 86, 2023 89, 2024 95, 2025 101, Q1'26 99. The line is thick, solid, dark green (#008A00), with data labels in dark green (#03522C) placed above the points, except 74 which sits to the upper right of its point. No legend. The 2020 peak (126) and the 2025 peak (101) are the local maxima; no points are highlighted by colour. Y-axis is broken near the bottom with a short double slash mark on the axis at the Q1'20 end. The logo is the TD mark: a solid green square with white stylised TD letters, in the top-right corner.
Slide 20
History of strong credit quality / Net impaired loans and PCL ratios (bps) / Net impaired loans as a % of net loans and acceptances (bps) / Provision for credit losses as a % of net average loans and acceptances (bps) / 100 / 48 / 46 / 46 / 45 / 47 / Q1'26 / 41 43 / 38 / 39 / 32 / 34 / 41 / 40 Q1'26 / 37 / 37 / 34 / 34 / 33 / 36 / 41 / 20 / 25 / 24 / 14 / -3 / IFRS 9 / 2014 / 2015 / 2016 / 2017 / 2018 / 2019 / 2020 / 2021 / 2022 / 2023 / 2024 / 2025 / 19 / — TD INVESTOR PRESENTATION Q1 2026 / 1
Visuals: Line chart titled 'Net impaired loans and PCL ratios (bps)' with two series plotted over years 2014 to 2025 and a final Q1'26 point. Series 1, 'Net impaired loans as a % of net loans and acceptances (bps)', is a bright green line with circle markers and labels: 2014 46, 2015 48, 2016 46, 2017 38, 2018 39, 2019 33, 2020 32, 2021 24, 2022 20, 2023 25, 2024 36, 2025 40, Q1'26 41. Series 2, 'Provision for credit losses as a % of net average loans and acceptances (bps)', is a dark green line with circle markers and labels: 2014 34, 2015 34, 2016 41, 2017 37, 2018 37, 2019 45, 2020 100, 2021 -3, 2022 14, 2023 34, 2024 47, 2025 41, Q1'26 43. No y-axis, gridlines or scale are printed; values are shown only as labels. The x-axis is a thin light grey baseline with small tick marks at each year. A vertical dashed dark green line at about x 2019 start separates pre-IFRS 9 from IFRS 9 years, and the area to its right is shaded pale green #E6F1E0 with the label 'IFRS 9' (superscript 1) in grey #7F7F7F. The highest point 2020 (100) and the low 2021 (-3) are the extremes; no points are otherwise highlighted. Legend is top-left: a bright green line with dot marker for series 1 in bold, and a dark green line with dot marker for series 2 in regular weight. The TD logo is a solid green square #00B200-like tile with white 'TD' letters, about 3.3% wide.
Slide 21
Gross Lending Portfolio
Period-End Balances ($B unless otherwise noted)
Q4/25
Q1/26
Canadian Personal and Commercial Portfolio 614.5 619.3
Personal 479.5 482.1
Residential Mortgages 264.5 258.8
Home Equity Lines of Credit (HELOC) 147.9 156.4
Indirect Auto 32.1 32.0
Credit Cards 21.9 21.9
Other Personal 13.1 13.0
Unsecured Lines of Credit 10.6 10.5
Commercial Banking (including Small Business Banking) 135.0 137.2
U.S. Banking Portfolio (all amounts in US$) 175.0 172.9
Personal 89.4 89.7
Residential Mortgages 34.0 34.0
Home Equity Lines of Credit (HELOC)1 8.9 9.0
Indirect Auto 31.5 31.7
Credit Cards 14.1 14.1
Other Personal 0.9 0.9
Commercial Banking 85.6 83.2
Non-residential Real Estate 18.4 18.0
Residential Real Estate 10.2 10.2
Commercial & Industrial (C&I) 57.0 55.0
FX on U.S. Personal & Commercial Portfolio 70.2 62.1
U.S. Banking Portfolio ($) 245.2 235.0
Canadian Wealth Management and Insurance Portfolio 9.0 9.8
Wholesale Portfolio 93.3 103.4
Total2 962.0 967.5
20
— TD INVESTOR PRESENTATION Q1 2026
Visuals: A single table with three columns and 25 body rows plus one header row. Header row: 'Period-End Balances ($B unless otherwise noted)' spanning the label column, 'Q4/25' and 'Q1/26' as right-aligned value columns. Rows, label then Q4/25 then Q1/26: Canadian Personal and Commercial Portfolio 614.5 619.3 (bold); Personal 479.5 482.1 (bold, indented); Residential Mortgages 264.5 258.8; Home Equity Lines of Credit (HELOC) 147.9 156.4; Indirect Auto 32.1 32.0; Credit Cards 21.9 21.9; Other Personal 13.1 13.0; Unsecured Lines of Credit 10.6 10.5 (italic, further indented); Commercial Banking (including Small Business Banking) 135.0 137.2 (bold); U.S. Banking Portfolio (all amounts in US$) 175.0 172.9 (bold); Personal 89.4 89.7 (bold); Residential Mortgages 34.0 34.0; Home Equity Lines of Credit (HELOC) with superscript 1, 8.9 9.0; Indirect Auto 31.5 31.7; Credit Cards 14.1 14.1; Other Personal 0.9 0.9; Commercial Banking 85.6 83.2 (bold); Non-residential Real Estate 18.4 18.0; Residential Real Estate 10.2 10.2; Commercial & Industrial (C&I) 57.0 55.0; FX on U.S. Personal & Commercial Portfolio 70.2 62.1 (bold); U.S. Banking Portfolio ($) 245.2 235.0 (bold); Canadian Wealth Management and Insurance Portfolio 9.0 9.8 (bold); Wholesale Portfolio 93.3 103.4 (bold); Total with superscript 2, 962.0 967.5 (bold). No chart, photograph or diagram other than the TD logo.
Slide 22
Allowance for Credit Losses (ACL)
Highlights
ACL decreased $144 million quarter-over-quarter, reflecting:
– A $156 million impact of foreign exchange
– Improvement in the macroeconomic forecasts
– Partially offset by higher impaired allowance in the Wholesale Banking and U.S. commercial lending portfolios
While there are many potential scenarios that may impact the economic trajectory and credit performance, the Bank's fiscal 2026 PCLs are expected to be in the range of 40 to 50 basis points, consistent with prior guidance5
ACL1: $B and Coverage Ratios2
99 / 101 / 103 / 101 / 99 bps
United States
Canada
$9.6 / $9.6 / $9.7 / $9.7 / $9.6
57% / 56% / 55% / 55% / 54%
43% / 44% / 45% / 45% / 46%
Q1/25 / Q2/25 / Q3/25 / Q4/25 / Q1/26
ACL by Asset Type: $B
Q4/25
Q1/26
U.S. Strategic Card Partners' Share3
$0.4 / $0.4 / $2.3 / $2.2 / $2.8 / $2.8 / $4.3 / $4.2 / $9.7 / $9.6
$1.0 / $1.0 / $1.0 / $1.0 / $1.0 / $1.0
Residential Mortgages
Consumer / instalment and / other personal4
Credit Card
Business & / Government
Total
Performing ($B) / 0.28 / 0.30 / 2.0 / 1.9 / 2.3 / 2.3 / 3.5 / 3.3 / 8.1 / 7.9
Impaired ($B) / 0.08 / 0.09 / 0.3 / 0.3 / 0.5 / 0.5 / 0.8 / 0.9 / 1.6 / 1.7
Ratio3 (bps) / 11 / 12 / 88 / 83 / 670 / 681 / 125 / 120 / 101 / 99
This Slide contains forward-looking information. Please refer to the caution at the beginning of this presentation and the endnotes for this slide for material factors, risks and assumptions.
21 — TD INVESTOR PRESENTATION Q1 2026
Visuals: Chart 1, titled 'ACL¹: $B and Coverage Ratios²' (top right): a stacked column chart of five quarterly columns, Q1/25, Q2/25, Q3/25, Q4/25 and Q1/26, with no printed value axis or gridlines; the baseline is a thin dark line. Each column's total is printed above it: $9.6, $9.6, $9.7, $9.7, $9.6. Each column has two segments: the bottom Canada segment in dark green #008A00 with labels 43%, 44%, 45%, 45%, 46% (white text), and the top United States segment in light green #AED99E with labels 57%, 56%, 55%, 55%, 54% (dark green text). Above the columns is a dark green #008A00 line with circular markers and labels 99, 101, 103, 101, 99 bps (the last reads '99 bps'); the line has no printed axis. Legend at upper left: light green square labelled United States, dark green square labelled Canada. Chart 2, titled 'ACL by Asset Type: $B' (lower right): a clustered column chart with five categories, Residential Mortgages, Consumer instalment and other personal⁴, Credit Card, Business & Government and Total. Series Q4/25 is light green #AED99E and Q1/26 is dark green #008A00; a grey (#A6A6A6-like) segment marked $1.0 sits at the base of the Credit Card and Total columns for U.S. Strategic Card Partners' Share³. Labelled values: Residential Mortgages $0.4 and $0.4; Consumer $2.3 and $2.2; Credit Card $2.8 and $2.8; Business & Government $4.3 and $4.2; Total $9.7 and $9.6. No value axis is printed; column heights are proportional to these values. Legend at upper left lists Q4/25 (light green), Q1/26 (dark green) and U.S. Strategic Card Partners' Share³ (grey). Table beneath the chart: 4 rows with no header row printed; columns are row label then values in pairs. Row 1 'Performing ($B)': 0.28, 0.30, 2.0, 1.9, 2.3, 2.3, 3.5, 3.3, 8.1, 7.9. Row 2 'Impaired ($B)': 0.08, 0.09, 0.3, 0.3, 0.5, 0.5, 0.8, 0.9, 1.6, 1.7. Row 3 'Ratio³ (bps)': 11, 12, 88, 83, 670, 681, 125, 120, 101, 99. The table has thin light grey cell dividers and a dark green #006700 outer border. Logo: TD wordmark in a bright green square at top right, white 'TD' letters, roughly 42 by 37 pixels.
Slide 23
Gross Impaired Loans (GIL)
By Business Segment
Highlights
Gross impaired loans increased 2 basis points quarter-over-quarter, largely recorded in:
The U.S. Commercial and Canadian consumer portfolios
GIL: $MM and Ratios1
56
51
56
56
58 bps
$5,453
$4,866
$5,334
$5,420
$5,594
$5 / 6 bps
$5 / 7 bps
$4 / 5 bps
$3 / 3 bps
$3 / 3 bps
$421 / 41 bps
$327 / 34 bps
$600 / 69 bps
$572 / 61 bps
$586 / 57 bps
$1,999 / 34 bps
$1,820 / 31 bps
$1,865 / 31 bps
$1,942/ 32 bps
$1,994/ 32 bps
$3,028 / 109 bps
$2,714 / 109 bps
$2,865 / 116 bps
$2,903 / 118 bps
$3,011 / 128 bps
Q1/25
Q2/25
Q3/25
Q4/25
Q1/26
U.S. Banking
Canadian Personal & Commercial Banking
Wholesale Banking
Wealth Management & Insurance
22
— TD INVESTOR PRESENTATION Q1 2026
Visuals: Chart: stacked column chart with an overlaid line series, titled 'GIL: $MM and Ratios' with superscript footnote marker 1. The category axis shows Q1/25, Q2/25, Q3/25, Q4/25, Q1/26 with a horizontal baseline in dark green; no numeric y-axis is printed and no axis range is shown. Stacks from bottom to top: U.S. Banking (light green #AED99E), Canadian Personal & Commercial Banking (green #008A00), Wholesale Banking (dark green #006700), Wealth Management & Insurance (light grey #BFBFBF). Printed values, US Banking: Q1/25 $3,028 / 109 bps; Q2/25 $2,714 / 109 bps; Q3/25 $2,865 / 116 bps; Q4/25 $2,903 / 118 bps; Q1/26 $3,011 / 128 bps. Canadian Personal & Commercial Banking: Q1/25 $1,999 / 34 bps; Q2/25 $1,820 / 31 bps; Q3/25 $1,865 / 31 bps; Q4/25 $1,942 / 32 bps; Q1/26 $1,994 / 32 bps. Wholesale Banking (callouts with leader lines): Q1/25 $421 / 41 bps; Q2/25 $327 / 34 bps; Q3/25 $600 / 69 bps; Q4/25 $572 / 61 bps; Q1/26 $586 / 57 bps. Wealth Management & Insurance (thin grey band): Q1/25 $5 / 6 bps; Q2/25 $5 / 7 bps; Q3/25 $4 / 5 bps; Q4/25 $3 / 3 bps; Q1/26 $3 / 3 bps. Column totals in bold above each stack: $5,453; $4,866; $5,334; $5,420; $5,594. Line series in dark green (#008A00) with circular markers, values above each point: 56, 51, 56, 56, 58 bps (only the last point carries the unit 'bps'). Legend below the chart in two rows with small square swatches: U.S. Banking; Canadian Personal & Commercial Banking; Wholesale Banking; Wealth Management & Insurance. No points are highlighted. No photographs or icons other than the TD logo.
Slide 24
Provision for Credit Losses (PCL)
By Business Segment
Highlights
PCL increased quarter-over-quarter,
largely reflected in Wholesale Banking
Partially offset by lower provisions in
the Canadian Personal &
Commercial Banking segment
PCL: $MM and Ratios1,2,3
Wealth Management & Insurance
Wholesale Banking
Canadian Personal & Commercial Banking
U.S. Banking (net)
Corporate
$1,212
$72
$521
$451
$168
$1,341
$123
$622
$442
$154
$971
$71
$463
$317
$120
$982
$24
$537
$304
$117
$1,039
$172
$436
$295
$136
PCL Ratio (bps)
Q1/25
Q2/25
Q3/25
Q4/25
Q1/26
Canadian Personal & Commercial Banking
35
44
31
35
28
U.S. Banking (net)2
67
70
52
50
49
U.S. Banking & Corporate (gross)3
92
94
72
70
72
Wholesale Banking
29
51
31
11
70
Total Bank (gross)3
50
58
41
41
43
Total Bank (net)2,4
43
51
36
36
38
23
— TD INVESTOR PRESENTATION Q1 2026
Visuals: Stacked column chart titled PCL: $MM and Ratios with superscript 1,2,3, five columns for Q1/25, Q2/25, Q3/25, Q4/25 and Q1/26, each with a bold total above it ($1,212, $1,341, $971, $982, $1,039). Segments from bottom to top are Corporate, U.S. Banking (net), Canadian Personal & Commercial Banking, Wholesale Banking and a top segment; the legend lists Wealth Management & Insurance, Wholesale Banking, Canadian Personal & Commercial Banking, U.S. Banking (net) and Corporate, top to bottom. Printed values by column: Q1/25 Corporate $168, U.S. Banking (net) $451, Canadian Personal & Commercial Banking $521, Wholesale Banking $72; Q2/25 $154, $442, $622, $123; Q3/25 $120, $317, $463, $71; Q4/25 $117, $304, $537, $24; Q1/26 $136, $295, $436, $172. Wealth Management & Insurance has no visible segment. No y-axis or axis labels are printed; the x-axis is a baseline with tick marks at column boundaries. Table titled PCL Ratio (bps) with columns Q1/25, Q2/25, Q3/25, Q4/25, Q1/26 and rows: Canadian Personal & Commercial Banking 35, 44, 31, 35, 28; U.S. Banking (net)2 67, 70, 52, 50, 49; U.S. Banking & Corporate (gross)3 92, 94, 72, 70, 72; Wholesale Banking 29, 51, 31, 11, 70; Total Bank (gross)3 bold 50, 58, 41, 41, 43; Total Bank (net)2,4 bold white on dark green 43, 51, 36, 36, 38. The TD logo is a green square tile with white TD letters in the top right. A thin grey vertical rule divides the slide. No photographs.
Slide 25
Provision for Credit Losses (PCL)
Impaired and Performing
Highlights
PCL1 ($MM) / Q1/25 / Q4/25 / Q1/26
▪ Impaired PCL increased quarter-over-quarter, driven by:
– The Wholesale Banking and U.S. commercial lending portfolios
▪ Current quarter performing recovery primarily recorded in the U.S. Banking and Wholesale segments
Total Bank 1,212 982 1,039
Impaired 1,216 943 1,164
Performing (4) 39 (125)
Canadian Personal & Commercial Banking 521 537 436
Impaired 459 447 424
Performing 62 90 12
U.S. Banking (net) 451 304 295
Impaired 529 331 394
Performing (78) (27) (99)
Wholesale Banking 72 24 172
Impaired 33 28 216
Performing 39 (4) (44)
Corporate U.S. strategic cards partners' share 168 117 136
Impaired 195 137 130
Performing (27) (20) 6
Wealth Management & Insurance - - -
Impaired - - -
Performing - - -
24
— TD INVESTOR PRESENTATION Q1 2026
Visuals: One data table, titled PCL1 ($MM), with columns PCL1 ($MM) (row label column), Q1/25, Q4/25, Q1/26. Rows in order, with values: Total Bank 1,212 / 982 / 1,039 (dark green band); Impaired 1,216 / 943 / 1,164; Performing (4) / 39 / (125); Canadian Personal & Commercial Banking 521 / 537 / 436 (band); Impaired 459 / 447 / 424; Performing 62 / 90 / 12; U.S. Banking (net) 451 / 304 / 295 (band); Impaired 529 / 331 / 394; Performing (78) / (27) / (99); Wholesale Banking 72 / 24 / 172 (band); Impaired 33 / 28 / 216; Performing 39 / (4) / (44); Corporate U.S. strategic cards partners' share 168 / 117 / 136 (band); Impaired 195 / 137 / 130; Performing (27) / (20) / 6; Wealth Management & Insurance - / - / - (band); Impaired - / - / -; Performing - / - / -. Segment band rows are filled #006700 with white bold text; sub-rows are white with dark green #03522C text and thin dark green #006700 rule lines between rows. Values are right-aligned in columns. No chart. The TD logo is a small green square badge with white stylised TD letters, placed top right.
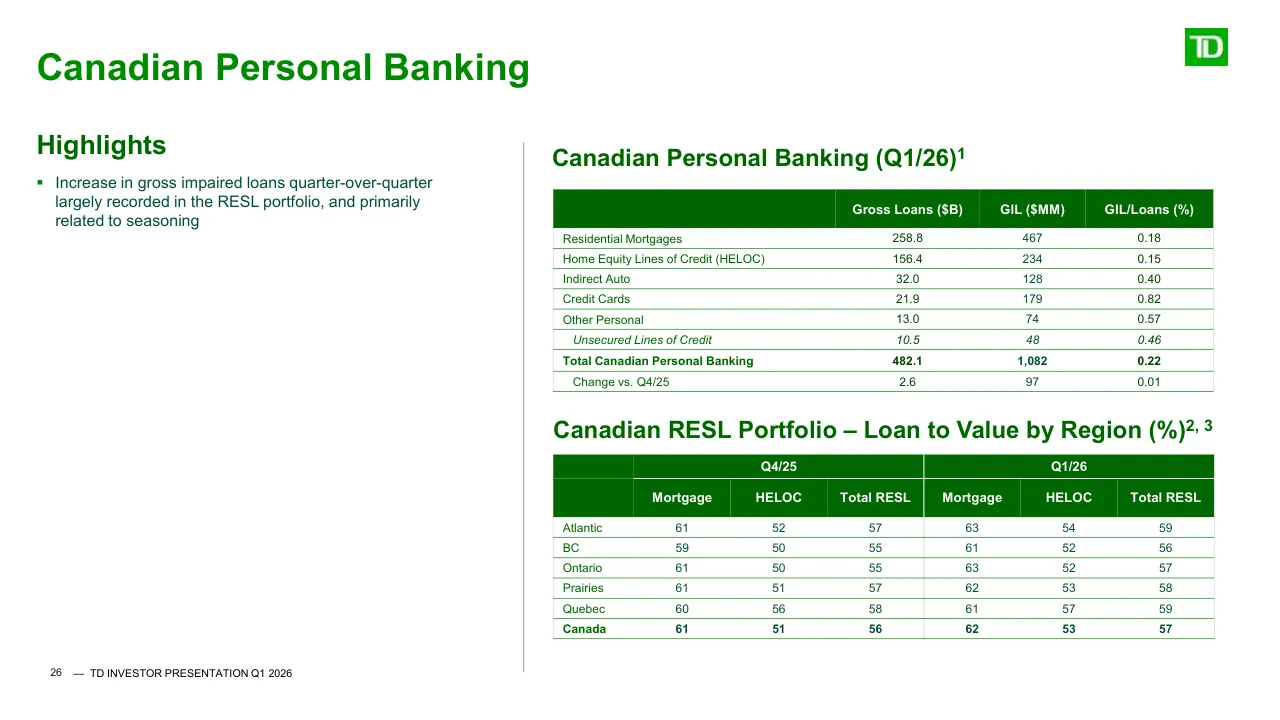
Slides 26 to 55 continue in the full text file.
Download this deck
The hosted PDF of every library deck is free for readers of the SlideDeck Co newsletter. Join with your email and the viewer and download appear here.
Preparing a results presentation or business update of your own? The SlideDeck Co Standard Deck is a slide library for business reviews, updates and plans.







