
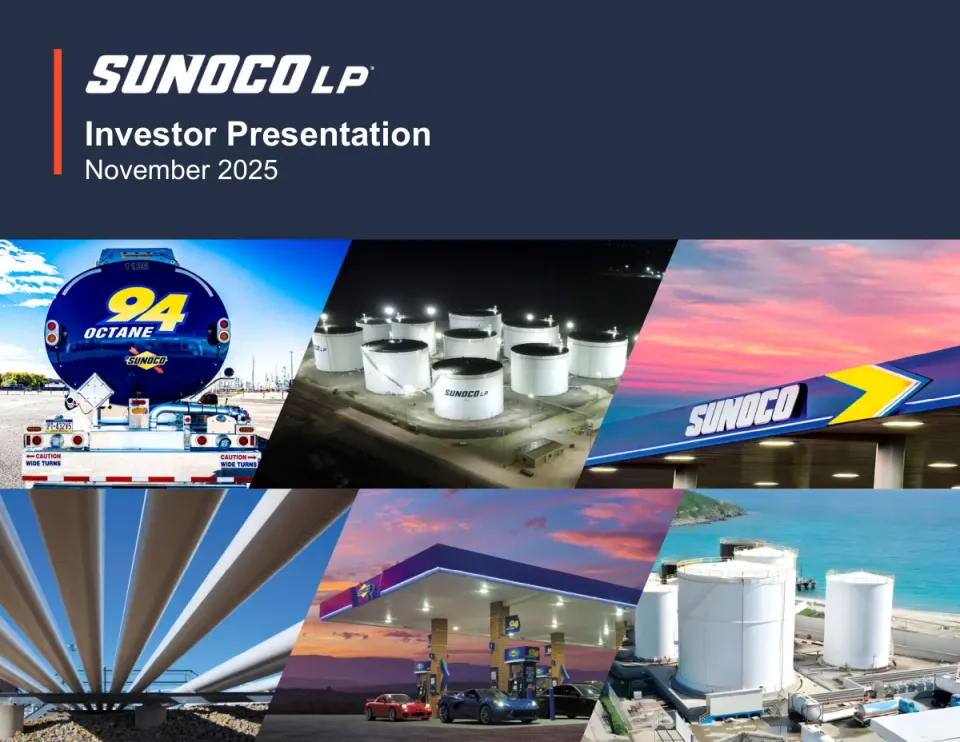
The deck opens with a standard forward-looking statements disclaimer and non-GAAP definitions, followed by investor relations contacts. It then moves into an investment overview covering the Parkland acquisition, the company's scale across fuel distribution and energy infrastructure, its balance sheet and distribution policy, and a structure chart for the Sunoco LP and SunocoCorp LLC entities. Next comes a section on distribution per unit growth and total return compared with the S&P 500 and midstream peers. The business segments section follows, covering fuel distribution, terminals, pipeline systems and the integrated refinery and marketing system, each with market context and performance charts. The deck then turns to future growth, including a timeline of acquisitions since 2018, a bolt-on strategy for fuel distribution, geographic growth priorities and a closing slide on midstream acquisition multiples. Its visual approach relies on bold section dividers, dense bullet text, and charts that pair company metrics with industry benchmarks.
Slides worth studying
Questions about this deck
How many slides or pages does the Sunoco LP investor presentation have?
The Sunoco LP investor presentation has 34 pages. Slide 2 contains the forward-looking statements disclaimer and non-GAAP definitions, and slide 4 summarizes fuel distribution operations and terminals.
What does the Sunoco LP investor presentation say about its fuel distribution scale?
Slide 4 states that Sunoco LP distributed more than 15 billion gallons, operates about 11,000 contracted locations, and serves 32 countries and territories. Slide 13 adds that the company operates about 200 company-operated locations concentrated in high-margin markets.
What does the Sunoco LP investor presentation say about its distribution growth?
Slide 8 lists annual distribution increases of 2% in 2023 and 4% in 2024, and says the company is targeting ongoing annual growth of at least 5%. The same slide gives an attractive distribution yield of about 7% as of 10/31/25.
What financial benefits does Sunoco LP expect from the Parkland acquisition according to the deck?
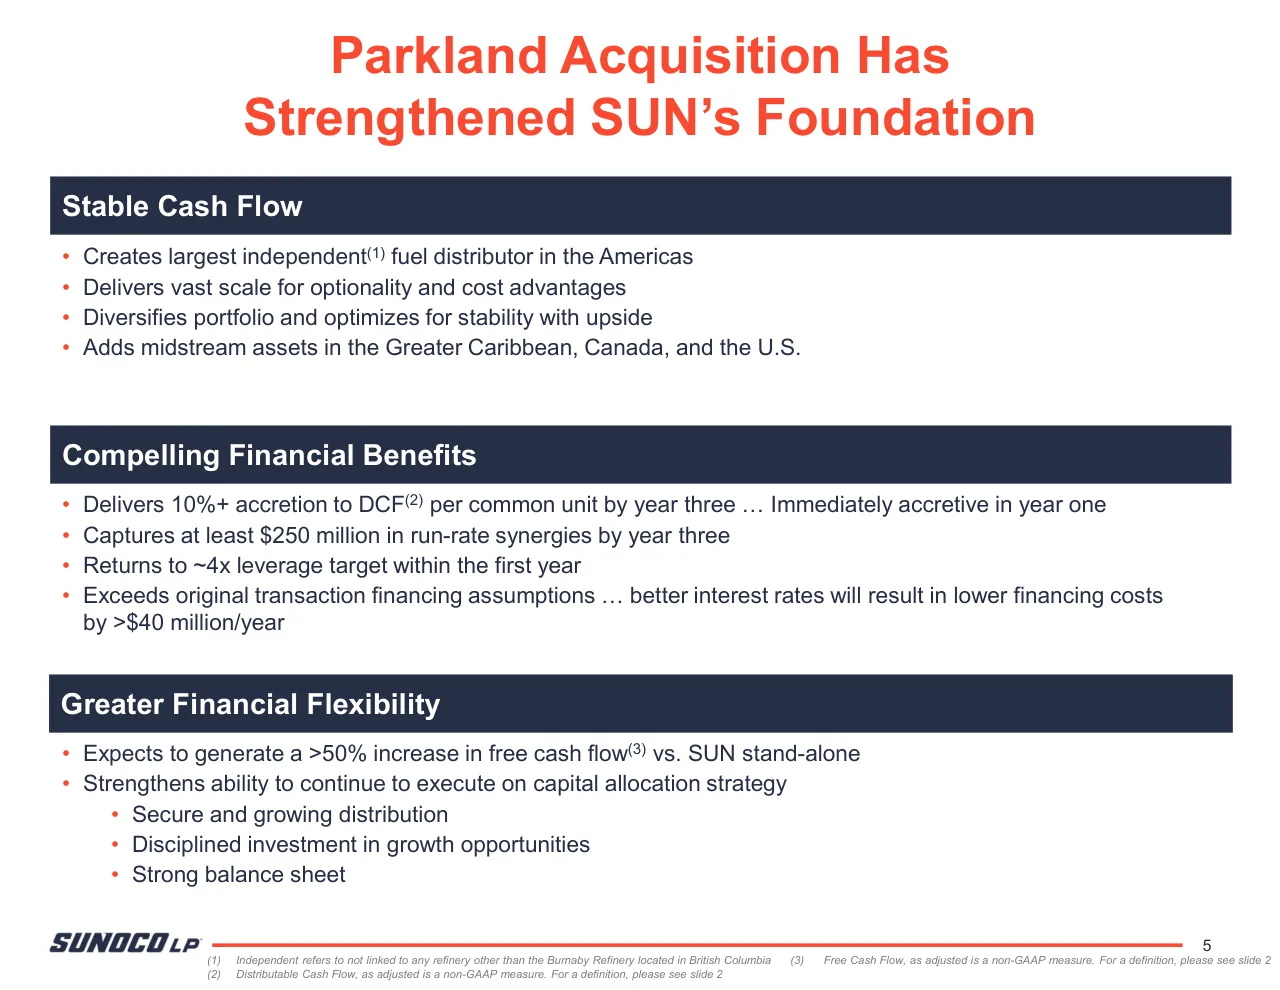
Slide 5 says the Parkland acquisition is expected to deliver 10%+ accretion to DCF per common unit by year three and to capture at least $250 million in run-rate synergies by year three. It also states the company expects to return to about 4x leverage within the first year.
Details
Review score: 7 out of 10, Effective
Presentation quality, judged with the SlideDeck Co review heuristic. Ask, evidence and idea merit are not rated here.
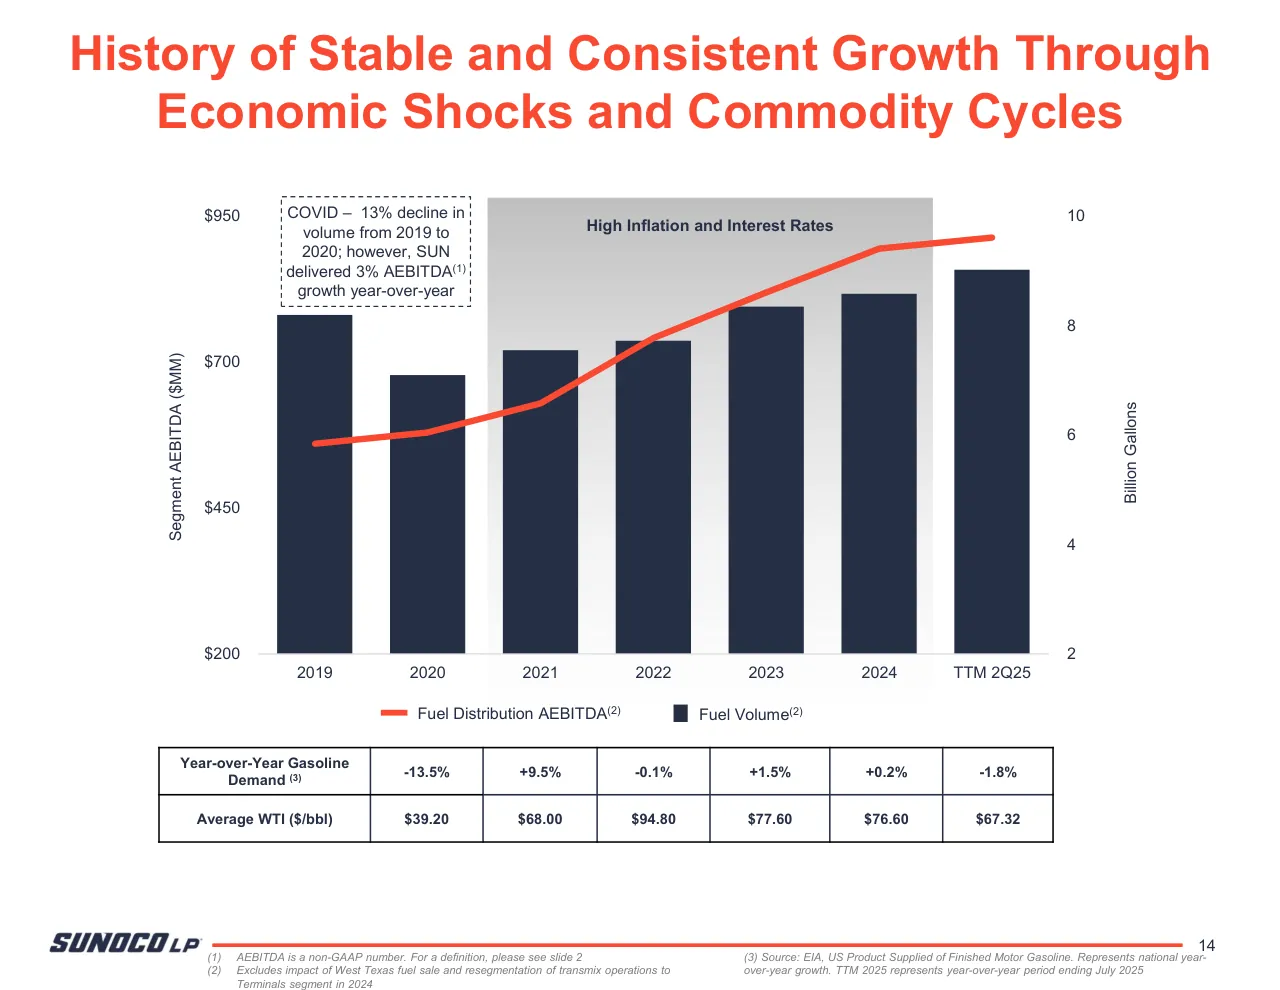
The deck has a clear route: overview, Parkland, financial profile, returns, segments, then growth, with section dividers (3, 12, 27) and a consistent template of navy bars, orange titles and a footer. Most content pages state their point in the title, and the charts are readable, for example the dual-axis chart on slide 14 with its COVID callout and the DCF growth chart on slide 10. Weaknesses are consequential: slide 2 is a wall of tiny legal text, many pages are dense with small bullets and microscopic footnotes (4, 8, 13, 17, 21), and the segment overview slides (13, 17, 21, 25) repeat a faint template with low-contrast grey panels and pale icons. The ending is weak, since slide 33 on midstream multiples is followed only by a logo page with no summary or call to action, and the deck mostly lists claims rather than building to a conclusion.
Worth keeping: Keep the consistent navy and orange system, the claim-style titles, the cover photo collage (slide 1), and the clear annotated charts on slides 10, 11 and 14.
Most useful repair: Shrink or move the legal text on slide 2 to an appendix, enlarge or cut the footnotes, and strengthen contrast on the grey overview panels and faded icons on slides 13, 17, 21 and 25.
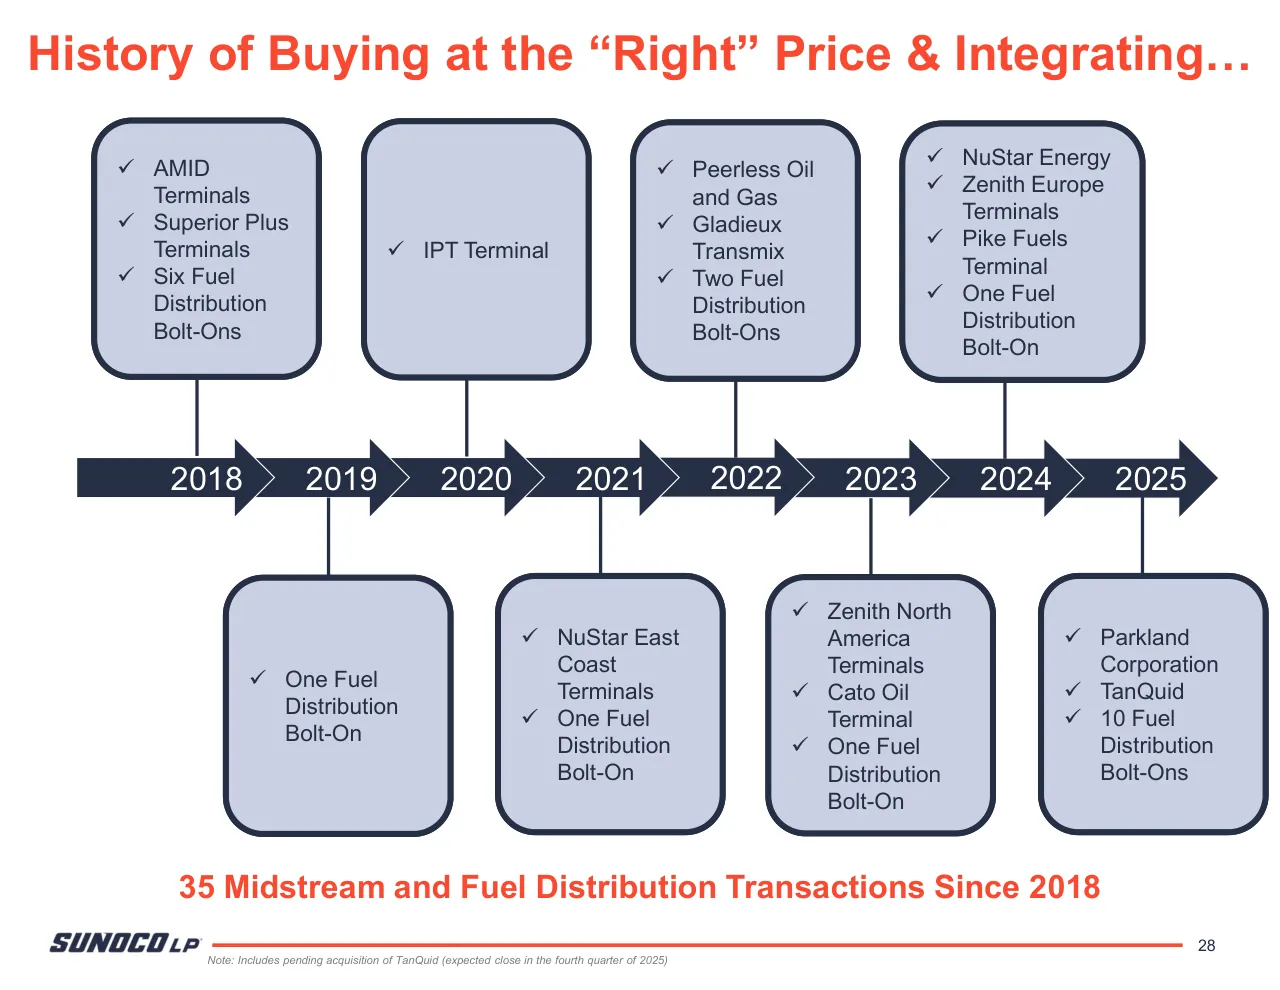
What would change the score: I would trim the bullet-heavy pages to one message each, add a closing summary slide, and fix slide 28, where the timeline boxes run to the slide edge and wrap awkwardly.
Confidence high. 34 of 34 pages inspected on contact sheets, 4 at readable size. Reviewed 2026-11-08. Model-assisted review (claude-sonnet-5-5).
Full text of the slides (34 slides)
Every slide's words and a description of its charts and images, so the deck can be searched and rebuilt. Also available as Markdown.
Slide 1
SUNOCO LP / Investor Presentation / November 2025
Visuals: Six photographs arranged as a 3 by 2 mosaic under the navy band, with slanted boundaries between tiles. Top row, left to right: (1) a close-up rear view of a dark blue tanker trailer with a large yellow '94 OCTANE' logo and a small yellow SUNOCO diamond, a PT-432V5 licence plate, red and white bumpers and 'CAUTION WIDE TURNS' signs, under a bright blue sky with white clouds. (2) An aerial night view of about eight white storage tanks with black roofs and lit rims, each with a SUNOCO LP logo, on a dark gravel site with a small grey building. (3) A dusk view with a pink and orange sky, showing a blue-and-yellow SUNOCO canopy fascia with a large yellow chevron and a SUNOCO wordmark over a lit fuel station ceiling. Bottom row, left to right: (4) a low-angle view up through white steel pipe-like columns against a clear blue sky, with gravel below. (5) A dusk view of a fuel canopy with a navy fascia and '94 OCTANE' signage, brick pillars, lit pumps, a red sports car and a dark blue Corvette parked in front, under a purple and orange sunset. (6) An aerial view of large white storage tanks beside turquoise sea and a sandy beach with a headland, on a concrete site. Lighting is natural in the daytime photos and artificial in the night and dusk photos. The photos are cropped to fill their tiles, with no borders and no overlay. Dominant colours are blue, white, pink-orange and navy. A small orange-red vertical accent bar sits at the left of the title block, outside the photographs.
Slide 2
Forward-Looking Statements / This presentation contains “forward-looking statements” within the meaning of the federal securities laws, including Section 27A of the Securities Act of 1933, as amended, and Section 21E of the / Securities Exchange Act of 1934, as amended. In this context, forward-looking statements often address future business and financial events, conditions, expectations, plans or ambitions, and often / include, but are not limited to, words such as “believe,” “expect,” “may,” “will,” “should,” “could,” “would,” “anticipate,” “estimate,” “intend,” “plan,” “seek,” “see,” “target” or similar expressions, or / variations or negatives of these words, but not all forward-looking statements include such words. Forward-looking statements by their nature address matters that are, to different degrees, / uncertain, such as statements about the anticipated benefits of the acquisition of Parkland Corporation (the “Transaction”). All such forward-looking statements are based upon current plans, / estimates, expectations and ambitions that are subject to risks, uncertainties and assumptions, many of which are beyond the control of Sunoco LP (“Sunoco” or “SUN”) that could cause actual / results to differ materially from those expressed in such forward-looking statements. Important risk factors that may cause such a difference include, but are not limited to: the ability of Sunoco to / integrate the business of Parkland Corporation (“Parkland”) successfully and to achieve anticipated synergies and value creation; the tax treatment, unforeseen liabilities, future capital expenditures, / revenues, expenses, earnings, synergies, economic performance, indebtedness, financial condition, losses, prospects, business and management strategies for the management, expansion and / growth of the combined company’s operations, including the possibility that any of the anticipated benefits of the transaction will not be realized or will not be realized within the expected time period; / potential litigation relating to the transaction that could be instituted against Sunoco, SunocoCorp LLC, Parkland and/or their respective current or former directors; the risk that disruptions from the / transaction will harm Sunoco’s business, including current plans and operations and that management’s time and attention will be diverted on transaction-related issues; potential adverse reactions / or changes to business relationships, including with employees, suppliers, customers, competitors or credit rating agencies, resulting from the completion of the transaction; rating agency actions / and Sunoco’s ability to access short-and long-term debt markets on a timely and affordable basis; dilution caused by Sunoco’s issuance of additional units representing limited partner interests in / connection with the transaction; fees, costs and expenses and the possibility that the transaction may be more expensive to complete than anticipated; and those risks described in Item 1A of / Sunoco’s Annual Report on Form 10-K, filed with the Securities and Exchange Commission (the “SEC”) on February 14, 2025, and in Item 1A of Sunoco’s Quarterly Report on Form 10-Q for the / quarter ended June 30, 2025, filed with the SEC on August 7, 2025. Those disclosures are incorporated by reference in this presentation. While the list of factors presented here is considered / representative, no such list should be considered to be a complete statement of all potential risks and uncertainties. Unlisted factors may present significant additional obstacles to the realization of / forward-looking statements. Readers are cautioned not to place undue reliance on this forward-looking information, which is as of the date of this presentation. Sunoco does not intend to update / these statements unless required by the securities laws to do so, and Sunoco undertakes no obligation to publicly release the result of any revisions to any such forward-looking statements that may / be made to reflect events or circumstances after the date of this presentation. / This presentation includes certain non-GAAP financial measures as defined under SEC Regulation G. Adjusted EBITDA (“AEBITDA”) is defined as earnings before net interest expense, income / taxes, depreciation, amortization and accretion expense, non-cash unit-based compensation expense, gains and losses on disposal of assets, non-cash impairment charges, losses on / extinguishment of debt, unrealized gains and losses on commodity derivatives, inventory valuation adjustments, and certain other operating expenses reflected in net income that Sunoco does not / believe are indicative of ongoing core operations. Distributable Cash Flow, as adjusted (“DCF”), is defined as AEBITDA less cash interest expense, including the accrual of interest expense related / to Sunoco’s long-term debt which is paid on a semi-annual basis, current income tax expense, maintenance capital expenditures and other non-cash adjustments. For DCF, certain transaction- / related adjustments and non-recurring expenses are excluded. Free Cash Flow, as adjusted (“FCF”) is defined as DCF less distributions and incentive distribution rights. / This presentation includes the forward-looking non-GAAP measures of FCF and synergies. Due to the forward-looking nature of the aforementioned non-GAAP financial measures, management / cannot reliably or reasonably predict certain of the necessary components of the most directly comparable forward-looking GAAP measures without unreasonable effort, due to the inherent difficulty / in quantifying certain amounts due to a variety of factors, including the unpredictability of commodity price movements and future charges or reversals outside the normal course of business which / may be significant. Accordingly, Sunoco is unable to present a quantitative reconciliation of such forward-looking non-GAAP financial measures to their most directly comparable forward-looking / GAAP financial measures. / Sunoco Investor Relations Contact Information / Scott Grischow / Senior Vice President – Finance, Treasurer / (214) 840-5660 / [email protected] / Brian Brungardt, CFA / Director – Investor Relations / (214) 840-5437 / [email protected] / SUNOCO LP / 2
Slide 3
SUNOCO LP
Investment Overview
Visuals: Photograph: aerial view of a tank farm of large cylindrical storage tanks with grey and white domed roofs, pipework and small structures visible between them. The tanks fill the frame from edge to edge, shot from above at an oblique angle. The photo is cropped by the inset box and tinted by a navy translucent overlay. The lower quarter carries a large, faint, slanted letterform watermark in a lighter slate tone. Logo: SUNOCO LP wordmark in bold italic navy capitals with a small registered-trademark mark, set on a white tab in the top-left corner.
Slide 4
Largest Independent Fuel Distributor in the Americas
and Leading Operator of Energy Infrastructure
>15 billion
Gallons
Distributed
(1)
Europe(1)
~11,000
Contracted
Locations
32
Countries and
Territories
>160
Owned
Terminals(2)
~14,000
Miles of
Pipeline
Hawaii
Fuel Distribution Operations
Contracted Fuel Locations
Transmix/Race Fuels
Terminals
Burnaby Refinery
Pipelines
4
Note: Independent refers to not linked to any refinery other than the Burnaby Refinery located in British Columbia
(2) >160 terminals are owned and operated by Sunoco. Additionally, Sunoco utilizes over 200 3rd party terminals
(1) Includes pending acquisition of TanQuid (expected close in the fourth quarter of 2025)
Visuals: A map of North America and the Caribbean, with a Europe inset and a Hawaii inset. Contiguous US and southern Canada are filled dark navy (#262F47) as fuel distribution operations. Mexico, Canada's far north, Central America and South America are light grey (about #E3E3E3). Over the navy areas are small blue (#3D8BF5 approximately) dots marking contracted fuel locations, dense in the eastern US and sparse in the west. Red (#FF0000) circular dots mark terminals across the US, Canada, Caribbean, and Europe. Green (#4CD628 approximately) dots mark transmix/race fuel sites, including points in Quebec, Ohio, Pennsylvania, Virginia, Texas, and Alabama. A magenta (#E020E0 approximately) triangle marks the Burnaby Refinery on the British Columbia coast. Yellow (#F5E21A approximately) lines mark pipelines, concentrated in Texas, Oklahoma, Kansas, the Gulf coast, and the Midwest. The Europe inset is a rounded-corner box showing Ireland, the UK, Benelux, Germany, Poland and neighbouring countries in mid grey with a light grey surround, with red terminal dots in Belgium, the Netherlands, Germany, Poland and Ireland. The Hawaii inset is a rounded-corner box with navy islands, blue contracted dots and red terminal dots. A legend with navy square and coloured dot or line keys sits to the right of the map. The map is not cropped at the edges except at the bottom right where it stops at the frame edge. No photographs or logos other than the Sunoco LP logo.
Slide 5
Parkland Acquisition Has
Strengthened SUN’s Foundation
Stable Cash Flow
Creates largest independent(1) fuel distributor in the Americas
Delivers vast scale for optionality and cost advantages
Diversifies portfolio and optimizes for stability with upside
Adds midstream assets in the Greater Caribbean, Canada, and the U.S.
Compelling Financial Benefits
Delivers 10%+ accretion to DCF(2) per common unit by year three … Immediately accretive in year one
Captures at least $250 million in run-rate synergies by year three
Returns to ~4x leverage target within the first year
Exceeds original transaction financing assumptions … better interest rates will result in lower financing costs by >$40 million/year
Greater Financial Flexibility
Expects to generate a >50% increase in free cash flow(3) vs. SUN stand-alone
Strengthens ability to continue to execute on capital allocation strategy
Secure and growing distribution
Disciplined investment in growth opportunities
Strong balance sheet
5
(1) Independent refers to not linked to any refinery other than the Burnaby Refinery located in British Columbia
(3) Free Cash Flow, as adjusted is a non-GAAP measure. For a definition, please see slide 2
(2) Distributable Cash Flow, as adjusted is a non-GAAP measure. For a definition, please see slide 2
Visuals: none. The only non-text graphic is the SUNOCO LP wordmark logo in the footer (navy wordmark with italic 'LP', 288 by 39 pixels) and a thin red horizontal rule, which are described under elements.
Slide 6
Compelling Long-Term Investment
Stable Cash Flow
Strong Financial Profile
Accretive Growth
Diversified Portfolio – Operations across the U.S., Canada, the Greater Caribbean, and Europe
Fuel Distribution – Proven history of generating stable income in various market environments; scale and SUN’s proprietary brands are key differentiators that enable higher margin capture
Midstream – Critical nature of assets ensures long-term operations; vertical integration supports high asset utilization and more margin capture along the value chain
Strong Balance Sheet and Liquidity Position – Provides financial flexibility for growth and reduces risk
Growing Income for Investors – Consistently maintained or increased distributions since IPO in 2012
Balanced and Disciplined Capital Allocation Strategy – Focused on distribution growth, accretive growth opportunities, and a strong balance sheet
Consistent Value Creation for Unitholders – Only AMZI constituent to grow DCF(1) per common unit for the last eight consecutive years (2017 - 2024); expect continued growth in 2025 and beyond
Proven Capital Allocation – Since 2017, deployed $19 billion of growth and acquisition capital, increasing DCF(1) per common unit by approximately 60%
Significant Growth Opportunities – Expansive, diversified, and accretive pipeline of investment opportunities
(1) Distributable Cash Flow, as adjusted is a non-GAAP measure. For a definition, please see slide 2
6
Slide 7
Evolution of Asset Portfolio Has Enhanced
Income Stability and Financial Strength
Largest
independent(1) fuel
distributor in the
Americas with a
proven history of
stable cash flows
Pipeline systems
and terminals
have a history of
stable cash flows
2022
2023
2024
SUN
TTM 6/30/25
Combined pro forma
TTM 6/30/25
Fuel Distribution
Midstream
Refinery
7
(1) Independent refers to not linked to any refinery other than the Burnaby Refinery located in British Columbia
Visuals: Stacked column chart with five columns: 2022, 2023, 2024, SUN TTM 6/30/25, and Combined pro forma TTM 6/30/25. Series are Fuel Distribution (navy, top segment), Midstream (red, middle segment) and Refinery (grey, bottom segment, present only on the combined column). No y-axis, values, units or gridlines are printed; heights are unlabelled, so relative heights are about: 2022 total about 59 percent of plot height with Midstream a thin band of about 4 percent; 2023 total about 60 percent with Midstream about 4 percent; 2024 total about 75 percent with Midstream about 35 percent; SUN total about 83 percent with Midstream about 52 percent; Combined total about 100 percent with Midstream about 35 percent of height and Refinery about 9 percent. Legend below the chart in one row: navy square Fuel Distribution, red square Midstream, grey square Refinery. Two red curly brackets on the right of the combined column: the upper bracket spans the navy Fuel Distribution segment and is labelled by a dashed red-outlined callout; the lower bracket spans the red Midstream segment and is labelled by a second dashed red-outlined callout. Footnote marker (1) is superscripted in the first callout. Logo: SUNOCO LP wordmark in navy bold italic sans-serif. A thin red horizontal rule runs from about x 16.5 to x 92 at the footer level.
Slide 8
Strong Financial Profile
Financial Overview
Balance Sheet and Liquidity
Market capitalization: ~$11 billion(1)
Enterprise value: ~$26 billion(1)
Revenue: ~$41 billion(2)
Core constituent of the Alerian MLP Index (AMZ) and
the Alerian MLP Infrastructure Index (AMZI)
Unanimous “Buy / Overweight” rating by equity
analyst coverage
Ample liquidity under $2.5 billion unsecured
revolving credit facility
Strong credit profile with multiple credit rating
upgrades since 2017
Current ratings(3): BB+/Ba1/BB+ (all stable)
Unsecured capital structure with 98% fixed rate debt
Senior Notes have a weighted average coupon of
5.7% with weighted average tenor of ~4.4 years
Committed to 4.0x long-term leverage target
Distribution
Capital Allocation Priorities
Attractive distribution yield of ~7%(1)
Consistently maintained a distribution coverage ratio
>1.8x since 2022
Maintained distribution through significant market
turbulence (e.g. COVID, inflation, commodity
volatility)
Annual distribution increases: 2% (2023), 4% (2024)
Transitioned to quarterly distribution increases in
2025, targeting ongoing annual growth of at least 5%
Secure and growing distribution
Disciplined investment in growth opportunities
Strong balance sheet
(1) As of 10/31/25
(2) Represents the pro forma trailing 12-month Sunoco and Parkland reported revenue through 6/30/25
(3) Senior unsecured credit ratings of S&P, Moody's, and Fitch, respectively. Ratings are not recommendations to
buy, sell, or hold securities and may be revised or revoked at any time at the sole discretion of the rating
organization.
8
Visuals: None. The slide has no charts, photographs, diagrams or icons; the only graphic elements are the four navy header bars, the red footer rule and the Sunoco LP wordmark logo in the bottom-left corner.
Slide 9
Flexibility and Optionality for Investors
Sunoco LP (NYSE: SUN)
SunocoCorp LLC (NYSE: SUNC)
• Structured as a partnership
• Pass-through entity; not subject to corporate taxation
• K-1 issuer
• Owns 100% of assets and liabilities
• Structured as an LLC
• Taxed as a corporation
• 1099 issuer
• Sole assets are Sunoco LP units; no debt
• Minimal corporate income taxes expected for at least five years
Operating Assets and Subsidiaries
Sunoco LP NYSE:SUN
SUN Distributions
SUN Unitholders ~73% Limited Partner Interest in SUN
SunocoCorp LLC NYSE:SUNC ~27% Limited Partner Interest in SUN
SUNC Dividends
SUNC Shareholders
SUNOCO LP
9
Visuals: Diagram with a vertical flow of three orange-outlined rectangles on the left, connected by solid dark navy arrows, and two navy-outlined ellipses on the right connected by dashed navy arrows. Top rectangle 'Operating Assets and Subsidiaries' contains four small dark navy line icons in a row: a cement mixer truck, a storage tank, a pipe valve with fittings, and a refinery/plant tower cluster. Solid downward arrow from this rectangle to the middle rectangle 'Sunoco LP NYSE:SUN'. Solid downward arrow labelled 'SUN Distributions' from the middle rectangle to the bottom rectangle 'SunocoCorp LLC NYSE:SUNC ~27% Limited Partner Interest in SUN'. Dashed arrow labelled 'SUN Distributions' runs right from the middle rectangle to the ellipse 'SUN Unitholders ~73% Limited Partner Interest in SUN'. Dashed arrow labelled 'SUNC Dividends' runs right from the bottom rectangle to the ellipse 'SUNC Shareholders'. No photographs; no charts; no printed values beyond the stated percentages.
Slide 10
Meaningful and Consistent Growth / Since 2017, SUN Has Materially Grown DCF(1) / per Common Unit by ~60%… / …Expanding Capital / Allocation Opportunities / $6.00 / $5.50 / $5.00 / $4.50 / $4.00 / $3.50 / $3.00 / $2.50 / 2017 2018 2019 2020 2021 2022 2023 2024 TTM 2Q25 / DCF(1) per Common Unit / Distribution per Common Unit / Continuation of proven capital / allocation strategy: / • Secure and growing distribution / • Disciplined investment in / growth opportunities / • Strong balance sheet / ~7% CAGR (2017 – TTM 2Q25) / (1) Distributable Cash Flow, as adjusted is a non-GAAP measure. For a definition, please see slide 2 / 10
Visuals: Combined column and line chart. Title of chart: none printed; header band above it reads Since 2017, SUN Has Materially Grown DCF(1) per Common Unit by ~60%. Y-axis: Distributable cash flow and distribution in US dollars per common unit, linear, range $2.50 to $6.00, gridlines absent, labels at $0.50 steps. X-axis: fiscal years 2017, 2018, 2019, 2020, 2021, 2022, 2023, 2024, and TTM 2Q25 (trailing twelve months to second quarter 2025). Series 1, DCF per Common Unit, navy columns with values about 3.50 (2017), about 3.88 (2018), about 3.89 (2019), about 4.28 (2020), about 4.48 (2021), about 5.10 (2022), about 5.17 (2023), about 5.60 (2024), about 5.67 (TTM 2Q25); no values are printed so all are estimates. Series 2, Distribution per Common Unit, green line stepping with values about 3.34 for 2017 through 2022, about 3.50 for 2023, about 3.70 for 2024, and about 3.87 for TTM 2Q25; estimates. Legend below the x-axis: navy square labelled DCF(1) per Common Unit and green line labelled Distribution per Common Unit. Annotation: a red block arrow with thin navy outline rising from the 2017 column to above the 2024 column, with white rotated text ~7% CAGR (2017 – TTM 2Q25) lying along it. Highlighted points: none marked with symbols. Right side: a navy right-facing brace bracketing the bullet text.
Slide 11
SUN Continues to Offer Material Upside / After Eight Years of Outperformance… / …SUN Continues to Trade at Attractive / Valuations(2) vs. the S&P 500… / Lowest Decile EV / AEBITDA / Top Decile Dividend Yield / …and Midstream Energy Peers(3) / 425% / SUN +384%(1) / (20% annual return) / 325% / 225% / S&P 500 +233%(1) / (15% annual return) / Total Return1 / 125% / 11.0x / 25% / AMZI +51%(1) / (5% annual return) / LTM EV/AEBITDA(4) / 9.0x / (75%) / Peer Average ~9.7x / 2017 2018 2019 2020 2021 2022 2023 2024 2025 / SUN / S&P 500 / AMZI / 7.0x / Peer 1 / SUN / Peer 2 / Peer 3 / Peer 4 / Peer 5 / Peer 6 / Peer 7 / Peer 8 / Peer 9 / Peer 10 / Peer 11 / SUNOCO LP / 11 / (1) Source: Bloomberg, as of 10/31/25. Defined as price appreciation plus reinvestment of dividends/distributions / (2) Source: FactSet, as of 10/31/25 / (3) Peer group includes: CQP, DKL, EPD, ET, GEL, GLP, HESM, MPLX, PAA, USAC, WES / (4) Source: FactSet EV = Current Market cap + preferred equity + minority interest + net debt; EBITDA = TTM Adjusted EBITDA, as of 2Q25
Visuals: Chart 1 (left): line chart titled by the header 'After Eight Years of Outperformance…', with a y-axis titled 'Total Return1' showing labelled ticks (75%), 25%, 125%, 225%, 325%, 425% and an x-axis of years 2017 to 2025 (annual tick labels, no units printed beyond the percent axis). Three series with a legend at the bottom reading SUN (navy line), S&P 500 (green line), AMZI (red line). Endpoint labels: SUN +384% (20% annual return) in navy at the top right, S&P 500 +233% (15% annual return) in green, AMZI +51% (5% annual return) in red. SUN starts at 0% in 2017, dips to about (50%) near early 2020 and ends near 384%. S&P 500 starts at 0%, dips to about 0% in 2020, and ends at +233%. AMZI starts at 0%, falls to about (60%) in 2020 and ends at +51%. A thin grey horizontal baseline sits at 0%. No other values are printed; intermediate values are not labelled. Two checkmark icons: each is a red check mark inside a navy-outlined square box (about 118 by 117 pixels), the first beside 'Lowest Decile EV / AEBITDA' and the second beside 'Top Decile Dividend Yield'. Chart 2 (right bottom): vertical bar chart titled by the header '…and Midstream Energy Peers(3)', y-axis titled 'LTM EV/AEBITDA(4)' with labelled ticks 7.0x, 9.0x, 11.0x (axis starts at 7.0x). X-axis categories in order: Peer 1, SUN, Peer 2 through Peer 11. Bars are navy (#262F47) except the SUN bar which is red (#FA4931). Values are not printed; approximate heights: Peer 1 about 8.1x, SUN about 8.6x, Peer 2 about 8.6x, Peer 3 about 9.2x, Peer 4 about 9.3x, Peer 5 about 9.4x, Peer 6 about 9.7x, Peer 7 about 10.1x, Peer 8 about 10.3x, Peer 9 about 10.5x, Peer 10 about 10.7x, Peer 11 about 10.9x. A red dashed horizontal line marks Peer Average ~9.7x across the chart. Logo: SUNOCO LP wordmark in navy bold italic at bottom-left.
Slide 12
SUNOCO LP
Business Segments
Visuals: Aerial photograph of large cylindrical white storage tanks with floating roofs, seen from above at an oblique angle, with pipework and a valve manifold visible at the right edge and in the upper middle. The photograph is full-width within the inset frame, not cropped to a shape, and has a dark navy translucent overlay (roughly 70% opacity, colour about #2A3550) that darkens and desaturates it. Across the lower part of the photograph is a large translucent slanted lettering watermark in lighter grey-blue (about #4A5468 at about 35% opacity) forming oversized letterforms with diagonal strokes. Logo: the SUNOCO LP wordmark in bold, slanted, heavy navy capitals (about #1F2A44) with a small registered mark after LP, placed on the white tab at top-left.
Slide 13
Diverse and Stable Business Segments
Fuel Distribution Overview
• Largest independent(1) fuel distributor in the Americas with over
15 billion gallons distributed across a broad network
• Stable margins driven by scale, diversity, and proprietary brands
• Network of ~11,000 contracted locations provides diverse mix of
geography and channels
• ~200 company-operated locations strategically concentrated in
high-margin markets with durable competitive advantages
• Proprietary fuel brands enable long-term supply contracts with
expanded margins
• Segment gross margin anchored by stable, ratable lease income from
real estate portfolio and 7-Eleven take-or-pay contract
Key SUN Investment Highlights
• History of stable and consistent growth through economic shocks and
commodity cycles
• SUN well positioned within industry dynamics
• Geographic diversity creates stability with growth opportunities
13
(1) Independent refers to not linked to any refinery other than the Burnaby Refinery located in British Columbia
Visuals: Four line-art icons stacked down the left margin, all outline style with no fill: (1) top, navy #262F47 tanker truck with a cylindrical tank body, cab and four wheels, facing right; (2) grey #A6A6A6 pair of cylindrical storage tanks of different heights, one larger and one smaller, banded with vertical stripes; (3) grey #A6A6A6 pipeline with a valve and wheel on top and two elbow pipes, forming an inverted U; (4) grey #A6A6A6 refinery cluster of towers, columns and a vessel on a base line. A dark-to-light gradient wedge image sits between the icons and the panel, navy #262F47 at its upper-left edge fading to white/light grey toward the panel, tapering in width from top to bottom and overlapping the panel's left edge. No photographs. The Sunoco LP wordmark logo is bottom-left in navy #262F47 bold italic.
Slide 14
History of Stable and Consistent Growth Through
Economic Shocks and Commodity Cycles
COVID – 13% decline in
volume from 2019 to
2020; however, SUN
delivered 3% AEBITDA(1)
growth year-over-year
High Inflation and Interest Rates
$950
10
8
$700
6
Segment AEBITDA ($MM)
Billion Gallons
$450
4
$200
2
2019 2020 2021 2022 2023 2024 TTM 2Q25
Fuel Distribution AEBITDA(2)
Fuel Volume(2)
Year-over-Year Gasoline Demand (3) | -13.5% | +9.5% | -0.1% | +1.5% | +0.2% | -1.8%
Average WTI ($/bbl) | $39.20 | $68.00 | $94.80 | $77.60 | $76.60 | $67.32
(1) AEBITDA is a non-GAAP number. For a definition, please see slide 2
(2) Excludes impact of West Texas fuel sale and resegmentation of transmix operations to
Terminals segment in 2024
(3) Source: EIA, US Product Supplied of Finished Motor Gasoline. Represents national year-
over-year growth. TTM 2025 represents year-over-year period ending July 2025
14
Visuals: One combination chart. Type: vertical bar chart (Fuel Volume, navy #262F47) with a line overlay (Fuel Distribution AEBITDA, red #FA4931). Left y-axis titled 'Segment AEBITDA ($MM)' with labelled ticks $200, $450, $700, $950 (linear, $200 to $950). Right y-axis titled 'Billion Gallons' with ticks 2, 4, 6, 8, 10. X-axis categories 2019, 2020, 2021, 2022, 2023, 2024, TTM 2Q25. Values are not printed; estimated Fuel Volume bars in billion gallons: about 8.2 (2019), about 7.1 (2020), about 7.5 (2021), about 7.7 (2022), about 8.3 (2023), about 8.6 (2024), about 9.0 (TTM 2Q25). Estimated Fuel Distribution AEBITDA line in $MM: about 560 (2019), about 575 (2020), about 625 (2021), about 740 (2022), about 800 (2023), about 895 (2024), about 910 (TTM 2Q25). Legend below the chart: red line symbol labelled 'Fuel Distribution AEBITDA(2)' and navy square labelled 'Fuel Volume(2)'. A grey vertical gradient band (about #BFBFBF at top fading to white at bottom) spans 2021 to 2024 behind the bars, labelled 'High Inflation and Interest Rates' at its top. A dashed-outline box at upper left, over the 2019 and 2020 area, contains the COVID note. Table below the chart: 2 rows by 7 columns with a header column. Row 1 'Year-over-Year Gasoline Demand (3)': -13.5%, +9.5%, -0.1%, +1.5%, +0.2%, -1.8% (columns 2019 to TTM 2Q25 order as the chart categories). Row 2 'Average WTI ($/bbl)': $39.20, $68.00, $94.80, $77.60, $76.60, $67.32. Table has black 1 pt grid lines and a black outer border. No photographs.
Slide 15
SUN Well Positioned Within Industry Dynamics / Industry Facing Escalating / Costs(1) and Flat/Lower / Fuel Demand(2) / Wages: +49% / Credit Card Fees: +42% / Fuel Demand: -6% / Indexed to FY19 / 2019 1H25 / Wages / Credit Card / Fees / Fuel / Demand / Higher fuel margin required to offset / higher operating costs and/or / flat/decreasing store gross profit / Cost Structure and Scale / Determines Impact of / Higher Breakeven Margin / Illustrative Retail Margin Example / Marginal Breakeven Cost / Inflation increases / marginal breakeven cost / 600 / 500 / 400 / 300 / 200 / 100 / 0 / More Efficient / Less Efficient / Operator Cost Structure / SUN is a low-cost operator with / industry leading scale of over 15 / billion gallons per year / SUN’s History of Managing / Expenses While Growing / AEBITDA / $MM / 2019 2020 2021 2022 2023 2024 TTM / 2Q25 / Fuel Distribution Expenses(3) / Fuel Distribution operating expenses / have decreased on average 0.6% / annually (2019 – TTM 2Q25 CAGR) / Fuel Distribution AEBITDA(4) has / grown on average 7.6% annually / (2019 – TTM 2Q25 CAGR) / SUNOCO LP / 15 / (1) National Association of Convenience Store, C-Store Exchange database / (2) EIA, U.S. Product Supplied of Finished Motor Gasoline / (3) Prior to current segment reporting in 2023, expenses were not allocated proportionally by segment / (4) AEBITDA is a non-GAAP number. For a definition, please see slide 2
Visuals: Left: clustered column chart titled by the header 'Industry Facing Escalating Costs(1) and Flat/Lower Fuel Demand(2)', indexed to FY19 on the y-axis (no numeric tick labels printed; values about 100 for every 2019 bar, about 149 for 1H25 Wages, about 142 for 1H25 Credit Card Fees, about 94 for 1H25 Fuel Demand). Categories 2019 and 1H25. Series: Wages navy #262F47, Credit Card Fees red #FA4931, Fuel Demand light grey #B9BCC4; legend below the chart with square markers. A dashed red-outlined callout box at top left of the chart reads 'Wages: +49% / Credit Card Fees: +42% / Fuel Demand: -6%'. Middle: schematic diagram titled 'Illustrative Retail Margin Example' in red. A vertical navy y-axis labelled 'Marginal Breakeven Cost' and a horizontal x-axis labelled 'Operator Cost Structure' with a navy double-headed arrow bar reading 'More Efficient' (left) and 'Less Efficient' (right). Two navy double-line S-shaped curves rise from a SUNOCO logo at the origin, the upper curve ending in an arrowhead at about x 63 y 37 and the lower, flatter curve ending in an arrowhead at about x 63 y 45. A solid navy upward block arrow at about x 50.5 y 40 sits between the curves, with a dashed red-outlined callout to its right reading 'Inflation increases marginal breakeven cost'. The SUNOCO logo is a yellow hexagonal badge with a navy outlined SUNOCO wordmark and red arrow flourishes at its corners. Right: navy column chart titled 'Fuel Distribution Expenses(3)' with y-axis '$MM' ranging 0 to 600 in steps of 100 (gridlines absent), categories 2019, 2020, 2021, 2022, 2023, 2024, TTM 2Q25. No values are printed; estimated values: 2019 about 433, 2020 about 417, 2021 about 388, 2022 about 433, 2023 about 481 (tallest), 2024 about 427, TTM 2Q25 about 416. All bars navy, no legend, no highlighted points. Below the charts are three red bullet points as text, and the footer SUNOCO LP wordmark logo.
Slide 16
Geographic Diversity Creates Stability / with Growth Opportunities
United States
Greater Caribbean
Canada
Largest independent fuel / distributor in the U.S.
Proven income stability with / consistent growth
Opportunity for channel / optimization on newly / acquired Parkland assets
Provides fuel for one in five / fuel locations in Canada
History of higher sustained / margins compared to U.S.
Opportunity for channel / optimization for further / income stability
Largest fuel distributor in the / Greater Caribbean
Composed of several unique / markets with attractive / margins and pockets of high / demand growth(1)
(1) Source: IMF, World Economic Outlook Database, April 2025; GDP growth from 2025 – 2030 includes Grenada (27%), Dominican Republic (40%), Guyana (59%) and Suriname (180%)
16
Visuals: Three map illustrations of fuel distribution sites, all on white or pale grey base maps. Left, United States: a 401 by 310 pixel map of the contiguous US in dark navy #262F47 states with many small bright blue #3A8DFF dots for US Fuel Sites, grey #E0E0E0 Canada and Mexico and grey ocean, with a small inset box at lower left labelled Hawaii showing the islands in navy with blue dots; a legend at lower right reads US Fuel Sites (blue dot) and US Fuel Distribution (navy square); the map is boxed with square corners and no overlay. Centre, Canada: a map of Canada in navy #262F47 with blue dots concentrated along the southern border and in the east, cropped at the top and sides, on white with grey US and Greenland areas, shown as a single image split into three horizontal slices; no legend or labels. Right, Greater Caribbean: a 401 by 310 pixel map of the Caribbean and Central America on white with grey land; navy #262F47 islands (Dominican Republic, Puerto Rico, Cuba, Jamaica area, Guyana, Suriname, French Guiana, Honduras and Belize area) with blue #3A8DFF dots marking fuel sites on smaller islands; an inset box at upper right labelled Bermuda showing navy island with blue dots; a legend at right reads Caribbean Fuel Sites (blue dot) and Caribbean Fuel Distribution (navy square). The Sunoco LP logo at lower left is a bold italic wordmark in navy #262F47 with the letters SUNOCO in heavy caps and LP smaller.
Slide 17
Diverse and Stable Business Segments
Terminals Overview
• Multi-geography, multi-commodity independent terminal system:
• 53 crude and refined product terminals(1) in continental United States
• 18 crude and refined product terminals in Europe(2)
• 13 refined product terminals in the Greater Caribbean
• Nine terminals in Canada
• Six refined product terminals in Hawaii
• Leading transmix processor in the U.S. with four facilities
Key SUN Investment Highlights
• Terminals will remain high-value, critical infrastructure for decades
• Vertical integration maximizes the value of terminals
• SUN strategy targets critical energy infrastructure in key European markets
17
(1) Excludes terminals connected to the Pipeline Systems segment
(2) Includes pending acquisition of TanQuid (expected close in the fourth quarter of 2025)
Visuals: Four grey monoline icons in a vertical column at the left edge, all with white fill and grey outline (#8C8C8C), each about 10 to 12% of slide width: (1) a tank truck with a cylindrical tank and cab, top; (2) two upright cylindrical storage tanks of different diameters, second; (3) a pipeline section with a gate valve on top and two elbow pipe fittings, third; (4) a refinery or petrochemical plant with distillation columns and vessels, bottom. A horizontal gradient wedge (dark navy #262F47 at the left fading to white) runs from the icon column to the grey panel, narrow at the icon side and spanning the full panel height at the panel edge; it is a tapered shape, not a photograph. The Sunoco LP wordmark logo in dark navy italic bold sits bottom-left. No chart or table.
Slide 18
Terminals Will Remain High-Value, / Critical Infrastructure for Decades
Terminal Infrastructure / Remains Essential
Total U.S. Storage Capacity / Has Plateaued(1)
• Capital and regulatory challenges have made new / terminal construction projects infrequent
• As total storage capacity declines, remaining / terminals experience stronger demand
• Well-positioned infrastructure adapts to supply new / fuel types driven by shifts in regulations and / consumer behavior (e.g., low-carbon liquid fuels)
• The importance of waterborne terminals will / increase in major trading hubs (e.g., New York / Harbor, Amsterdam/Rotterdam/Antwerp, and U.S. / West Coast) as refinery closures continue
Millions of Barrels
1,500
1,250
1,000
750
500
2014 2016 2018 2020 2022 2024
18
(1) Source: U.S. Energy Information Administration Monthly Energy Review, Tables 1.8 and 3.7, May 2024. Excludes natural gas liquids
Visuals: Vertical bar chart, untitled apart from the right-column heading 'Total U.S. Storage Capacity Has Plateaued(1)'. Y-axis: 'Millions of Barrels', linear, range 500 to 1,500, ticks at 500, 750, 1,000, 1,250, 1,500. X-axis: years 2014 to 2024, one bar per year (11 bars). One series, solid navy #262F47 bars of equal width with small gaps, no data labels printed, no legend, no gridlines. Bar values are not printed; estimates: 2014 about 1,080; 2015 about 1,130; 2016 about 1,175; 2017 about 1,220; 2018 about 1,250; 2019 about 1,265; 2020 about 1,325; 2021 about 1,390 (highest); 2022 about 1,355; 2023 about 1,345; 2024 about 1,340. No points are highlighted in a different colour. The Sunoco LP logo (navy wordmark with 'LP', italic bold sans-serif) is a raster image at bottom-left.
Slide 19
Vertical Integration Maximizes the / Value of Terminals / Increases Utilization / • SUN’s fuel distribution business increases utilization of owned terminals and provides strong alternative in commercial negotiation with tenants / Improves Efficiency / • Higher throughput volumes and tank utilization decrease fixed cost per volume / 1 / 2 / Unlocks Growth / Optimizes Supply Cost / 4 / 3 / • Terminal portfolio increases optionality for low-cost supply / • Terminals provide foundation for fuel distribution growth, blending opportunities, and expanding geographic presence / 19
Visuals: One diagram: a circular cycle of four thick dark navy (#262F47) block arrows forming a ring centred near the middle of the slide (about x 50, y 50). The arrows run clockwise: the first arrowhead points right at about 12 o’clock, the second points down at about 3 o’clock, the third points left at about 6 o’clock, and the fourth points up at about 9 o’clock. Each arc carries a white circular badge with a navy numeral: 1 at upper left of the ring, 2 at upper right, 3 at lower right and 4 at lower left. The four bullet bodies are not connected to the arrows by lines; they are placed beside the arc quadrants they describe. Also present is the SUNOCO LP logo (wordmark in dark navy italic bold sans-serif with a small red LP) at bottom left.
Slide 20
SUN Strategy Targets Critical Energy
Infrastructure in Key European Markets
Attractive Industry Fundamentals
• Refinery closures drive increased demand for
terminals and storage infrastructure
• Stricter regulations create barriers to building new
capacity
• Renewable fuels require more extensive storage
solutions than traditional oil and refined products
• Geopolitical developments alter traditional supply
sources, increasing the need for flexibility
Highlights from Recent Investments
• Terminals support European government reserve
programs, enabling long-term lease stability
• Terminals in Ireland and Amsterdam are fully leased
• German terminals’ river access will continue to
support long-term petroleum logistics as additional
refineries close
20
Note: Includes pending acquisition of TanQuid (expected close in the fourth quarter of 2025)
Visuals: A map of western and central Europe in flat grey tones, cropped at the left, top and bottom edges and not framed. Ireland (labelled IE), the Netherlands (labelled NL), Germany (labelled DE) and Poland (labelled PL) are darker grey (about #7F7F7F); other countries are light grey (about #E3E3E3) with thin white borders. Red circular markers with white outlines (about #E8231A) sit at about 13 locations: one in western Ireland, one in the Netherlands near Amsterdam, about six in western and southern Germany, one in northern-central Germany and one in eastern Germany, and one in central Poland. The map is built from three stacked image tiles spanning the full map width. No chart, table or photograph is present. The SUNOCO LP logo is shown at bottom-left as a dark navy wordmark in bold italic capitals with a small 'LP' suffix.
Slide 21
Diverse and Stable Business Segments / Pipeline Systems Overview / • ~6,000 miles of refined product pipeline / • ~6,000 miles of crude oil pipeline / • ~2,000 miles of ammonia pipeline / • Joint ventures with Energy Transfer: J.C. Nolan Distillate Pipeline and / Permian Basin Crude Gathering System / • 69 pipeline connected terminals / Key SUN Investment Highlights / • Pipeline systems will remain high-value, critical infrastructure for decades / • Critical energy infrastructure pipeline systems – refined products, crude, / and ammonia / • Joint venture with Energy Transfer is a highly efficient Permian platform / SUNOCO LP / 21
Visuals: Four line icons in a vertical column at the left margin. Icon 1 (top): a grey outline tank truck, a cylindrical tanker on a chassis with three wheels, facing right. Icon 2: grey outline of two upright storage tanks side by side, one larger and one smaller, with vertical banding. Icon 3: navy outline of a pipe assembly with a gate valve and handwheel on a vertical pipe, with two downward-facing flanged pipe ends. Icon 4 (bottom): grey outline of a refinery or processing plant with towers, vessels and pipes. A horizontal gradient wedge, dark navy #262F47 at the left tip fading to light grey #F2F2F2 at the right edge, tapers from the left of the grey panel toward the left margin, with its point at mid-height around 57%. No photographs or charts. Red footer rule and navy and red logo are graphic elements.
Slide 22
Pipeline Systems Will Remain High-Value,
Critical Infrastructure for Decades
Total U.S. Crude and Product Pipeline Miles(1)
250
200
Thousands of Miles
150
100
2004 2005 2006 2007 2008 2009 2010 2011 2012 2013 2014 2015 2016 2017 2018 2019 2020 2021 2022 2023 2024
• Large pipeline projects are becoming more infrequent, increasing the long-term
value of current infrastructure
• Pipelines are and will continue to be the safest and lowest cost transportation
option for liquid products
• Direct integration with terminals increases the value of the assets – SUN’s
pipeline systems are connected to 69 owned/operated terminals
22
(1) Source: U.S. DOT, Pipeline and Hazardous Materials Safety Administration
Visuals: One column chart titled Total U.S. Crude and Product Pipeline Miles with superscript (1), footnoted to U.S. DOT, Pipeline and Hazardous Materials Safety Administration. Y-axis titled Thousands of Miles, labelled 100, 150, 200, 250 (linear, range 100 to 250, gridlines none). X-axis labelled by year 2004 to 2024. Single series, dark navy #262F47 bars of equal width with small gaps. Values are not printed; estimates: 2004 about 167, 2005 about 167, 2006 about 167, 2007 about 170, 2008 about 174, 2009 about 176, 2010 about 182, 2011 about 184, 2012 about 187, 2013 about 193, 2014 about 200, 2015 about 209, 2016 about 212, 2017 about 216, 2018 about 219, 2019 about 226, 2020 about 230, 2021 about 231, 2022 about 230, 2023 about 229, 2024 about 228. No legend, no highlighted points. Also one logo: SUNOCO LP wordmark in dark navy italic bold at bottom left.
Slide 23
Critical Energy Infrastructure Pipeline Systems / ND / MN / SD / IA / NE / KS / Mid-Continent Refined / Products System / Southwest Crude and / Refined Products System / Ammonia System / CO / OK / NM / TX / MO / IL / IN / IA / NE / AR / LA / • Integrated pipeline and terminal / network across six states supports / domestic agricultural and / transportation fuel demand / • Extensive refinery connectivity / throughout the region provides / optionality and reliability for shippers / • Growing suite of blending / opportunities across all systems allow / for incremental value to both / customers and SUN / • Multiple SUN terminals and third- / party connection points in key / markets / • Comprehensive crude and refined / products pipeline systems ensure / ratable, safe, and efficient supply and / delivery throughout the region which / are critical for refinery operation and / consumer demand / • SUN is well-positioned to support / growing markets across the region, / both domestic and export / • Only interstate ammonia pipeline in / the U.S., spanning 2,000 miles from / the Gulf Coast to the Midwest / • Agricultural demand expected to / remain robust and structurally / exclusive / • SUN is uniquely positioned to / transport low carbon and / decarbonized ammonia as the market / continues to develop / SUNOCO LP / 23
Visuals: Three line maps of US states, each drawn in dark grey outlines on a light grey (#F5F5F5) fill with state abbreviations in grey (#7F7F7F) and no photographs. (1) Mid-Continent Refined Products System map: states ND, MN, SD, IA, NE and KS. Yellow (#FFE600) pipeline lines with small circular station markers run north-south through ND, SD, NE and KS, with an east-west line across ND, a branch from ND southeast into MN, a line from NE/IA border area northeast into IA, and a line running south-southwest from the NE/IA border to KS. (2) Southwest Crude and Refined Products System map: states CO, NM, OK and TX. Yellow pipelines run from northern CO southeast through NM and OK toward the TX panhandle, with an east-west yellow line in NM, a yellow line from the TX panhandle southwest to the TX border, a yellow line across central TX to the east coast and a cluster of yellow lines and red terminal dots along the Gulf coast of TX. Red (#E0201B) pipeline segments run through the TX panhandle into OK and along the Gulf coast near Houston. Red square dots mark terminals. (3) Ammonia System map: states NE, IA, IL, IN, MO, AR and LA. A thin orange (#F59B1E) dotted pipeline runs from NE northeast into IA, then south through IA, MO, AR and LA to the Gulf coast, with a branch from the IA/IL area east-northeast to IN. The map is cropped to the states shown with no border around it.
Slide 24
Joint Venture with Energy Transfer is a
Highly Efficient Permian Platform
Permian Basin Crude Gathering System
• Combination of SUN’s and ET’s pipelines creates expansive system in the Midland and Delaware Basins
• Multiple connections to long-haul pipelines provides optionality with customers
• Lowest breakevens among major crude basins support continued production growth
• High-quality customer base provides ratable income streams
• Ten counties in the Permian Basin have accounted for 93% of U.S. oil production growth since 2020(1)
NM
TX
50
45
40
SUN’s Share of AEBITDA (2)($MM)
3Q24 4Q24 1Q25 2Q25
24
(1) Source: EIA Today in Energy, published 9/2/25
(2) Adjusted EBITDA is a non-GAAP measure. For a definition, please see slide 2
Visuals: Chart: vertical bar chart, four bars in navy #262F47 with no value labels printed. Y-axis title 'SUN’s Share of AEBITDA (2)($MM)', scale ticks 40, 45 and 50 with no unit beyond $MM, axis baseline at 40 (bottom) and top of the axis slightly above 50. Categories on the x-axis: 3Q24, 4Q24, 1Q25, 2Q25. Estimated bar heights read from the axis: 3Q24 about 44.2, 4Q24 about 45.3, 1Q25 about 47.4, 2Q25 about 48.6 ($MM). No legend; no highlighted points; bars are equal width with even gaps, the axis lines are dark navy. Map: a schematic network map of pipelines in the Permian Basin, drawn as thin red lines (about #E0201B) with small red node dots on a light grey #F4F4F4 field, showing the NM and TX state areas separated by a thin grey #7F7F7F state border line, with grey state labels NM (upper left) and TX (lower right). The network is densest on the right side around central and eastern Texas and sparser to the west and south; a single long line runs east off the right edge. The map is boxed by a thin black #000000 frame, not cropped and not full-bleed. Logo: Sunoco LP wordmark in bold navy #262F47 italic capitals with a small trademark mark, at lower left.
Slide 25
Diverse and Stable Business Segments / Integrated Refinery and Marketing System / • Burnaby refinery was acquired by Parkland in 2017 from Chevron with / advantaged fuel distribution network in British Columbia / • #1 market share position with Chevron branded stations / • Exclusive licensing rights for the Chevron fuel brand in British / Columbia / • The acquisition included three terminals in British Columbia / • Burnaby refinery has ~55,000 bpd operational capacity / • 90% of refinery output supplies SUN customers / • Price-advantaged crudes – Trans Mountain Pipeline delivers / discounted feedstock to the West Coast / Key SUN Investment Highlights / • Consistently delivers positive cash flow / • On a consolidated basis in 2024, refinery would have accounted for only / ~5% of total SUN AEBITDA(1) / 25 / (1) Adjusted EBITDA is a non-GAAP measure. For a definition, please see slide 2
Visuals: Four line icons in a left column, all drawn in thin outline style: (1) a grey tanker truck with a cylindrical tank body, ladder rungs and two wheels, at the top; (2) grey storage tanks, one large and one small cylinder with vertical banding, in the middle; (3) a grey pipeline valve with a T-shaped handwheel on a pipe run with elbows and two flanges, below that; (4) a navy refinery icon of distillation columns, towers and pipes, at the bottom beside the wedge. A tapered gradient wedge (about 9% of slide width, 83% of height) sits between the icons and the grey panel: it is narrow at the top, widens toward the bottom, and fades from white at top to dark navy #262F47 at bottom-left, overlapping the panel's left edge. Two solid navy horizontal rules, about 0.3% of slide height thick, sit under the two section headings and span the panel's text width. A thin red #FA4931 horizontal rule runs across the footer between the logo and the page number. No photographs.
Slide 26
Consistently Delivers Positive Cash Flow
Burnaby Refinery - Sustained Positive Cash Flow Performance Since 2018
Extended / Shutdown From / Covid
Unplanned / Turnaround in / 1Q24
Segment AEBITDA(1) ($MM)
$400
$300
$200
$100
$0
2018 2019 2020 2021 2022 2023 2024 1H25
• Positive cash flow to be reinvested across SUN’s operations, optimizing growth and value creation
• SUN will enhance operational reliability/reduce downtime and produce more fuel for local markets
(1) Adjusted EBITDA is a non-GAAP measure. For a definition, please see slide 2
26
SUNOCO LP
Visuals: Bar chart, vertical columns, titled by the navy banner above it. Y-axis label: Segment AEBITDA(1) ($MM), with superscript (1) referring to the footnote; scale $0 to $400 with gridline-free tick labels at $0, $100, $200, $300 and $400. X-axis categories: 2018, 2019, 2020, 2021, 2022, 2023, 2024, 1H25. Values are not printed; estimated values: 2018 about $220MM; 2019 about $270MM; 2020 about $85MM; 2021 about $195MM; 2022 about $275MM; 2023 about $235MM; 2024 about $100MM; 1H25 about $115MM. All eight columns are solid navy #262F47 with equal width and gaps, sitting on a thin light grey baseline. No legend. Two highlighted annotations: a dashed red (#FA4931) rectangle reading Extended Shutdown From Covid with a dashed red down arrow pointing to the 2020 column top; and a dashed red rectangle reading Unplanned Turnaround in 1Q24 with a dashed red down arrow pointing to the 2024 column top. Annotation boxes have white fill and sharp corners. Logo: SUNOCO LP wordmark in bold navy italic sans-serif capitals with a small registered mark, at bottom left, not cropped. Red horizontal rule runs between the logo and the page number.
Slide 27
SUNOCO LP / Future Growth Opportunities
Visuals: Full-slide aerial photograph of large cylindrical storage tanks with pipework, seen from above at an oblique angle, with a dark navy translucent tint over the whole image. Across the lower half a large translucent grey-white stylised letterform pattern is overlaid on the photo. The SUNOCO LP wordmark logo sits at top left in navy on a white angled tab. Photo is in four stacked strips of equal height, each 2200 by 425 pixels, spanning the full slide width.
Slide 28
History of Buying at the “Right” Price & Integrating…
✓ AMID / Terminals / ✓ Superior Plus / Terminals / ✓ Six Fuel / Distribution / Bolt-Ons
✓ IPT Terminal
✓ Peerless Oil / and Gas / ✓ Gladieux / Transmix / ✓ Two Fuel / Distribution / Bolt-Ons
✓ NuStar Energy / ✓ Zenith Europe / Terminals / ✓ Pike Fuels / Terminal / ✓ One Fuel / Distribution / Bolt-On
2018 2019 2020 2021 2022 2023 2024 2025
✓ One Fuel / Distribution / Bolt-On
✓ NuStar East / Coast / Terminals / ✓ One Fuel / Distribution / Bolt-On
✓ Zenith North / America / Terminals / ✓ Cato Oil / Terminal / ✓ One Fuel / Distribution / Bolt-On
✓ Parkland / Corporation / ✓ TanQuid / ✓ 10 Fuel / Distribution / Bolt-Ons
35 Midstream and Fuel Distribution Transactions Since 2018
SUNOCO LP
28
Note: Includes pending acquisition of TanQuid (expected close in the fourth quarter of 2025)
Visuals: Timeline diagram. A single horizontal bar of dark navy #262F47 spanning about 6% to 95% of slide width at about 44% to 52% of slide height, made of eight contiguous right-pointing chevron segments, one per year, each about 15.5% wide, with white year labels 2018, 2019, 2020, 2021, 2022, 2023, 2024, 2025 set in the segments. Eight rounded cards filled #CBD1E3 with a thick navy #262F47 outline are connected to the bar by thin navy vertical lines: 2018 card above (AMID Terminals, Superior Plus Terminals, Six Fuel Distribution Bolt-Ons), 2019 card below (One Fuel Distribution Bolt-On), 2020 card above (IPT Terminal), 2021 card below (NuStar East Coast Terminals, One Fuel Distribution Bolt-On), 2022 card above (Peerless Oil and Gas, Gladieux Transmix, Two Fuel Distribution Bolt-Ons), 2023 card below (Zenith North America Terminals, Cato Oil Terminal, One Fuel Distribution Bolt-On), 2024 card above (NuStar Energy, Zenith Europe Terminals, Pike Fuels Terminal, One Fuel Distribution Bolt-On), 2025 card below (Parkland Corporation, TanQuid, 10 Fuel Distribution Bolt-Ons). Each list item is prefixed by a navy check mark. Logo: SUNOCO LP wordmark in bold italic navy #262F47 at bottom-left.
Slides 29 to 34 continue in the full text file.
Download this deck
The hosted PDF of every library deck is free for readers of the SlideDeck Co newsletter. Join with your email and the viewer and download appear here.
Preparing a results presentation or business update of your own? The SlideDeck Co Standard Deck is a slide library for business reviews, updates and plans.







