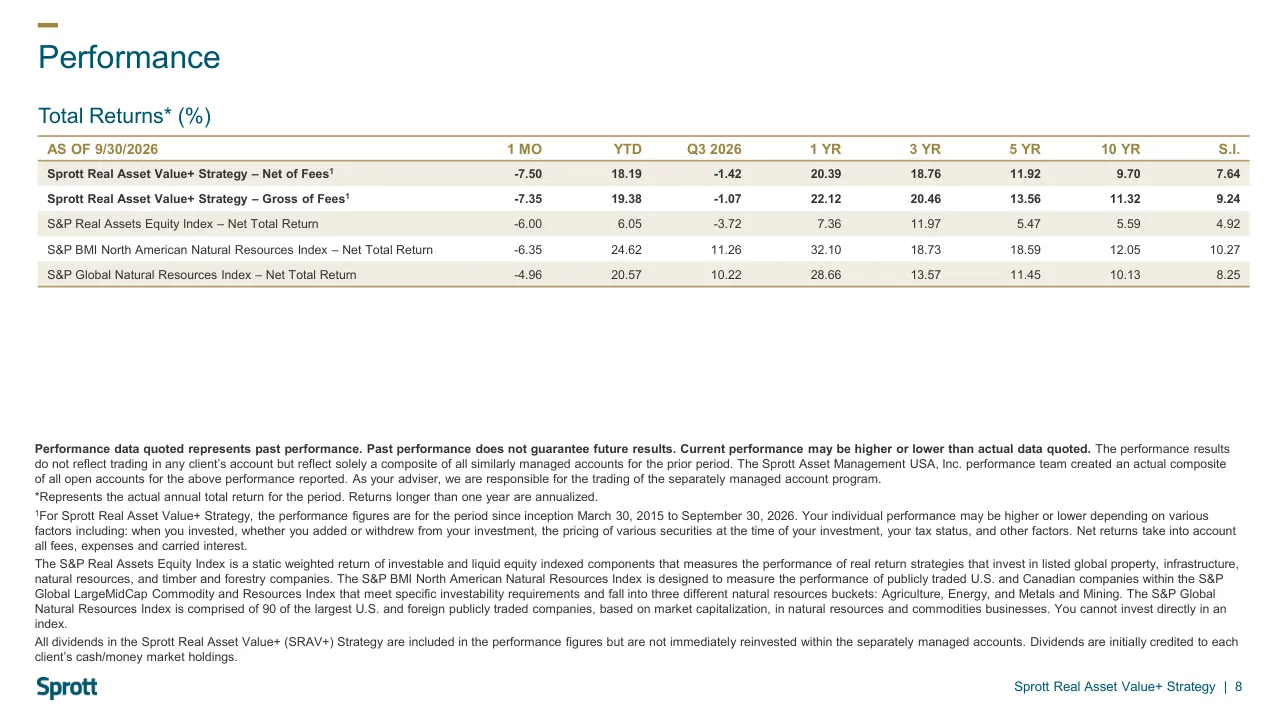
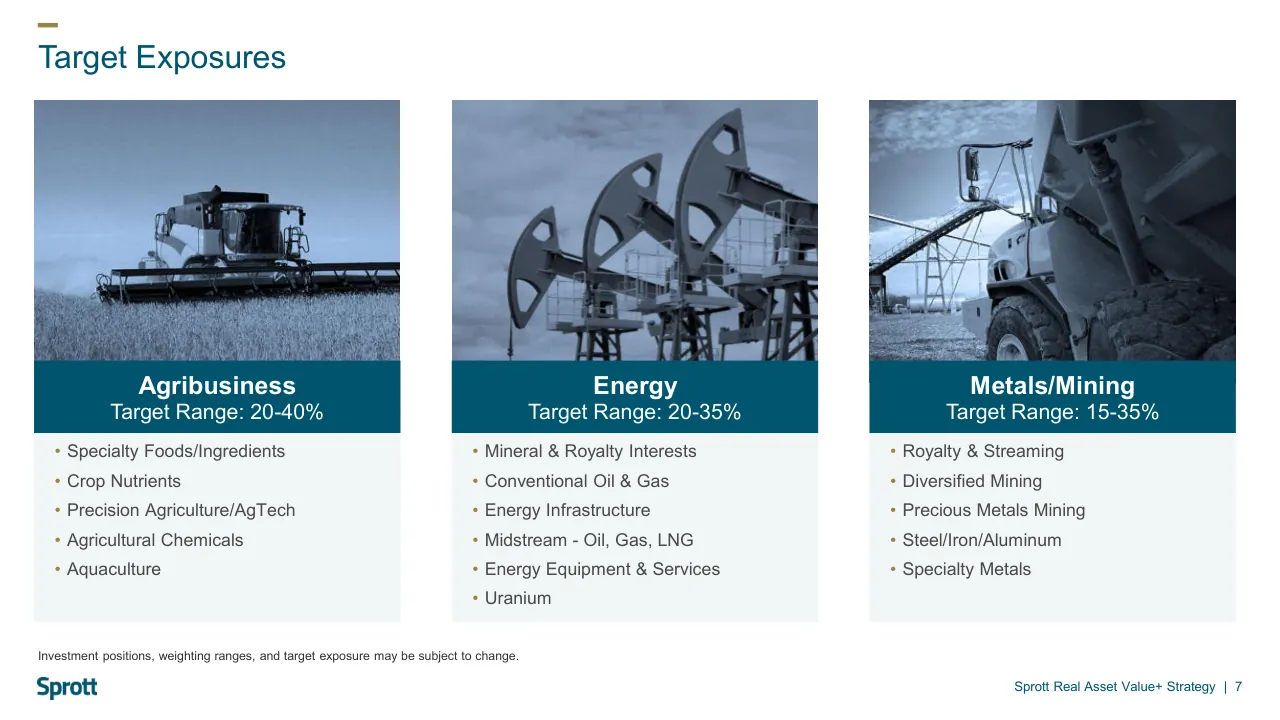
The deck opens with a Benjamin Graham quote on businesslike investing, then introduces portfolio manager Jason J. Stevens, CFA, and his background at the firm. It states the strategy's objective of above-average total returns over a five-year-plus horizon and describes a concentrated real asset portfolio built with top-down sector weightings and bottom-up stock selection. The middle sections cover portfolio construction and target exposures across agribusiness, energy and metals/mining, followed by a performance table comparing net and gross returns with three benchmark indices. Current sector weightings and top ten holdings are shown next, then the selection process, investment assessment criteria, and risk management framework. The closing slides cover the firm's overall assets under management, contact details, and a long disclosure page. Slides worth studying include the performance table on slide 8, which pairs fund and index rows in a single grid, and the sector exposure breakdown on slide 7, which lists sub-sectors under each target range.
Full text of the slides (15 slides)
Every slide's words and a description of its charts and images, so the deck can be searched and rebuilt. Also available as Markdown.
Slide 1
Sprott Real Asset Value+ / Strategy / October 2026 / V2 10/26/2026
Visuals: Photograph of an aerial rural landscape at golden hour: patchwork agricultural fields in green, ochre and brown, with rows of yellow-flowering trees and hedgerows, and a winding grey asphalt road curving from bottom-left up to the right edge. Long shadows fall across the fields from the left. Warm yellow and green dominant colours. The photo is boxed at the left edge, full height above the footer band, not full-bleed across the footer, with a hard vertical edge at x 47.2%. No overlay or tint. Small gold/tan accent bar above the title (a short horizontal line). Sprott logo in teal (wordmark) at bottom-right.
Slide 2
The Graham Principle / “Investing is most intelligent when / it is most businesslike.” / – Benjamin Graham, Columbia University professor, investor and researcher / Sprott / Sprott Real Asset Value+ Strategy | 2
Visuals: One photograph, placed full-bleed on the right: an abstract financial-data illustration. It shows a dotted world map in cyan and light-blue dots across the upper and lower left and right, with a dark navy background. Orange and peach vertical bar-chart columns rise from the lower half, with a thin orange line graph wave running horizontally across the middle. Thin vertical yellow-orange guide lines and red, orange and white hollow rings are scattered over the scene. Depth-of-field blur softens the foreground and background, and the lighting is a glowing neon-like glow on dark. Composition is a vertical crop with the map and bars filling the frame, cropped at all four edges. Dominant colours: cyan #3FC8D8, orange #E8803A, navy #1A2A3A, with white highlights. No overlay or tint is visible, and the photo is not boxed. The Sprott logo (a small dark-teal wordmark) is the only logo, bottom-left.
Slide 3
Portfolio Manager
Jason J. Stevens, CFA, Portfolio Manager
Jason J. Stevens, CFA, acts as Portfolio Manager of the Sprott Real Asset Value+ Strategy and is a member of the Sprott Asset Management USA Investment Committee. Mr. Stevens has been with the firm since 2002. Originally recruited onto Sprott’s trading desk, he has a robust understanding of the domestic and foreign equity, commodity, and currency markets. Alongside his investing and trading experience in the public markets, Mr. Stevens has spent over 20 years advising clients on private equity and debt investments in natural resources-related businesses and partnerships.
Mr. Stevens is a CFA® charterholder and a member of both the CFA Society of San Diego and the CFA Institute. The CFA® designation is globally recognized and attests to a charterholder’s success in a rigorous and comprehensive study program in the field of investment management and research analysis. Additionally, Mr. Stevens holds the Series 7, Series 63, and Series 65 securities licenses. Mr. Stevens has been featured on industry sites such as Reuters, ProActive Investors, and Financial Poise.
Sprott Real Asset Value+ Strategy | 3
Visuals: One headshot photograph of a smiling middle-aged man with short light-brown hair, wearing a dark navy suit, white shirt and a red, white and blue striped tie, shown head and shoulders facing the camera against a plain light grey background. It is framed as a rectangular boxed portrait with a thin grey border, not cropped to a circle and not full-bleed, with even soft frontal lighting. Dominant colours are navy, white, skin tones and grey. One Sprott logo in dark teal in the bottom-left corner.
Slide 4
Value+ Highlights
The Sprott Real Asset Value+ Strategy is a value and quality-oriented Strategy consistent with Sprott’s
contrarian philosophy.
•
Objective: Above-average total returns over a five year+ investment horizon.
•
Actively managed to provide investors diversification and value-add to their overall portfolio.
•
A highly differentiated, concentrated portfolio positioned in natural resource sub-sectors from the top-down with portfolio
companies selected from the bottom-up.
There is no guarantee the Strategy's objectives will be met. "Above-average" refers to the Strategy's performance relative to benchmark performance on the previous slide. While actively managed strategies generally
strive for higher returns, they often incur higher fees and take greater risks than their passively managed counterparts.
Sprott Real Asset Value+ Strategy | 4
Visuals: Two non-text elements. (1) A short horizontal gold accent bar at the top-left above the title, about 1.5% of slide width and 0.5% of slide height, filled olive gold #9C8745, flat with square ends. (2) The Sprott logo wordmark at bottom-left, placed as a 92 by 34 pixel image, showing the word 'Sprott' in a bold teal sans-serif, colour #005670, on a transparent background. No charts, photographs, tables or diagrams.
Slide 5
Top-Down Positioning, Bottom-Up Selection
Dual approach that simultaneously emphasizes risk management and opportunity exploitation.
•Top-down strategic weightings:
o Agribusiness
o Energy
o Metals/Mining
o Real Asset Industries like global real estate, infrastructure and shipping.
•Bottom-up selection of businesses that we believe may offer attractive long-term returns on shareholder capital.
•Combined to offer long-term alternative investment exposure.
There is no guarantee Investment Process objectives will be met.
Sprott Real Asset Value+ Strategy | 5
Visuals: None apart from the small Sprott wordmark logo at bottom left, a raster image 92 by 34 pixels in dark teal. There are no charts, photographs, illustrations or diagrams.
Slide 6
Portfolio Construction / Focused, All-Cap, Real Asset Portfolio* / • / Focused portfolio: Currently 24 positions / • / Bias towards mid-capitalization companies ($5-15 billion) / • / Strategic weighting ranges: / o / Agribusiness: / 20-40% / o / Energy: / 20-35% / o / Metals/Mining: / 15-35% / o / Other Real Asset Investments: / 0-25% / • / Core positions: Demonstrated history of normalized revenue growth, strong operating margins and profitable reinvestment. / • / Investment Weightings and Limitations / o / Position sizes generally 2-7% of portfolio / o / No additional shares will be added to a position that accounts for 8% or more of the total assets / o / No more than 35 investments / *All figures as of September 30, 2026. / Investment positions, weighting ranges, and target exposure may be subject to change. / Sprott Real Asset Value+ Strategy | 6
Visuals: No charts, tables, photographs or illustrations. Non-text visuals: a short solid gold (#9B8542) horizontal rectangle above the title at top left, and the Sprott wordmark logo in dark teal (#005670) at bottom left.
Slide 7
Target Exposures / Agribusiness / Target Range: 20-40% / • Specialty Foods/Ingredients / • Crop Nutrients / • Precision Agriculture/AgTech / • Agricultural Chemicals / • Aquaculture / Energy / Target Range: 20-35% / • Mineral & Royalty Interests / • Conventional Oil & Gas / • Energy Infrastructure / • Midstream - Oil, Gas, LNG / • Energy Equipment & Services / • Uranium / Metals/Mining / Target Range: 15-35% / • Royalty & Streaming / • Diversified Mining / • Precious Metals Mining / • Steel/Iron/Aluminum / • Specialty Metals / Investment positions, weighting ranges, and target exposure may be subject to change. / Sprott / Sprott Real Asset Value+ Strategy | 7
Visuals: Three monochrome blue-toned photographs, one per column, each boxed (not full-bleed) with square corners and no border. Left: a combine harvester with a long header cutting across a wheat field, side view, centred slightly left, pale blue sky above and blurred stubble foreground, cropped at the bottom by the heading bar. Centre: three pumpjacks (nodding donkeys) in a row against a grey cloudy sky, metal lattice structures at the base, cropped at the top and bottom by the heading bar, dark slate tones. Right: a close-up of a large white and grey haul truck, its cab and large black tyre at lower right, a conveyor belt and processing structures in the background on the left, dark blue-grey tones, cropped at the top and bottom. Photos have a blue-grey tint overlay. No charts, tables, icons, or lines besides the small gold dash above the title.
Slide 8
Performance / Total Returns* (%) / AS OF 9/30/2026 / 1 MO / YTD / Q3 2026 / 1 YR / 3 YR / 5 YR / 10 YR / S.I. / Sprott Real Asset Value+ Strategy – Net of Fees 1 / -7.50 / 18.19 / -1.42 / 20.39 / 18.76 / 11.92 / 9.70 / 7.64 / Sprott Real Asset Value+ Strategy – Gross of Fees 1 / -7.35 / 19.38 / -1.07 / 22.12 / 20.46 / 13.56 / 11.32 / 9.24 / S&P Real Assets Equity Index – Net Total Return / -6.00 / 6.05 / -3.72 / 7.36 / 11.97 / 5.47 / 5.59 / 4.92 / S&P BMI North American Natural Resources Index – Net Total Return / -6.35 / 24.62 / 11.26 / 32.10 / 18.73 / 18.59 / 12.05 / 10.27 / S&P Global Natural Resources Index – Net Total Return / -4.96 / 20.57 / 10.22 / 28.66 / 13.57 / 11.45 / 10.13 / 8.25 / Performance data quoted represents past performance. Past performance does not guarantee future results. Current performance may be higher or lower than actual data quoted. The performance results / do not reflect trading in any client’s account but reflect solely a composite of all similarly managed accounts for the prior period. The Sprott Asset Management USA, Inc. performance team created an actual composite / of all open accounts for the above performance reported. As your adviser, we are responsible for the trading of the separately managed account program. / *Represents the actual annual total return for the period. Returns longer than one year are annualized. / 1 For Sprott Real Asset Value+ Strategy, the performance figures are for the period since inception March 30, 2015 to September 30, 2026. Your individual performance may be higher or lower depending on various / factors including: when you invested, whether you added or withdrew from your investment, the pricing of various securities at the time of your investment, your tax status, and other factors. Net returns take into account / all fees, expenses and carried interest. / The S&P Real Assets Equity Index is a static weighted return of investable and liquid equity indexed components that measures the performance of real return strategies that invest in listed global property, infrastructure, / natural resources, and timber and forestry companies. The S&P BMI North American Natural Resources Index is designed to measure the performance of publicly traded U.S. and Canadian companies within the S&P / Global LargeMidCap Commodity and Resources Index that meet specific investability requirements and fall into three different natural resources buckets: Agriculture, Energy, and Metals and Mining. The S&P Global / Natural Resources Index is comprised of 90 of the largest U.S. and foreign publicly traded companies, based on market capitalization, in natural resources and commodities businesses. You cannot invest directly in an / index. / All dividends in the Sprott Real Asset Value+ (SRAV+) Strategy are included in the performance figures but are not immediately reinvested within the separately managed accounts. Dividends are initially credited to each / client’s cash/money market holdings. / Sprott / Sprott Real Asset Value+ Strategy | 8
Visuals: One table: a five-row return table with a header row and eight numeric columns. Columns: label column, 1 MO, YTD, Q3 2026, 1 YR, 3 YR, 5 YR, 10 YR, S.I. Rows: (1) Sprott Real Asset Value+ Strategy – Net of Fees 1: -7.50, 18.19, -1.42, 20.39, 18.76, 11.92, 9.70, 7.64 in bold; (2) Sprott Real Asset Value+ Strategy – Gross of Fees 1: -7.35, 19.38, -1.07, 22.12, 20.46, 13.56, 11.32, 9.24 in bold; (3) S&P Real Assets Equity Index – Net Total Return: -6.00, 6.05, -3.72, 7.36, 11.97, 5.47, 5.59, 4.92; (4) S&P BMI North American Natural Resources Index – Net Total Return: -6.35, 24.62, 11.26, 32.10, 18.73, 18.59, 12.05, 10.27; (5) S&P Global Natural Resources Index – Net Total Return: -4.96, 20.57, 10.22, 28.66, 13.57, 11.45, 10.13, 8.25. Rows 1 to 3 show tinted bands. Units are percent total return. No chart. Logo: Sprott wordmark in dark teal at bottom left.
Slide 9
Current Exposures / Sector Weightings* / Cash / 2.5% / Agribusiness / 23.9% / Other / 21.9% / Energy / 21.6% / Metals/Mining / 30.2% / Top Ten Holdings* / Altius Minerals Corp. / Texas Pacific Land Corp. / Quanta Services Inc. / Franco-Nevada Corp. / Cheniere Energy Inc. / Corteva Inc. / CF Industries Holdings, Inc. / LandBridge Company LLC / Nutrien Ltd. / Cameco Corporation / 0% / 5% / 10% / *By weight, as of September 30, 2026. Strategy holdings are subject to change and should not be considered a recommendation to buy or sell any security. There is no guarantee the holdings were or will be profitable. / Sprott Real Asset Value+ Strategy | 9
Visuals: Two charts. (1) Pie chart titled Sector Weightings* (footnoted by weight as of September 30, 2026). Slices run clockwise from 12 o'clock, starting with Cash: Cash 2.5% (light green #C5E86C, thin sliver just right of 12 o'clock); Other 21.9% (light warm grey #D7D2CB, upper right); Metals/Mining 30.2% (olive-gold #9B8542, lower right, largest slice); Energy 21.6% (muted blue-grey #80A5B4, lower left); Agribusiness 23.9% (green #309B42, upper left). Slices are separated by thin white radial lines, no legend; each slice is labelled outside with its name and percentage in two lines. No highlighted points. The pie is a full circle with no exploded slices. (2) Horizontal bar chart titled Top Ten Holdings* (footnoted by weight as of September 30, 2026). Ten bars in dark teal #005670, sorted largest at top, with category labels right-aligned to the left of each bar. Value axis runs 0% to 10% along the bottom with tick labels 0%, 5%, 10% and a thin grey axis line; there are no printed values on the bars. Estimated bar lengths (about): Altius Minerals Corp. about 9.6%; Texas Pacific Land Corp. about 8.5%; Quanta Services Inc. about 7.9%; Franco-Nevada Corp. about 6.4%; Cheniere Energy Inc. about 5.6%; Corteva Inc. about 5.1%; CF Industries Holdings, Inc. about 4.9%; LandBridge Company LLC about 4.7%; Nutrien Ltd. about 4.5%; Cameco Corporation about 4.3%. Thin grey vertical category axis with short tick marks between bars; no legend, no gridlines. Flat, no shadows, no photographs.
Slide 10
Selection Process
Approach
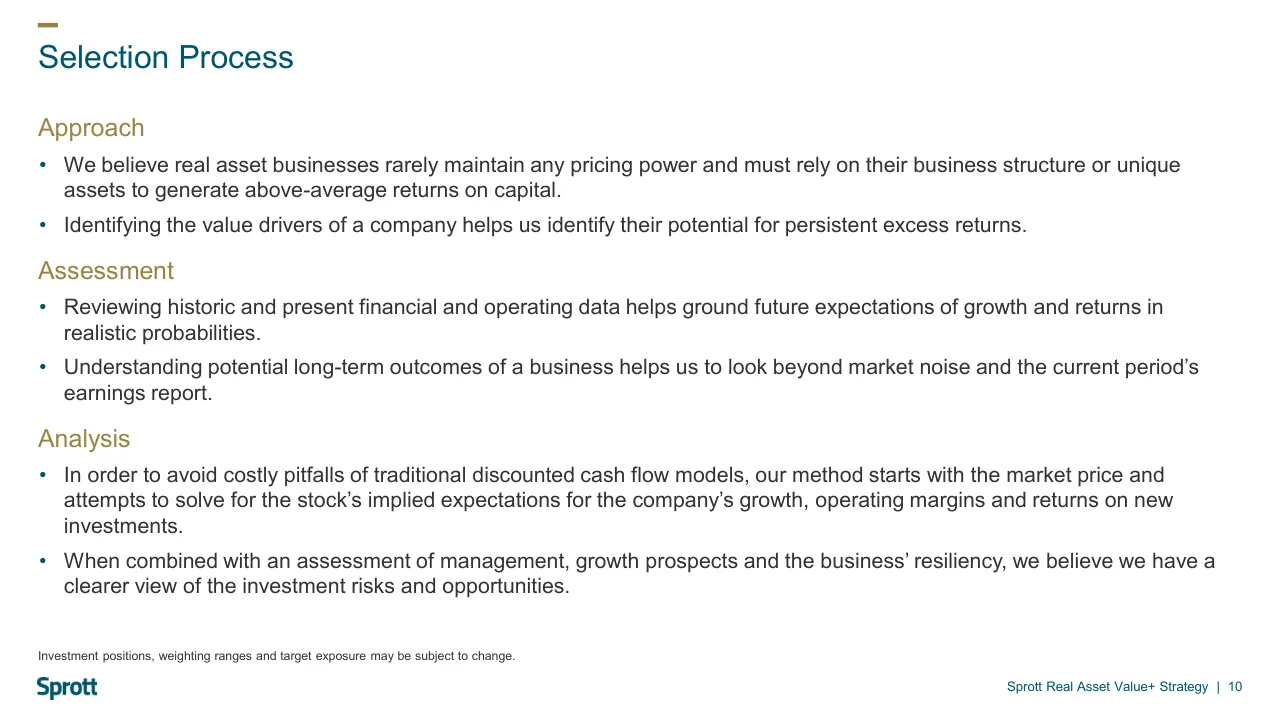
We believe real asset businesses rarely maintain any pricing power and must rely on their business structure or unique assets to generate above-average returns on capital.
Identifying the value drivers of a company helps us identify their potential for persistent excess returns.
Assessment
Reviewing historic and present financial and operating data helps ground future expectations of growth and returns in realistic probabilities.
Understanding potential long-term outcomes of a business helps us to look beyond market noise and the current period’s earnings report.
Analysis
In order to avoid costly pitfalls of traditional discounted cash flow models, our method starts with the market price and attempts to solve for the stock’s implied expectations for the company’s growth, operating margins and returns on new investments.
When combined with an assessment of management, growth prospects and the business’ resiliency, we believe we have a clearer view of the investment risks and opportunities.
Investment positions, weighting ranges and target exposure may be subject to change.
Sprott Real Asset Value+ Strategy | 10
Visuals: none apart from the Sprott logo in the bottom-left corner (wordmark in dark teal) and the short gold dash above the title. No charts, photographs or illustrations.
Slide 11
Investment Assessment / Successful Business Model / Simple, easy-to-understand, transparent. / Growth & margins sufficient for consistent reinvestment. / Strong balance sheets, appropriately-financed. / Distinct differentiators from peers. / Effective Management / Long-term focus. / Capable operators. / Proficient allocators of capital. / Shareholder-oriented; treats shareholders as partners. / History of creating shareholder value. / Attractive Valuation / Manager expectations, scenario probabilities and a margin of safety* are applied to valuation. / The determined valuation and expected return is compared with other options and current market prices. / *Margin of safety is a principle of investing in which an investor only purchases securities when their market price is significantly below their intrinsic value. When the market price of a security is significantly below the / estimation of its intrinsic value, the difference is the margin of safety. / Sprott / Sprott Real Asset Value+ Strategy | 11
Visuals: Three stacked downward-pointing chevron shapes forming a vertical process flow from top to bottom, each filled with a progressively lighter teal: top chevron #005670 (dark teal), middle chevron #407D92 (mid teal), bottom chevron #80A5B4 (light steel blue). Each chevron has a flat top band with a V notch at the bottom centre; the bottom chevron ends in a single point at about y 84.5 percent. Each chevron carries a white bold condensed label in its band: Successful Business Model, Effective Management, Attractive Valuation. No photographs, icons or charts. The Sprott wordmark logo at bottom left is the only logo, in dark teal #005670 bold sans-serif on white, 92 by 34 pixels.
Slide 12
Selection Focus and Risk Management
Selection Focus
• Operating Cash Flows
• Strong operating margins
• Returns on capital employed (RoCE)
Risk Management
Investment Level
Portfolio Level
Manager Level
• Hurdle rates appropriate for investment
risks.
• Balance sheets are appropriately
conservative with respect to the
company’s business.
• Management record of reinvesting cash
flow.
• Strategic weightings in Agribusiness,
Energy, Metals/Mining.
• No leverage, no shorting.
• Average number of holdings: 25-35.
• Position sizes generally 2-7%, no
additions over 8%.
• Investments are only made when we believe
potential returns justify the risks incurred.
• Selling occurs when (1) we are no longer
compensated for risks, (2) structural changes
impede returns on capital, or (3) better
opportunities are presented.
• Ongoing review of risk/return profile of all
holdings.
There is no guarantee the Strategy's objectives will be met. Investment positions, weighting ranges, and target exposure may be subject to change. Risk management processes are designed to identify, monitor, and
mitigate certain risks, but they cannot eliminate all risk or predict future market conditions.
Sprott
Sprott Real Asset Value+ Strategy | 12
Visuals: Three chevron arrow shapes in a horizontal row, pointing right. Left one is a steel-teal chevron (#407D92) at x 3.1%, y 43.6%, w 32.1%, h 10.2%, with a notch cut into its left edge and a point on its right edge, holding the white label Investment Level. Middle one is a pale tan chevron (#CCBF9D) at x 33.7%, y 44.8%, w 32.1%, h 8.5%, slightly shorter than the others, same notch and point shape, holding the white label Portfolio Level. Right one is a muted gold chevron (#B4A16F) at x 65.5%, y 43.6%, w 32.1%, h 10.2%, same shape, holding the white label Manager Level. The chevrons are flat with sharp corners and no shadow, and the right point of the first chevron abuts the notch of the second. A small Sprott wordmark logo in dark teal bottom-left (92 by 34 pixel image, at x 3.0%, y 94.1%, w 4.6%, h 3.1%). No charts, photographs or tables.
Slide 13
A Global Leader in Precious Metals and Critical Materials Investments
Sprott (logo image)
US$55.6B in AUM1
Sprott (SII) is publicly listed on the NYSE and TSX
Exchange Listed Products
Managed Equities
Private Strategies
$47.9 Billion AUM
$5.6 Billion AUM
$2 Billion AUM
Physical Bullion Trusts (NYSE Arca & TSX Listed)
Physical Uranium Trust (TSX Listed)
Physical Copper Trust (NYSE Arca2 & TSX Listed)
Sprott ETFs (Nasdaq or NYSE Arca Listed)
Flagship U.S. Gold Equity Mutual Fund
Closed-End Value Fund (Nasdaq)
Sprott Concentrated M&A Strategy
Sprott Wealth Management Strategies
Bespoke credit investments to mining and resource companies
1 Sprott AUM as of June 30, 2026.
2 Effective May 4, 2026, Sprott Physical Copper Trust began trading on the NYSE Arca under the symbol “SCOP,” in addition to its continued trading on the TSX.
Sprott (logo image)
Sprott Real Asset Value+ Strategy | 13
Visuals: Full-colour Sprott wordmark logo in teal #00556F, centred above the subtitle at x 44.3%, y 14.7%, 10.9% by 7.3% of the slide (272 by 102 pixels), boxed on white with no crop. Three-column table-like grid with a header row (gold #9B8542 for Exchange Listed Products and Managed Equities, teal #00556F for Private Strategies), a light grey subtotal band (#D7D2CB at 25% opacity, rendering about #F3F2F0) showing AUM values, and a body row of bulleted lists with thin light grey vertical dividers at about x 37% and x 69%, spanning about y 40% to 84%. Small Sprott logo at bottom-left, x 3.0%, y 94.1%, 4.6% by 3.1% (92 by 34 pixels). No chart or photograph. Printed values: Exchange Listed Products $47.9 Billion AUM; Managed Equities $5.6 Billion AUM; Private Strategies $2 Billion AUM.
Slide 14
Contact Details
Sprott
Sprott Asset Management USA Inc.
1910 Palomar Point Way, Suite 200
Carlsbad, CA 92008
www.sprott.com
Jason J. Stevens, CFA
Portfolio Manager
Sprott Asset Management USA Inc.
T: 800.477.7853
Email: [email protected]
Follow us on X
@Sprott
Follow us on LinkedIn
https://www.linkedin.com/company/sprott/
Sprott Real Asset Value+ Strategy | 14
Visuals: Three logo images and one headshot photograph. (1) Large Sprott wordmark logo at top-left, bold sans-serif lowercase letters in dark teal #005670, about 10.9% wide by 7.3% tall. (2) Headshot photograph of Jason J. Stevens, a smiling man with short light-brown hair, wearing a navy suit, white shirt and a red and navy striped tie, shown head and shoulders against a plain light grey-white backdrop. It is a tightly cropped portrait, not full-bleed, placed in a rectangular box with a thin grey outline. Lighting is soft and even, and the dominant colours are navy, white, skin tones and light grey. (3) Small Sprott wordmark logo bottom-left in dark teal #005670, about 4.6% wide by 3.1% tall. There are no charts, tables or diagrams.
Slide 15
Important Disclosure
Past performance is not an indication of future results. This presentation is intended solely for the use of Sprott Asset Management USA Inc. for use with investors and interested parties. / Investments, commentary and statements are unique and may not be reflective of investments and commentary in other strategies managed by Sprott Asset Management USA, Inc., Sprott / Asset Management LP, Sprott Inc., or any other Sprott entity or affiliate. Opinions expressed in this presentation are those of the presenter and may vary widely from opinions of other Sprott / affiliated Portfolio Managers or investment professionals.
This information is for information purposes only and is not intended to be an offer or solicitation for the sale of any financial product or service or a recommendation or determination by / Sprott Asset Management USA Inc. that any investment strategy is suitable for a specific investor. Investors should seek financial advice regarding the suitability of any investment strategy / based on the objectives of the investor, financial situation, investment horizon, and their particular needs. This information is not intended to provide financial, tax, legal, accounting or other / professional advice since such advice always requires consideration of individual circumstances. The products discussed herein are not insured by the FDIC or any other governmental / agency, are subject to risks, including a possible loss of the principal amount invested.
Generally, natural resources investments are more volatile on a daily basis and have higher headline risk than other sectors as they tend to be more sensitive to economic data, political and / regulatory events as well as underlying commodity prices. Natural resource investments are influenced by the price of underlying commodities like oil, gas, metals, coal, etc.; several of which / trade on various exchanges and have price fluctuations based on short-term dynamics partly driven by demand/supply and nowadays also by investment flows. Natural resource investments / tend to react more sensitively to global events and economic data than other sectors, whether it is a natural disaster like an earthquake, political upheaval in the Middle East or release of / employment data in the U.S. Low priced securities can be very risky and may result in the loss of part or all of your investment. Because of significant volatility, large dealer spreads and very / limited market liquidity, typically you will not be able to sell a low priced security immediately back to the dealer at the same price it sold the stock to you. In some cases, the stock may fall / quickly in value. Investing in foreign markets may entail greater risks than those normally associated with domestic markets, such as political, currency, economic and market risks. You / should carefully consider whether trading in low priced and international securities is suitable for you in light of your circumstances and financial resources. Past performance is no guarantee / of future returns. Sprott Asset Management USA, entities under common control, family, friends, employees, associates, and others may hold positions in the securities it recommends to / clients, and may sell the same at any time.
The S&P Real Assets Equity Index is a static weighted return of investable and liquid equity indexed components that measures the performance of real return strategies that invest in listed / global property, infrastructure, natural resources, and timber and forestry companies.
The S&P BMI North American Natural Resources Index is designed to measure the performance of publicly traded U.S. and Canadian companies within the S&P Global LargeMidCap / Commodity and Resources Index that meet specific investability requirements and fall into three different natural resources buckets: Agriculture, Energy, and Metals and Mining.
The S&P Global Natural Resources Index is comprised of 90 of the largest U.S. and foreign publicly traded companies, based on market capitalization, in natural resources and commodities / businesses.
© 2026 Sprott Inc. All rights reserved. Sprott Inc. | 500 Fifth Avenue, Suite 3020 | New York, NY 10110 | Telephone: 888.708.0237
Sprott Real Asset Value+ Strategy | 15
Visuals: There are no charts, tables, photographs or illustrations. The only non-text visuals are a short gold horizontal bar above the title, about 1.6% of the slide width and 0.5% of the height, and the Sprott wordmark logo at bottom left in dark teal (#005670), a 92 by 34 pixel image. The gold bar is an unlabelled solid rectangle with no outline or shadow.