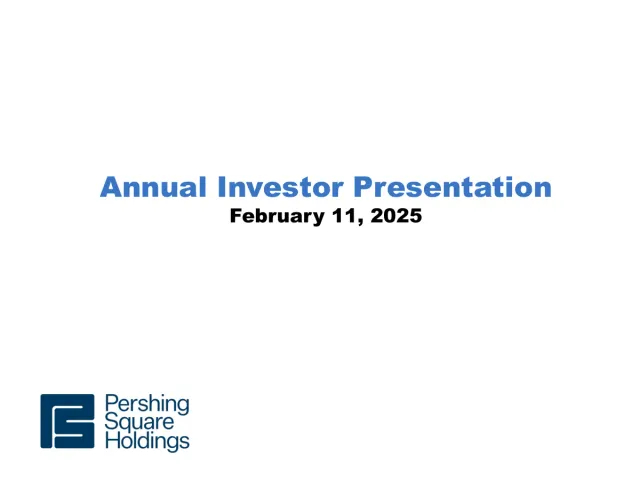
The deck is the annual investor presentation of Pershing Square Holdings, Ltd. (PSH), dated February 11, 2026, and covers its 2025 results. It opens with a title slide and a disclaimer on performance, risk and the limits of forward-looking statements. The agenda then moves through a chairman's introduction, a board overview, a strategic update covering debt financing, the discount to NAV, the PSUS listing and the HHH transaction, followed by a 2025 performance review with annual and cumulative return tables and contributor and detractor breakdowns. Next come a business and organizational update, a market developments section on valuation and earnings growth since COVID, and an equity portfolio update covering holdings such as Brookfield, Uber, Fannie Mae and Freddie Mac, Amazon and Universal Music Group. The deck closes with an organizational update and team profiles. Slides worth studying include the contributor and detractor slides, which use a consistent layout for gross attribution, and the position-by-position slides, which pair a share price chart with dated event markers and a stated average cost.
Slides worth studying
Questions about this deck
How many slides does the Pershing Square Holdings, Ltd. annual investor presentation have?
The deck has 85 pages. Slide 3 lists the agenda, which moves through the chairman's introduction, strategic update, 2025 performance review, business update, market developments, equity portfolio update and Q&A.
What does Pershing Square Holdings, Ltd. say about its long-term debt financing strategy?
Slide 9 states that PSH debt is covered 5.1x by total assets as of 12/31/25, with laddered maturities from 2027 to 2039. It also gives a weighted-average maturity of 6 years and a weighted-average cost of capital of 3.6%.
What were the 2025 returns for Pershing Square Holdings, Ltd.?
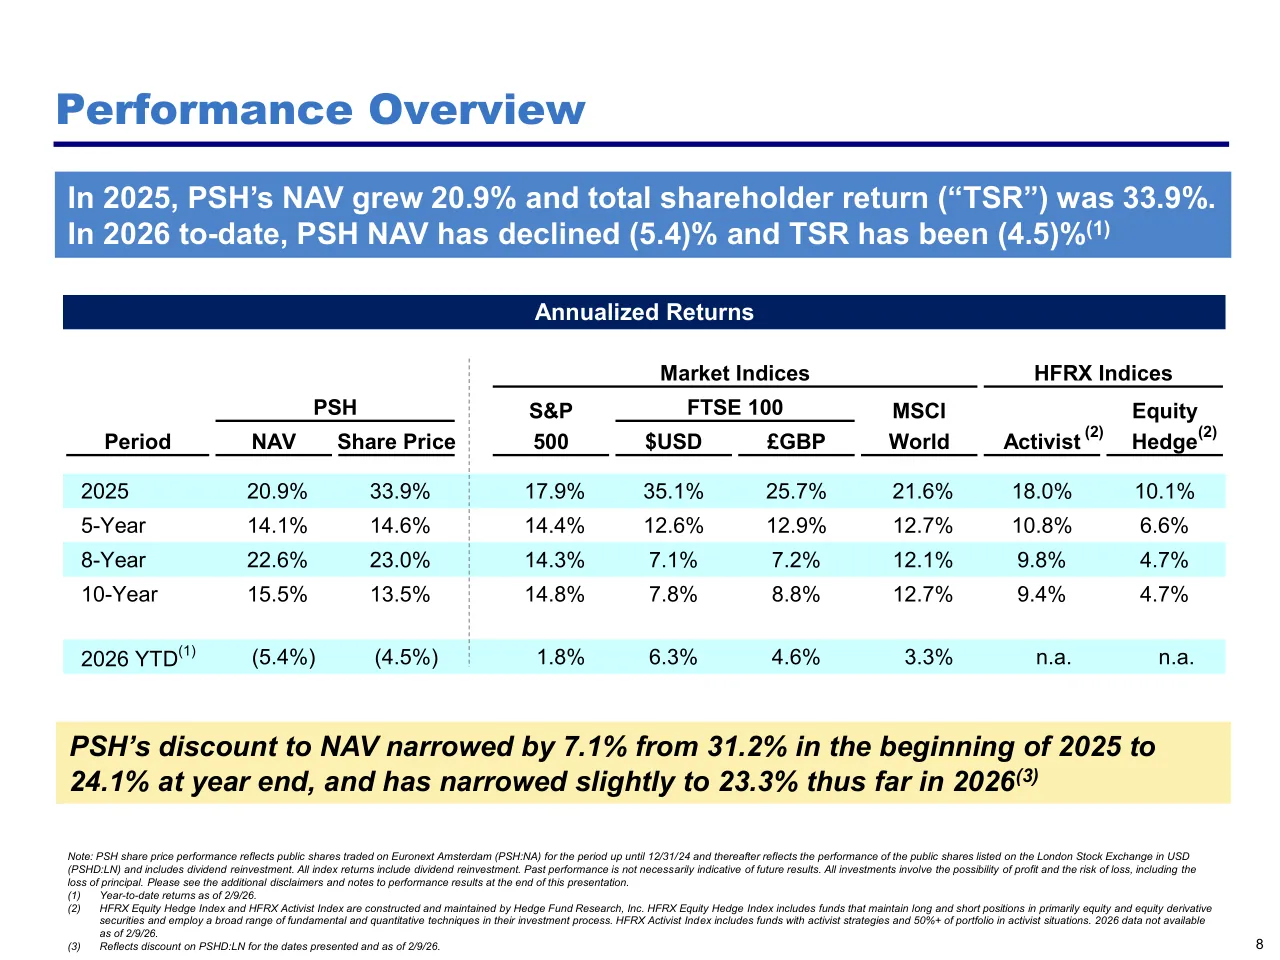
Slide 8 says that in 2025 PSH's NAV grew 20.9% and total shareholder return was 33.9%. Slide 21 shows the same 2025 figures alongside the returns of the S&P 500, FTSE 100, MSCI World and HFRX indices.
What does Pershing Square Holdings, Ltd. say about HHH's acquisition of Vantage Group Holdings?
Slide 16 says that in December 2025 HHH signed a definitive agreement to acquire Vantage Group Holdings, Ltd. for $2.1 billion in cash, including up to a $1 billion investment from PSH. The slide states the acquisition is expected to close in Q2 2026, subject to regulatory approvals.
Details
- Company: Pershing Square Holdings, Ltd.
- Year: 2026
- Type: Fund presentation
- Industry: Investment Management
- Pages: 85
More from Pershing Square
All Pershing Square decks in the library
Review score: 7 out of 10, Effective
Presentation quality, judged with the SlideDeck Co review heuristic. Ask, evidence and idea merit are not rated here.
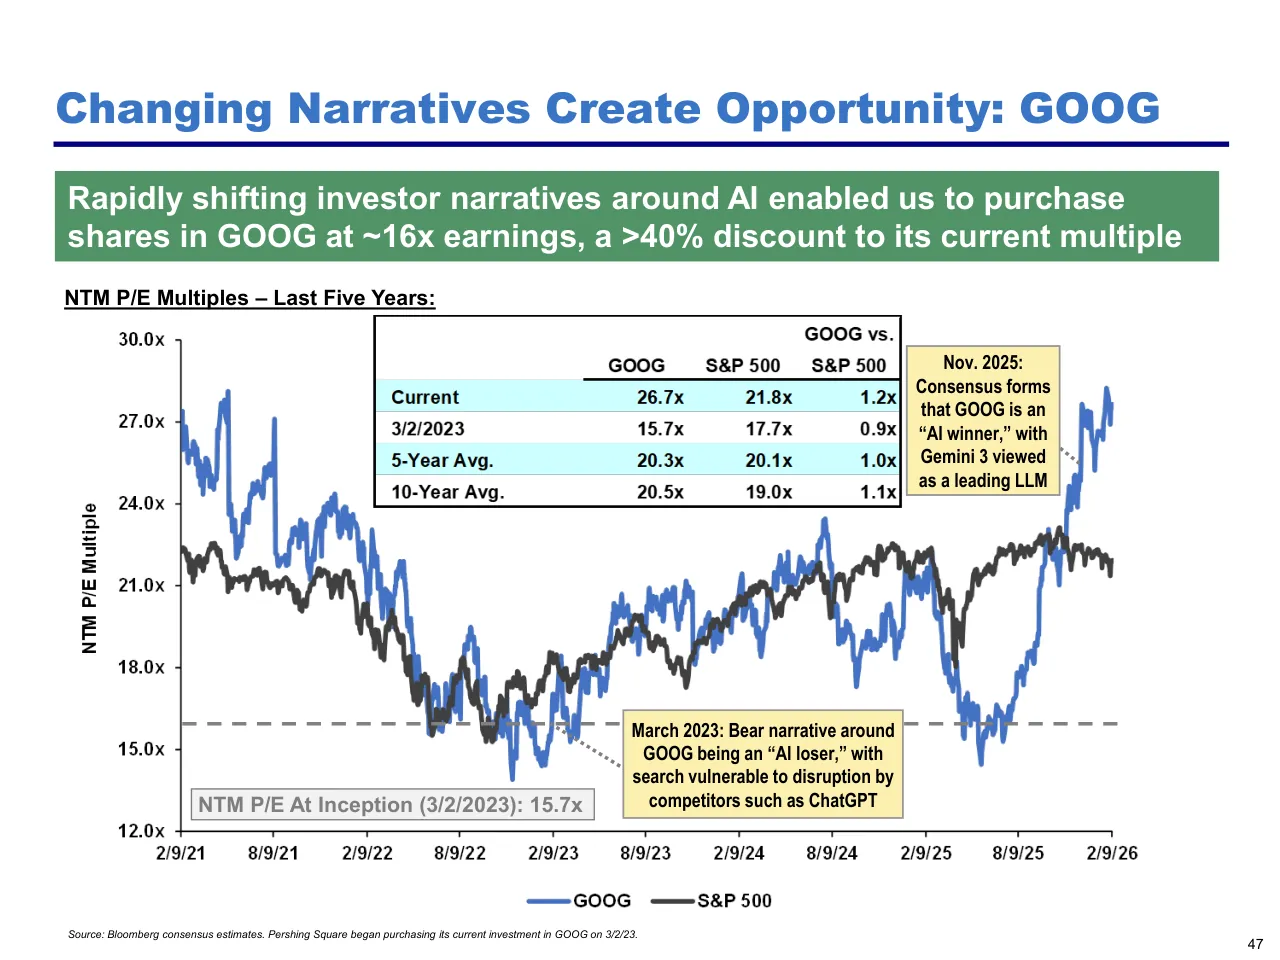
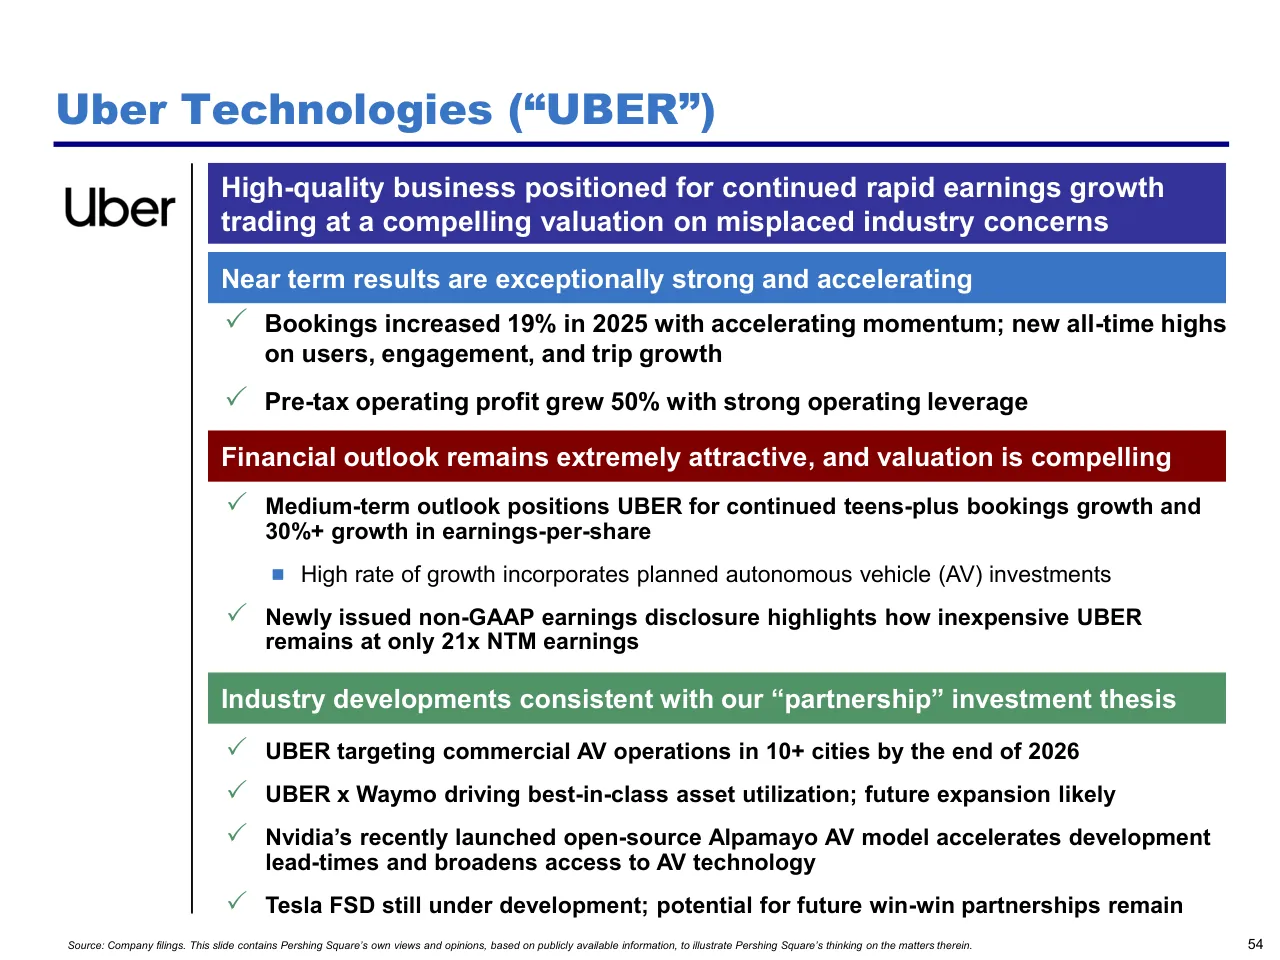
The deck has a clear route: agenda, strategic update, performance, business update, market context, then position-by-position pages, and the recurring layouts (colored claim banner, chart with dated event callouts, average-cost line) make the long run of holdings easy to follow. Many pages state their conclusion in a banner headline and back it with a readable chart or table, such as slides 8, 21, 47 and 54. Weaknesses are consequential: the density and the tiny footnotes, the heavy text-only bullet pages (slides 7, 13, 15, 17), and the overlapping callouts and crowded axes on the share price charts (slides 55, 57, 70) mean this works as a read-ahead document more than a presented deck. Slide 1 is bare, and the 85 pages end with team profiles rather than a close.
Worth keeping: Keep the banner-headline-plus-chart layout with dated event callouts and the dashed average cost line on slides 47, 53 and 59, and the consistent contributor and detractor tables on slides 29 and 30.
Most useful repair: Cut or reduce the text-only strategic update pages (slides 7, 13, 15, 17) to a single visual or a short summary, and thin the callouts on the crowded price charts such as slides 55, 57 and 70.
What would change the score: I would raise the 7 to an 8 if the chart pages were decluttered and the strategic update pages carried visuals, and I would lower it if slides beyond the 72 contact sheet pages are as dense and unstructured.
Confidence medium. 72 of 85 pages inspected on contact sheets, 4 at readable size. Reviewed 2026-11-08. Model-assisted review (claude-sonnet-5-5).
Full text of the slides (85 slides)
Every slide's words and a description of its charts and images, so the deck can be searched and rebuilt. Also available as Markdown.
Slide 1
Annual Investor Presentation
February 11, 2026
Pershing Square Holdings
Visuals: Pershing Square Holdings logo at bottom left: a dark navy rounded square containing a white stylised S-shaped line mark made of two horizontal bars and a vertical stroke, beside the wordmark 'Pershing Square Holdings' stacked on three lines in a light-weight navy sans-serif.
Slide 2
Disclaimer
All information provided herein is for informational purposes only and should not be deemed a recommendation to buy or sell any security mentioned. Pershing Square Capital Management, L.P. (“Pershing Square”) believes this presentation contains a balanced presentation of the performance of the portfolio it manages, including a general summary of certain portfolio holdings that have both over and under performed its expectations.
This presentation contains information and analyses relating to all of the publicly disclosed positions representing over 50 basis points in the portfolio of Pershing Square Holdings, Ltd. (“PSH” or the “Company”) during 2025. Pershing Square may currently or in the future buy, sell, cover or otherwise change the form of its investments discussed in this presentation for any reason. Pershing Square hereby disclaims any duty to provide any updates or changes to the information contained herein including, without limitation, the manner or type of any Pershing Square investment.
Past performance is not necessarily indicative of future results. All investments involve risk including the loss of principal. It should not be assumed that any of the transactions or investments discussed herein were or will prove to be profitable, or that the investment recommendations or decisions we make in the future will be profitable or will equal the investment performance of the investments discussed herein. Specific companies or investments shown in this presentation are meant to demonstrate Pershing Square’s active investment style and the types of industries and instruments in which we invest and are not selected based on past performance.
The analyses and conclusions of Pershing Square contained in this presentation are based on publicly available information. Pershing Square recognizes that there may be confidential or otherwise non-public information in the possession of the companies discussed in the presentation and others that could lead these companies to disagree with Pershing Square’s conclusions. The analyses provided include certain statements, assumptions, estimates and projections prepared with respect to, among other things, the historical and anticipated operating performance of the companies. Such statements, assumptions, estimates, and projections reflect various assumptions by Pershing Square concerning anticipated results that are inherently subject to significant economic, competitive, legal, regulatory, and other uncertainties and contingencies and have been included solely for illustrative purposes. No representations, express or implied, are made as to the accuracy or completeness of such statements, assumptions, estimates or projections or with respect to any other materials herein. Any forward-looking statement contained in this presentation is subject to various risks and uncertainties. See also “Forward-Looking Statements” in Additional Disclaimers and Notes to Performance Results at the end of this presentation. All trademarks included in this presentation are the property of their respective owners.
This document may not be distributed without the express written consent of Pershing Square and does not constitute an offer to sell or the solicitation of an offer to purchase any security or investment product. This presentation is expressly qualified in its entirety by reference to PSH’s prospectus, Annual Report, and Semiannual Financial Statements Including Investment Manager’s Report, which includes discussions of certain specific risk factors, tax considerations, fees and other matters, and its other governing documents.
SEE ADDITIONAL DISCLAIMERS AND NOTES TO PERFORMANCE RESULTS AT THE END OF THIS PRESENTATION FOR ADDITIONAL IMPORTANT INFORMATION
2
Visuals: One horizontal thick navy rule spanning the slide width under the title (about 4.2% to 96% of width, about 14.7% from top, about 0.5% thick). No images, charts or logos.
Slide 3
Agenda
Chairman’s Introduction
Strategic Update
2025 PSH Performance Review
Business & Organizational Update
Market Developments Since COVID
Equity Portfolio Update
Q&A
Visuals: Seven full-width rectangular bars stacked top to bottom, flat fills with no outline, in this colour order: indigo blue, medium sky blue, green, maroon, indigo blue, medium sky blue, green. A thin horizontal navy line sits under the title.
Slide 4
Chairman’s Introduction
Visuals: One filled rectangle, light blue #99CCFF, with no outline, shadow or gradient. It runs from x 10.0% to 92.4% and from y 35.6% to 52.7%. No images, icons or charts.
Slide 5
Board of Directors of PSH
Board Director
Summary Experience
Rupert Morley
Independent Director
Chairman of the Board
Trustee and Chairman of investment advisory group, Comic Relief
Trustee, Kennedy Memorial Trust
Former Chairman of the Board, Bremont Watch Company
Former CEO of Sterling Relocation, Hamptons Estate Agency, and Propertyfinder.co.uk
Former Managing Director, Swan Hellenic Cruises
Former Director of Thistle Hotels, English Welsh & Scottish Railways, and Graham-Field Health Products
Former President, Fédération Internationale des Déménageurs Internationaux (FIDI)
Charlotte Denton
Independent Director
Director and Chair, Achilles Investment Company and Alpha Real Capital
Director and Audit Chair, Starwood European Real Estate Finance
Director, Hitec and Next Energy Investment Manager
Former Director, Cinven and Butterfield Bank (Guernsey) Ltd
KPMG, Northern Trust, Rothschild
Andrew Henton
Independent Director
Director, Bank of NT Butterfield & Son, SW7 Holdings Ltd, and Longview Partners (Guernsey) Ltd
Chairman of the Board, Onward Opportunities Ltd
Former Director of Boussard & Gavaudan Holding Ltd
PwC, HSBC, Close Brothers
Bilge Ogut
Independent Director
Investment Partner at Groupe Bruxelles Lambert
Former Advisory Partner to Partners Group
Former Board Member of Civica, CPA Global, Vermaat, PartnerRe, Forterro, and Unit4
Former Head of Technology and Head of Europe Private Equity, Partners Group
Former Managing Director, Warburg Pincus
Standard Bank, Goldman Sachs
Jean-Baptiste Wautier
Independent Director
Co-Founder of Wautier Family Office
Chairman of GEDEBE and Aspire; Chair of Investment Committee at Sci Ventures
Non-Executive Director of Studio Razavi + Partners; Director of Howard Hughes Holdings, Inc.
Former BC Partners Chairman of the Investment Committee and CIO in the UK
Senior Lecturer at Sciences Po University Paris; Executive Fellow at Adam Smith’s Panmure House
Arthur Anderson, Morgan Stanley, IK Partners
Halit Coussin
Director
Chief Legal Officer and Chief Compliance Officer, the Investment Manager
Director, Pershing Square Holdco GP, LLC
Schulte, Roth & Zabel LLP
Bilge Ogut and Jean-Baptiste Wautier joined the Board of Directors in 2025 while
Bronwyn Curtis and Tope Lawani departed the Board
5
Visuals: Six headshot photographs in the left column, one per row, each about 5-6% wide and 8-9% tall, unframed. 1) Rupert Morley: smiling man with grey swept-back hair, dark suit, plain background. 2) Charlotte Denton: woman with long wavy brown hair, light top, soft light background. 3) Andrew Henton: man with glasses and receding hair, dark suit and tie with pinkish accent, grey background. 4) Bilge Ogut: woman with light brown hair pulled back, dark jacket, neutral background. 5) Jean-Baptiste Wautier: dark-haired bearded man in a grey cardigan, seated in front of a red patterned chair. 6) Halit Coussin: woman with long dark hair, dark jacket, black background. Thin grey horizontal separator lines between rows. Small dash bullets before each experience line. A thick navy horizontal rule under the title.
Slide 6
PSH Board Process
Quarterly meetings; additional meetings as needed
Review and monitor
Investment performance and portfolio
Operational risk management
Investor relations and global marketing
Share price performance
Expenses
Compliance and regulatory matters
Board Committees (membership limited to independent directors / except for risk committee)
Audit Committee
Management Engagement Committee
Nomination Committee
Remuneration Committee
Risk Committee
Additional matters
6
Visuals: A thick dark navy horizontal line under the title spanning almost the full width. Blue right-pointing triangle bullets mark first-level items and small blue filled squares mark second-level items.
Slide 7
PSH Board Additional Matters Considered in 2025
Share buybacks
Dividend policy
Debt strategy
Fee-related amendments to the Investment Management Agreement
Howard Hughes strategic transaction with Pershing Square
Howard Hughes preferred stock investment
Strategies for addressing discount to NAV
7
Visuals: A thick dark navy horizontal rule under the title, from about x 4.2% to x 96%, at y about 15%. Seven blue right-pointing triangle bullet markers (Wingdings 3) at x about 5.6%, one before each list item. No images or charts.
Slide 8
Performance Overview
In 2025, PSH’s NAV grew 20.9% and total shareholder return (“TSR”) was 33.9%. / In 2026 to-date, PSH NAV has declined (5.4)% and TSR has been (4.5)%(1)
Annualized Returns
Market Indices
HFRX Indices
PSH
S&P 500
FTSE 100
MSCI World
Equity Hedge(2)
Period
NAV
Share Price
$USD
£GBP
Activist(2)
2025 20.9% 33.9% 17.9% 35.1% 25.7% 21.6% 18.0% 10.1%
5-Year 14.1% 14.6% 14.4% 12.6% 12.9% 12.7% 10.8% 6.6%
8-Year 22.6% 23.0% 14.3% 7.1% 7.2% 12.1% 9.8% 4.7%
10-Year 15.5% 13.5% 14.8% 7.8% 8.8% 12.7% 9.4% 4.7%
2026 YTD(1) (5.4%) (4.5%) 1.8% 6.3% 4.6% 3.3% n.a. n.a.
PSH’s discount to NAV narrowed by 7.1% from 31.2% in the beginning of 2025 to / 24.1% at year end, and has narrowed slightly to 23.3% thus far in 2026(3)
Note: PSH share price performance reflects public shares traded on Euronext Amsterdam (PSH:NA) for the period up until 12/31/24 and thereafter reflects the performance of the public shares listed on the London Stock Exchange in USD (PSHD:LN) and includes dividend reinvestment. All index returns include dividend reinvestment. Past performance is not necessarily indicative of future results. All investments involve the possibility of profit and the risk of loss, including the loss of principal. Please see the additional disclaimers and notes to performance results at the end of this presentation.
(1) Year-to-date returns as of 2/9/26.
(2) HFRX Equity Hedge Index and HFRX Activist Index are constructed and maintained by Hedge Fund Research, Inc. HFRX Equity Hedge Index includes funds that maintain long and short positions in primarily equity and equity derivative securities and employ a broad range of fundamental and quantitative techniques in their investment process. HFRX Activist Index includes funds with activist strategies and 50%+ of portfolio in activist situations. 2026 data not available as of 2/9/26.
(3) Reflects discount on PSHD:LN for the dates presented and as of 2/9/26.
8
Visuals: A table of annualized returns with grouped headers (PSH; Market Indices incl. S&P 500, FTSE 100 $USD/£GBP, MSCI World; HFRX Indices Activist, Equity Hedge). Black underline rules beneath group and column headers. A vertical grey dashed line separates the PSH columns from the index columns. Rows 2025, 8-Year and 2026 YTD are shaded light cyan; 5-Year and 10-Year are white. No charts or images.
Slide 9
Long-Term Debt Financing Strategy
PSH’s ability to access low-cost, investment-grade, long-term debt is an
important competitive advantage for PSH
PSH has attractive credit characteristics
Simple, transparent, and highly liquid investment portfolio
Significant asset coverage: PSH debt is covered 5.1x by total assets(1)
Underlying portfolio companies are diversified across industries and have relatively
low commodity exposure and cyclical risk
Proven investment strategy with a long-term track record
Facilitates opportunistic issuances
Laddered maturities from 2027 to 2039 are well matched with PSH’s
long-term investment horizon
Weighted-average maturity of 6 years; weighted-average cost of capital of 3.6%
No margin leverage
No mark-to-market covenants
(1) Total Assets is defined as Net Asset Value plus Total Debt as of 12/31/25.
9
Visuals: Thin dark navy horizontal rule under the title (about x 4.2% to 96%, y 14.8%). Solid medium-blue rectangular banner behind the subtitle. Green checkmark bullets (Wingdings ✓) before four bold headings. Small blue square bullets before each of six sub-points. No charts or images.
Slide 10
Total Debt to Total Capital Ratio Over Time
Regardless of market or portfolio volatility, PSH has continuously
maintained conservative leverage levels and investment grade ratings
Total Debt to Total Capital Ratio | 6/30/2015 to 12/31/2025:
24.0%
22.0%
20.0%
18.0%
16.0%
14.0%
12.0%
6/26/15: Issued
$1,000mm of
5.500%, 7-Year
Unsecured Bonds
Due 2022
10/1/21: Issued $700mm of
3.250%, 10-Year Unsecured
Bonds Due 2031 and
€500mm of 1.375%, 6-Year
EUR-Denominated
Unsecured Bonds Due 2027
10/4/21: Redeemed
$369mm of 5.500%
Unsecured Bonds
Due 2022
10/28/25: Issued
$500mm of 5.500%,
7-Year Unsecured
Bonds Due 2032
4/29/25: Issued
€650mm of 4.250%,
5-Year Unsecured
Bonds Due 2030
19.5%(1)
7/25/19: Private
placement of
$400mm of 4.950%,
20-Year Unsecured
Bonds Due 2039
8/26/20: Private placement
of $200mm of 3.000%, 12-
Year Unsecured Bonds
Due 2032
11/2/20: Issued
$500mm of 3.250%,
10-Year Unsecured
Bonds Due 2030
6/15/22: Redeemed
$631mm balance of
5.500% Unsecured
Bonds Due 2022
5/20/25: S&P Global
Ratings Upgraded
PSH to A-
12/18/25: Fitch
Ratings
Upgraded PSH
to BBB+
Jun-15 Dec-15 Jun-16 Dec-16 Jun-17 Dec-17 Jun-18 Dec-18 Jun-19 Dec-19 Jun-20 Dec-20 Jun-21 Dec-21 Jun-22 Dec-22 Jun-23 Dec-23 Jun-24 Dec-24 Jun-25 Dec-25
Total Debt as % of Total Capital
Note: Total Capital and the ratio of Total Debt to Total Capital are calculated in accordance with the PSH Bonds’ Indentures. Total Capital is defined as Net Asset Value plus Total Debt and is net of accrued performance fee.
(1) Assumes a 1.18x EUR/USD exchange rate for the €500mm and €650mm EUR-denominated bonds.
10
Visuals: Line chart of Total Debt as % of Total Capital, monthly, Jun-15 to Dec-25. Y-axis 12.0% to 24.0% in 2.0% steps, with a vertical axis line and tick marks. X-axis labels every six months from Jun-15 to Dec-25, rotated 45 degrees, with tick marks. No gridlines. One dark slate-blue (#44546A) line of about 3 px width. The series starts at about 12.9% in Jun-15, dips to about 12.2%, rises to about 20.5% in mid-2016, and stays between about 17.5% and 20.7% through 2019. It peaks at about 21.1% in mid-2019, falls to about 15.3% in early 2019/20 and about 16.2% in mid-2020, and is about 19.5% in Dec-2020. It peaks at about 23% in Oct-2021 and at about 24% in mid-2022, then declines to about 14.5% in early 2025, jumps to about 19.4%, dips to about 16.9%, and ends at 19.5% (footnote 1) in Dec-25. Legend: short dark slate line with 'Total Debt as % of Total Capital'. Callouts: 9 yellow boxes (#FEF1B0) with thin grey-brown outline for issuances and private placements, 2 blue boxes (#B0C8E8) for redemptions, 2 green boxes (#B6D7C1) with dark green outline for rating upgrades. Dotted grey leader lines (about 3 px) connect each box to its point on the line. No logos.
Slide 11
Strategies to Address the Discount
Strong investment performance
Compound annual NAV net returns of 22.6% for the last eight years (the “Permanent Capital Era”)(1)
Corporate actions
Gained premium listing on the London Stock Exchange in May 2017, when PSH ranked 139th in the FTSE by market capitalization
Initiated quarterly dividend in Q1 2019. Revised dividend policy in Q2 2022 whereby dividends now increase with NAV
Quarterly dividend is now $0.1837 per share, an 84% increase from $0.10 per share in 2019
PSH has repurchased 74 million shares, representing 29.7% of initial shares outstanding, at an average price of $25 and average discount to NAV of 29%(2)
In 2025, PSH repurchased 6.6 million shares at an average price of $56 and average discount to NAV of 29%
PSCM affiliates have accumulated a 28% ownership stake through outright purchases(3)
Global marketing efforts outside of the United States
Inclusion of PSH in the FTSE 100 index in December 2020. Now the 58th largest company by market capitalization(4)
AIC reclassification from Hedge Funds to U.S. Equity
Retained Cadarn Capital for increased UK/European/Asian distribution and LodeRock Advisors for increased Canadian distribution
The board continues to believe that the most powerful driver of long-term shareholder returns will be continued strong absolute and relative NAV performance
Note: Pershing Square began its ‘‘permanent capital era’’ on 1/1/18 by focusing on growing its permanent capital base through generating and compounding long-term returns and renewing its commitment to its core investment principles.
Past performance is not necessarily indicative of future results. All investments involve the possibility of profit and the risk of loss, including the loss of principal. Please see the additional disclaimers and notes to performance results at the end of this presentation.
(1) The 1-year, 5-year, and 10-year compound annual NAV net returns for PSH were 20.9%, 14.1%, and 15.5%, respectively. See slide 8 for further details.
(2) Initial shares outstanding reflect public and management shares outstanding as of 4/30/17. Repurchase data as of 2/9/26.
(3) Ownership percentage based on current shares outstanding. Includes Pershing Square employees and affiliates and charitable entities associated with Pershing Square employees or Pershing Square affiliates.
(4) FTSE 100 companies ranked by market capitalization as of 2/9/26.
11
Visuals: Dark navy horizontal rule under the title spanning almost the full width. Blue right-pointing triangle bullets beside the three headings. Small blue square bullets beside sub-points at two indent levels. Pale yellow rectangle behind the closing statement. No charts or images.
Slide 12
Strategic Update
Visuals: One flat light-blue rectangle (#99CCFF) spanning x 10% to 92.4% and y 35.6% to 52.7%, with no outline, shadow or gradient. No other visuals.
Slide 13
PSUS IPO Update
Made the decision to re-evaluate PSUS’s IPO structure to address investor feedback
Received substantial interest from retail and institutional investors over PSUS’s initial two-month marketing phase in July 2024
However, investor considerations around potential aftermarket trading dynamics prompted us to re-evaluate the transaction structure
Launch of PSUS should result in material reduction of PSH’s performance fees
As part of PSH’s amended Fee Offset Arrangement, PSH’s performance fees will be reduced by 20% of the management fees earned on PSUS
PSH’s net performance fee percentage will be lower in years with lower returns
13
Visuals: A thick dark navy horizontal rule spans from about x 4% to x 96% under the title at y about 15%. Two blue right-pointing triangle bullet markers in front of the first-level bullets. Four small blue filled square bullet markers in front of the second-level bullets.
Slide 14
HHH Strategic Transaction with Pershing Square
In May 2025, Pershing Square invested $900 million of primary capital as
part of a plan to transform HHH into a diversified holding company
The Pershing Square management company (Pershing Square HoldCo, L.P.) purchased 9
million newly issued HHH shares for $100 per share
Along with PSH’s and the private funds’ interest, Pershing Square’s beneficial ownership of HHH
has increased to 47%, with voting power capped at 40%
Investment by Pershing Square enables HHH to begin its transformation into a diversified
holding company seeking controlling stakes in high-quality, durable growth companies
HHH signed a definitive agreement to acquire Vantage Group Holdings, Ltd. in December 2025
Existing HHC real estate subsidiary will continue its core MPC business with no change in strategy
Bill Ackman rejoined HHH’s Board as Executive Chairman and Ryan Israel joined the
Board and HHH’s executive team as Chief Investment Officer
The entire Pershing Square team will support HHH in its transformation in exchange for
management fees
14
Visuals: A thick navy horizontal rule under the title spanning the content width. A solid blue rectangular banner holds the headline statement. First-level bullets are small blue right-pointing triangles; second-level bullets are small blue squares.
Slide 15
Benefits to PSH from HHH Strategic Transaction
Reduction in PSH management fees
PSH management fees will be reduced dollar for dollar by the proportionate share of fees
paid to PSCM by HHH attributable to the HHH common stock held by PSH(1)
Improved HHH should enhance the value of PSH’s stake in the company
Leverages Pershing Square’s leadership and investment expertise
Asymmetric hedging strategy can mitigate HHH’s exposure to macroeconomic risks
Differentiated ability to source and execute private transactions
Improved access to equity and debt capital markets
Transaction should widen investor interest in HHH driven by expanded investment strategy
and Pershing Square’s broad retail and institutional following
PSH and HHH will pursue distinct yet synergistic investment mandates
Note: This slide contains Pershing Square’s current views and expectations and is provided for illustrative purposes only. This slide does not constitute a guarantee or promise with respect to any outcome and there can be no assurance that
these expectations will be achieved.
(1) PSH currently owns 16.5 million shares of HHH.
15
Visuals: A thick dark navy horizontal rule under the title spanning about 4% to 96% of the width. Three green check mark glyphs (Wingdings ✓) beside the bold headings. Small blue square bullets (Wingdings 2) beside each of the seven sub-bullets.
Slide 16
HHH’s Acquisition of Vantage
In December 2025, HHH signed a definitive agreement to acquire Vantage
Group Holdings, Ltd., a leading specialty insurance and reinsurance company
Purchase
Price
$2.1 billion in cash, including up to a $1 billion investment from PSH
HHH to retain Vantage’s book value accretion from signing to close (“locked box”)
Purchase price represents 1.5x estimated year-end 2025 book value and is
expected to represent a ~1.4x P / BV multiple at close
Timing
Expected to close in Q2 2026, subject to regulatory approvals
Funding
Sources
$1.2 billion in HHH balance sheet cash
Up to a $1 billion backstop minority investment from PSH
Investment will take the form of non-interest-bearing preferred stock issued by HHH(1)
PSH’s preferred stock will be exchangeable for the common stock of Vantage if not
redeemed by HHH by the end of the seventh fiscal year post-transaction
Based on the highly cash-generative nature of HHH’s real estate assets, we expect that
HHH will redeem PSH’s preferred stock and increase its economic ownership of Vantage
to 100% within three years
(1) The preferred stock will bear a mandatory dividend in the event of a default on HHH’s obligation to repurchase the stock in certain circumstances.
16
Visuals: Solid dark navy label boxes with white bold text. Blue right-pointing triangle bullets for main points and small blue square bullets for sub-points. Two thin dashed grey horizontal divider lines. A thick dark navy horizontal rule under the title. A blue banner rectangle. No charts or photos.
Slide 17
Vantage Acquisition Strategic Rationale
We believe the acquisition of Vantage is an ideal transaction to begin
HHH’s transformation into a diversified holding company
Well-diversified insurance platform across lines of business with both specialty
insurance and reinsurance exposure
Highly experienced management team
Limited risk to existing reserves (Vantage was launched in 2020)
In-place regulatory licenses and credit ratings (A.M. Best and S&P A- Rating)
Leverages Pershing Square’s investment expertise
Addition of a higher-return, faster-growth insurance subsidiary materially
accelerates HHH’s overall growth profile and diversifies its earnings stream
Provides additional opportunities for reinvesting HHH’s real estate subsidiary's
excess cash, which will initially be used to redeem PSH’s preferred stock
17
Visuals: A thick navy horizontal rule under the title, spanning about 4.6% to 96% of the width. A solid medium-blue rectangular banner holds the statement. Seven thin green check mark glyphs (Wingdings 2), one beside each bullet, aligned at the left of each bullet's first line.
Slide 18
PSH Preferred Investment Terms
PSH / Investment
Investment from PSH will take the form of non-interest-bearing preferred / stock issued by HHH(1)
Up to $1 billion, split into fourteen equally-sized tranches
PSH’s preferred stock will be exchangeable for the common stock of Vantage / if not redeemed by HHH by the end of the seventh fiscal year post-closing
Repurchase / Call Option
At the end of each fiscal year, for the first seven years post-transaction, HHH / will have the right to repurchase one or more tranches of the preferred stock
Repurchase price will be cash equal to 1.50x the then book value of Vantage / multiplied by the preferred tranche(s)’ ownership percentage(2)
Governance / Terms
PSH’s preferred stock will generally be pari passu with HHH common stock; no / liquidation preference
Subject to a mandatory repurchase by HHH in the event of, among others, a / change of control of HHH or Vantage
Preferred investment approved by independent directors of both PSH and HHH
Over time, we expect HHH to fully exercise its call options on all tranches of PSH’s preferred / stock and increase its economic ownership of Vantage to 100%
(1) The preferred stock will bear a mandatory dividend in the event of a default on HHH’s obligation to repurchase the stock in certain circumstances.
(2) On an as exchanged basis. Subject to a minimum repurchase price equal to the original issue price plus 4% per annum through the date of repurchase.
18
Visuals: Three solid navy rectangles as row labels with white centered bold text. Eight blue right-pointing triangle bullet markers, one per bullet. Thick navy horizontal rule under the title. Two thin dashed grey horizontal separator lines between rows. Pale yellow rectangle behind the closing callout text. No photos or charts.
Slide 19
PSH Preferred Investment Highlights
We believe PSH’s preferred investment is highly compelling both on its
own merits and in the significant value creation it will catalyze for HHH
Highly attractive return profile on a stand-alone basis
Contractual exit liquidity mechanism at a pre-determined multiple(1)
Economically similar to an investment in the PSH portfolio
Prospective returns on PSH’s preferred investment should reflect growth in Vantage’s book value
plus the benefit of P / BV multiple expansion from entry to exit
Growth in Vantage’s book value should closely track overall PSH portfolio returns (subject to
insurance regulatory requirements)
Vantage transaction materially enhances the value of HHH, a core holding of PSH
Vantage transaction will accelerate HHH’s transformation into a diversified holding company,
enhancing its growth and return profile
PSH’s existing investment in HHH common stock is ~40% larger than its maximum preferred
commitment
(1) Subject to a minimum repurchase price equal to the original issue price plus 4% per annum through the date of repurchase.
19
Visuals: Navy horizontal rule under the title spanning almost the full width. Solid blue rectangular banner behind the statement. Four green check-mark glyphs (Wingdings 2) at the left of the main points. Four small blue square bullets beside the sub-points.
Slide 20
2025 Performance Review
Visuals: One flat light blue rectangle (#99CCFF) with no outline, shadow or gradient, spanning x 17.6% to 91.9% and y 35.4% to 52.5%. No other visual elements.
Slide 21
2025 Performance Overview
2025 Return: PSH NAV Net of Fees & Total Return vs. Indices Total Return
33.9%
35.1%
21.6%
20.9%
17.9%
18.0%
10.1%
PSH NAV
PSH Share Price
S&P 500
FTSE 100(1)
MSCI World
HFRX Activist Index(2)
HFRX Equity Hedge Index(2)
Note: Reflects returns from 12/31/24 through 12/31/25, including dividend reinvestment for indices. Past performance is not necessarily indicative of future results. All investments involve the possibility of profit and the risk of loss, including the loss of principal. Please see the additional disclaimers and notes to performance results at the end of this presentation.
(1) FTSE 100 index reflects USD-denominated returns for consistency with other indices.
(2) HFRX Equity Hedge Index and HFRX Activist Index are constructed and maintained by Hedge Fund Research, Inc. HFRX Equity Hedge Index includes funds that maintain long and short positions in primarily equity and equity derivative securities and employ a broad range of fundamental and quantitative techniques in their investment process. HFRX Activist Index includes funds with activist strategies and 50%+ of portfolio in activist situations.
21
Visuals: Vertical bar chart with no y-axis, gridlines or legend. A black horizontal baseline runs from about x 6.4% to 94.8% at y about 76.4%. Seven bars with percentage labels in bold black above each: PSH NAV 20.9% (blue), PSH Share Price 33.9% (blue), S&P 500 17.9% (green), FTSE 100 35.1% (green), MSCI World 21.6% (green), HFRX Activist Index 18.0% (green), HFRX Equity Hedge Index 10.1% (green). A grey dashed vertical line at about x 31.8% runs from y about 31% to 85% and separates the PSH bars from the index bars. Category labels in bold black sit below the baseline, with superscript (1) after FTSE 100 and (2) after the two HFRX index labels. The yellow banner has a thin grey outline. A thick navy rule sits under the title.
Slide 22
Cumulative Net Returns Since Inception
PSLP / PSH
Net Return
2,503%
S&P 500
854%
PSH Annual Investor Presentation
January 19, 2018
2,750%
2,500%
2,250%
2,000%
1,750%
1,500%
1,250%
1,000%
750%
500%
250%
0%
(250%)
'04 '05 '06 '07 '08 '09 '10 '11 '12 '13 '14 '15 '16 '17 '18 '19 '20 '21 '22 '23 '24 '25 '26
2018: Return to Our Roots
Created a strong path forward that reminds us of our early roots
✓ Restructured to a smaller investment-centric organization
■ Growth from returns, not asset gathering
■ More efficient and impactful team strengthens the firm culture
✓ Reinforced our core investment principles
■ Learned from our mistakes and carved our investment principles in stone
■ New investments aligned with core principles
✓ Exited problematic investments
✓ Stabilized our capital base
Since PSH Inception
(12/31/12 – 2/9/26)
PSH: 391%
S&P 500: 518%
First 11.5 Years Since Firm Inception
(Jan 2004 – Jul 2015)
Challenging Period
(Aug 2015 – Dec 2017)
Permanent Capital Era
(Jan 2018 – Present)
Note: All market and return data as of 2/9/26. Represents returns an investor would have earned if such investor had invested in PSLP at its 1/1/04 inception (which was subject to a 20% performance allocation) and converted to PSH at its launch on 12/31/12 (which was subject to a 16% performance fee subject to certain reductions). Past performance is not necessarily indicative of future results. All investments involve the possibility of profit and the risk of loss, including the loss of principal. Please see the additional disclaimers and notes to performance results at the end of this presentation.
22
Visuals: Line chart of cumulative net returns, monthly points from '04 to '26 on the x-axis (labelled yearly) and a y-axis from (250%) to 2,750% in 250% steps with tick marks. Series 1, a thick navy line (PSLP / PSH net return), rises slowly from 0% in '04 to about 750% in early '15, drops to about 390% in '16, stays about 400-450% through '17, falls to about 390% at '18 start, then climbs to about 2,700% in mid-'25 and ends at about 2,503% in '26. It has a dip to about 1,250% in '22. Series 2, a thick gray line (S&P 500), rises gradually from 0% to about 220% in '18, then about 854% at the end, with a dip to about 370% in '22. A vertical gray dashed line sits at '18, and a gray arrow points from the text box to this line. Three curly brackets under the x-axis group '04 to mid-'15, '15 to '17 and '18 to '26, each with a center tick pointing down to its label. The white text box has a thin black border, a blue title with a dark blue underline, a dark red banner with white bold text, green check marks and small blue square bullets. The stats box has a navy thin border. Series labels are in colour at the right of the lines. No logos.
Slide 23
Commitment to Core Principles
Pershing Square’s Core Investment Principles
Key Business Characteristics
Simple, predictable, free-cash-flow-generative business
Formidable barriers to entry
Limited exposure to extrinsic factors that we cannot control
Generally, strong financial profile
Minimal capital markets dependency
Typically, North American-listed, large-capitalization companies
Attractive Valuation
Fair price “as is”, but a substantial discount to optimized value
Base case valuation not reliant on future M&A or platform value
Exceptional Management and Governance
In-place or identified management with high degree of integrity, track record of success, and appropriate incentives
Typically, no controlling shareholder
Occasional Mispriced Probabilistic Investments
Must offer highly asymmetric return to compensate for possibility of permanent loss of capital
Expected to represent a small percentage of fund capital in the aggregate and an appropriate “return on invested brain damage”
Pershing Square
Simple, predictable, free-cash-flow-generative business
Formidable barriers to entry
Limited exposure to extrinsic factors that we cannot control
Strong financial profile
Attractive valuation
Minimal capital markets dependency
Large market capitalization
Exceptional management & governance
Note: The above is intended to be illustrative. While PSCM generally seeks investments with some or all the above characteristics, there is no guarantee that PSCM will be able to identify investments or create a portfolio that reflects these characteristics.
23
Visuals: Left: a grey speckled, torn-edge paper-textured panel (about 42% wide) with a thin dark blue underline below the panel heading and small blue right-pointing triangle bullets. Below it is a solid blue banner with the white Pershing Square logo (a white square-S monogram plus the white two-line wordmark 'Pershing Square'). Right: eight light grey tiles in 2 columns x 4 rows, each with a dark navy (#0B3A66) flat icon: stack of dollar bills with a $ sign; brick wall; circular arrows around a gear; document with a money bag with $; balance scale; line chart with rising arrow on axes; two office buildings; group of three business people.
Slide 24
Permanent Capital Era Annualized Returns
8 Year Compound Annual Return: PSH NAV Net of Fees & Total Return
vs. Indices Total Return
22.6%
23.0%
14.3%
12.1%
9.8%
7.1%
4.7%
PSH NAV
PSH Share Price
S&P 500
FTSE 100(1)
MSCI World
HFRX Activist Index(2)
HFRX Equity Hedge Index(2)
PSH NAV Annual Outperformance:
830 bps
1,550 bps
1,050 bps
1,280 bps
1,790 bps
Note: Reflects returns from 12/31/17 through 12/31/25, including dividend reinvestment for indices. Pershing Square began its ‘‘permanent capital era’’ on 1/1/18 by focusing on growing its permanent capital base through generating and compounding long-term returns and renewing its commitment to its core investment principles. Please refer to page 22 for more information on Pershing Square’s permanent capital era. Please refer to page 8 for PSH’s one, five, and ten-year annualized returns. Past performance is not necessarily indicative of future results. All investments involve the possibility of profit and the risk of loss, including the loss of principal. Please see the additional disclaimers and notes to performance results at the end of this presentation.
(1) FTSE 100 index reflects USD-denominated returns for consistency with other indices.
(2) HFRX Equity Hedge Index and HFRX Activist Index are constructed and maintained by Hedge Fund Research, Inc. HFRX Equity Hedge Index includes funds that maintain long and short positions in primarily equity and equity derivative securities and employ a broad range of fundamental and quantitative techniques in their investment process. HFRX Activist Index includes funds with activist strategies and 50%+ of portfolio in activist situations.
24
Visuals: Vertical bar chart with no axis scale and no gridlines, a single black baseline. Seven bars with value labels above each in bold black. Two blue bars on the left, PSH NAV 22.6% and PSH Share Price 23.0%, then a vertical grey dashed separator line, then five green bars: S&P 500 14.3%, FTSE 100(1) 7.1%, MSCI World 12.1%, HFRX Activist Index(2) 9.8%, HFRX Equity Hedge Index(2) 4.7%. Category labels in bold black below the baseline. Below the chart a row with thin black rules above and below: 'PSH NAV Annual Outperformance:' in bold italic at left and bps values in bold italic under the five index columns: 830 bps (S&P 500), 1,550 bps (FTSE 100), 1,050 bps (MSCI World), 1,280 bps (HFRX Activist), 1,790 bps (HFRX Equity Hedge). A tiny white '1' sits in the banner area.
Slide 25
PSLP / PSH Annual Net Returns
Annual Net Returns
Year
PSLP / PSH
S&P 500
2004 42.6% 10.9%
2005 39.9% 4.9%
2006 22.5% 15.8%
2007 22.0% 5.6%
2008 (13.0%) (37.0%)
2009 40.6% 26.4%
2010 29.7% 15.1%
2011 (1.1%) 2.1%
2012 13.3% 16.0%
2013 9.6% 32.4%
2014 40.4% 13.7%
2015 (20.5%) 1.4%
2016 (13.5%) 12.0%
2017 (4.0%) 21.8%
2018 (0.7%) (4.4%)
2019 58.1% 31.5%
2020 70.2% 18.4%
2021 26.9% 28.7%
2022 (8.8%) (18.1%)
2023 26.7% 26.3%
2024 10.2% 25.0%
2025 20.9% 17.9%
2026 YTD (5.4%) 1.8%
Compound Annual Return
Since Firm Inception (1/1/04 - 2/9/26)(1) 15.9% 10.7%
Since PSH Inception (12/31/12 - 2/9/26) 12.9% 14.9%
PSLP
1.5% Management fee,
20% Incentive fee,
Unlevered
PSH
1.5% Management fee,
16% Incentive fee,
Modestly levered
Note: All market and return data as of 2/9/26. Past performance is not necessarily indicative of future results. All investments involve the possibility of profit and the risk of loss, including the loss of principal. Please see the additional disclaimers,
index descriptions and notes to performance results at the end of this presentation.
(1) Represents NAV net returns an investor would have earned if she/he invested in PSLP at its 1/1/04 inception (which was subject to a 20% performance allocation) and converted to PSH at its launch on 12/31/12 (which was subject to a
16% performance fee subject to certain reductions).
25
Visuals: Table with columns Year, PSLP / PSH and S&P 500 under the spanning header 'Annual Net Returns' (underlined with a thin black line). Rows run from 2004 to 2026 YTD. Alternate rows are shaded light cyan, starting with 2004. A thick dashed black vertical line separates the PSLP / PSH column from the S&P 500 column. A thin black line sits under the column headers. Values: 2004 42.6% / 10.9%; 2005 39.9% / 4.9%; 2006 22.5% / 15.8%; 2007 22.0% / 5.6%; 2008 (13.0%) / (37.0%); 2009 40.6% / 26.4%; 2010 29.7% / 15.1%; 2011 (1.1%) / 2.1%; 2012 13.3% / 16.0%; 2013 9.6% / 32.4%; 2014 40.4% / 13.7%; 2015 (20.5%) / 1.4%; 2016 (13.5%) / 12.0%; 2017 (4.0%) / 21.8%; 2018 (0.7%) / (4.4%); 2019 58.1% / 31.5%; 2020 70.2% / 18.4%; 2021 26.9% / 28.7%; 2022 (8.8%) / (18.1%); 2023 26.7% / 26.3%; 2024 10.2% / 25.0%; 2025 20.9% / 17.9%; 2026 YTD (5.4%) / 1.8%. A pale yellow (#FFFF99) summary box with a thick black border holds the Compound Annual Return rows. Two black curly right-pointing brackets: one spans 2004-2012 (PSLP), the other spans 2013-2026 YTD (PSH).
Slide 26
PSLP / PSH Cumulative Net Returns
Net Returns vs. S&P 500
through December 31, 2025
PSH
PSLP / PSH
2,644%
836%
507%
418%
410%
323%
298%
192%
93%
96%
21%
18%
1-Year
5-Year
8-Year
10-Year
Since PSH Inception (12/31/2012)
Since Firm Inception (1/1/2004)
PSLP / PSH
S&P 500
Note: PSLP/PSH data represents returns an investor would have earned if such investor had invested in PSLP at its 1/1/04 inception (which was subject to a 20% performance allocation) and converted to PSH at its launch on 12/31/12 (which was subject to a 16% performance fee subject to certain reductions). Past performance is not necessarily indicative of future results. All investments involve the possibility of profit and the risk of loss, including the loss of principal. Please see the additional disclaimers and notes to performance results at the end of this presentation.
26
Visuals: Clustered column chart with no axis title and no y-axis shown, only a light grey baseline. Six categories, each with a blue PSLP / PSH bar and a green S&P 500 bar, and a bold black value label above each bar. Values: 1-Year 21% vs 18%; 5-Year 93% vs 96%; 8-Year 410% vs 192%; 10-Year 323% vs 298%; Since PSH Inception (12/31/2012) 418% vs 507%; Since Firm Inception (1/1/2004) 2,644% vs 836%. The Since Firm Inception bars are by far the tallest, with the blue bar reaching about 2,644% at the top of the plot. A vertical grey dashed line separates the first five categories from the last one. The legend sits in a white rounded rectangle with a thick navy border and has a blue square marker for PSLP / PSH and a green square marker for S&P 500. A yellow rectangle with a thin grey border holds the heading. Two light-blue rectangles with thin navy borders hold the PSH and PSLP / PSH headers.
Slide 27
PSLP / PSH Average Monthly Net Return vs. S&P 500
PSLP / PSH Average Monthly Net Return vs. S&P 500
through December 31, 2025
Average Monthly / Return
Average Return in / Up Months
Average Return in / Down Months
4.0%
3.0%
2.0%
1.0%
0.0%
(1.0%)
(2.0%)
(3.0%)
(4.0%)
1.4%
0.9%
3.0%
3.1%
(2.0%)
(3.8%)
PSLP / PSH
S&P 500
Note: Data starting from PSLP inception on 1/1/04. Past performance is not necessarily indicative of future results. All investments involve the possibility of profit and the risk of loss, including the loss of principal. Please see the additional / disclaimers and notes to performance results at the end of this presentation.
27
Visuals: Clustered column chart with three categories and two series, on a vertical axis from (4.0%) to 4.0% in 1.0% steps, with a zero line crossing the plot. Category headings sit above the plot: 'Average Monthly Return', 'Average Return in Up Months', 'Average Return in Down Months'. Series 1, PSLP / PSH, is dark navy (#003962); series 2, S&P 500, is light grey (#BFBFBF). Values: Average Monthly Return PSLP/PSH 1.4%, S&P 500 0.9%. Up Months PSLP/PSH 3.0%, S&P 500 3.1%. Down Months PSLP/PSH (2.0%), S&P 500 (3.8%). Data labels are in bold black, above positive bars and below negative bars. Legend at the bottom centre with a small navy square beside 'PSLP / PSH' and a grey square beside 'S&P 500'. A red dashed rectangle (about 3 pt stroke) encloses the Down Months cluster, its heading and the legend's right edge. A thick navy horizontal rule sits under the slide title. No gridlines. The axis has a black line with tick marks.
Slide 28
PSH Average Monthly Net Return vs. S&P 500
PSH Average Monthly Net Return vs. S&P 500
through December 31, 2025
Average Monthly Return
Average Return in Up Months
Average Return in Down Months
4.0%
3.0%
2.0%
1.0%
0.0%
(1.0%)
(2.0%)
(3.0%)
(4.0%)
1.2%
1.2%
2.9%
3.3%
(2.8%)
(3.6%)
PSH
S&P 500
Note: Data starting from PSH inception on 12/31/12. Past performance is not necessarily indicative of future results. All investments involve the possibility of profit and the risk of loss, including the loss of principal. Please see the additional disclaimers and notes to performance results at the end of this presentation.
28
Visuals: Clustered column chart with three category groups, no gridlines, and category headers above the plot: 'Average Monthly Return', 'Average Return in Up Months', 'Average Return in Down Months'. The y-axis runs from (4.0%) to 4.0% in 1.0% steps, with a vertical axis line on the left and tick marks, and a horizontal zero axis line with tick marks between groups. Two series, PSH (dark navy #003962) and S&P 500 (light grey #BFBFBF), each with a value label above or below its bar. Average Monthly Return: PSH 1.2%, S&P 500 1.2%. Average Return in Up Months: PSH 2.9%, S&P 500 3.3%. Average Return in Down Months: PSH (2.8%), S&P 500 (3.6%), with bars extending below zero. The legend sits below the plot with a navy square for PSH and a grey square for S&P 500. A thick red (#C00000) dashed rectangle encloses the Down Months group, from the header down to below the legend level. A thick navy horizontal rule sits under the slide title. The title banner is a pale yellow rectangle with a thin grey border.
Slide 29
2025 Contributors
Contributors
Gross
Alphabet
10.3%
Federal National Mortgage Association
5.8%
Federal Home Loan Mortgage Corporation
5.0%
Brookfield
3.5%
Uber Technologies
2.7%
Amazon
2.4%
Hilton Worldwide Holdings
1.0%
Universal Music Group
0.7%
Meta Platforms
0.7%
Restaurant Brands International
0.5%
Accretion from Share Buybacks
1.2%
All Other Positions & Other Income / Expense
0.6%
Total Contributors
34.4%
Total PSH Returns
Gross Return
26.5%
Net Return
20.9%
Note: Positions with contributions to performance of 50 basis points or more are listed above separately, while positions with contributions to performance of less than 50 basis points are aggregated.
Past performance is not a guarantee of future results. All investments involve risk, including the loss of principal. Please see the additional disclaimers and notes to performance results at the end of this presentation.
29
Visuals: Table with columns Contributors and Gross. Rows: Alphabet 10.3%; Federal National Mortgage Association 5.8%; Federal Home Loan Mortgage Corporation 5.0%; Brookfield 3.5%; Uber Technologies 2.7%; Amazon 2.4%; Hilton Worldwide Holdings 1.0%; Universal Music Group 0.7%; Meta Platforms 0.7%; Restaurant Brands International 0.5%; Accretion from Share Buybacks 1.2%; All Other Positions & Other Income / Expense 0.6%. Total Contributors 34.4% in a yellow row with a thick black border. Grey box with thick black border: Total PSH Returns (underlined heading), Gross Return 26.5%, Net Return 20.9%. A thick navy horizontal rule sits under the title.
Slide 30
2025 Detractors
Detractors
Gross
Chipotle Mexican Grill
(4.6%)
Nike
(2.5%)
Total Detractors - Underlying Portfolio
(7.1%)
Bond Interest Expense
(0.8%)
Total Detractors - incl. Interest Expense
(7.9%)
Total PSH Returns
Gross Return
26.5%
Net Return
20.9%
Note: Positions with contributions to performance of 50 basis points or more are listed above separately, while positions with contributions to performance of less than 50 basis points are aggregated.
Past performance is not a guarantee of future results. All investments involve risk, including the loss of principal. Please see the additional disclaimers and notes to performance results at the end of this presentation.
30
Visuals: Table of filled bands. Header row navy with white text 'Detractors' and 'Gross'. Row 'Chipotle Mexican Grill' (4.6%) on light cyan band. Row 'Nike' (2.5%) on white. Row 'Total Detractors - Underlying Portfolio' (7.1%) on light yellow band with thick black top and bottom borders and black side borders. Row 'Bond Interest Expense' (0.8%) on light cyan band. Row 'Total Detractors - incl. Interest Expense' (7.9%) on light yellow with thick black border. Grey box with thick black border containing 'Total PSH Returns' (underlined), 'Gross Return' 26.5% and 'Net Return' 20.9%. Dark navy horizontal rule under the title.
Slide 31
Total Assets Under Management
AUM(1)
Insider Capital (2)
As of 2/9/2026 ($ in millions)
Total
Equity
Total
% of Equity
Pershing Square Holdings ("PSH")
$17,872
$14,202
$3,987
28.1%
Pershing Square, L.P. ("PSLP")
1,484
1,484
718
48.4%
Pershing Square International ("PSINTL")
392
392
158
40.5%
Total Core Funds
$19,748
$16,077
$4,863
30.2%
Howard Hughes Holdings ("HHH")(3)
10,293
5,005
683
13.6%
Total Core Funds & HHH
$30,040
$21,083
$5,546
26.3%
Note: Assets under management are gross of any accrued performance fees. Past performance is not necessarily indicative of future results. All investments involve the possibility of profit and the risk of loss, including the loss of principal.
Please see the additional disclaimers and notes to performance results at the end of this presentation.
(1) Total AUM includes $2.3 billion and €1.15 billion (translated to USD at the prevailing exchange rate) of PSH bond proceeds. Equity AUM excludes these amounts.
(2) Includes Pershing Square employees and affiliates and charitable entities associated with Pershing Square employees or Pershing Square affiliates.
(3) Total AUM for HHH refers to the market capitalization of HHH plus its net mortgages, notes, and loans payable as disclosed in its most recent publicly available filing. Equity AUM for HHH refers to the market capitalization of HHH.
31
Visuals: A table with a navy (#002060) header band containing two column groups: 'AUM(1)' (sub-columns Total, Equity) and 'Insider Capital (2)' (sub-columns Total, % of Equity), each header with a white underline beneath it. A grey dashed vertical line separates the AUM columns from the Insider Capital columns, running from the header to the bottom of the table. Rows: Pershing Square Holdings ("PSH") $17,872 / $14,202 / $3,987 / 28.1% on light cyan; Pershing Square, L.P. ("PSLP") 1,484 / 1,484 / 718 / 48.4% on white; Pershing Square International ("PSINTL") 392 / 392 / 158 / 40.5% on light cyan; Total Core Funds $19,748 / $16,077 / $4,863 / 30.2% on light yellow with a thick black border; Howard Hughes Holdings ("HHH")(3) 10,293 / 5,005 / 683 / 13.6% on light cyan; Total Core Funds & HHH $30,040 / $21,083 / $5,546 / 26.3% on light yellow with a thick black border. Insider Capital values are in bold italic.
Slide 32
Business & Organizational Update
Visuals: One flat light-blue rectangle (#99CCFF) with no outline, shadow or gradient, spanning about x 17.6% to 91.9% and y 35.4% to 52.5%. No images, icons or logos.
Slide 33
Key Developments in the Last Twelve Months
Strong portfolio gains and progress on strategic initiatives drove a PSH
total shareholder return of 34% in 2025, 1.9x the return of the S&P 500(1)
New investments in Hertz, Amazon, and Meta
Exited investments in Chipotle, CPKC, and Nike in 2025, as well as Hilton
in 2026
Began transformation of HHH into a diversified holding company via a
$900mm strategic transaction with PSCM
HHH signed a definitive agreement to acquire Vantage for $2.1bn, which will
be partially funded by up to $1bn of preferred stock issued by HHH to PSH
Continued focus on redesigning the PSUS transaction structure
(1) PSH return represents the USD-based total shareholder return of PSHD with dividends reinvested.
33
Visuals: A thick navy horizontal rule under the title (about #000080). A solid green rectangular banner (#509467) with no rounded corners holding white bold text. Five green check-mark glyphs (Wingdings ✓, #509467), one at the left of each bullet.
Slide 34
Portfolio Developments
During the last twelve months, we completed the acquisitions of three new / investments and exited four investments
Positions Acquired in Last Twelve Months
Late 2024 Initiation
2025 Initiation
Positions Exited in Last Twelve Months
Position
Year Initiated
Year Exited
2025 Attribution(1)
2016
2025
(4.6)%
2021
2025
0.1 %
2018
2026
1.0 %
2024
2025
(2.5)%
(1) Total PSH gross and net returns in 2025 were 26.5% and 20.9%, respectively.
34
Visuals: Logos: Hertz (black italic wordmark with yellow underline) under 'Late 2024 Initiation'; Amazon (black wordmark with orange smile arrow) and Meta (blue infinity logo with dark 'Meta' wordmark) under '2025 Initiation'. Table of four exited positions with logos in the first column: Chipotle (round dark red badge with 'CHIPOTLE MEXICAN GRILL' text and a chili pepper emblem), CPKC (red bold wordmark), Hilton (white serif 'Hilton' in black box with white inner border), Nike (black swoosh). Table header cells are grey #7F7F7F with white bold text; rows 2 and 4 are shaded light blue #D7E3F3, rows 1 and 3 are white. A dark blue horizontal rule sits under the title.
Slides 35 to 85 continue in the full text file.
Download this deck
The hosted PDF of every library deck is free for readers of the SlideDeck Co newsletter. Join with your email and the viewer and download appear here.
Raising or reporting on a fund of your own? The SlideDeck Co Private Equity Deck is a slide library for fund presentations, with a worked fund case.