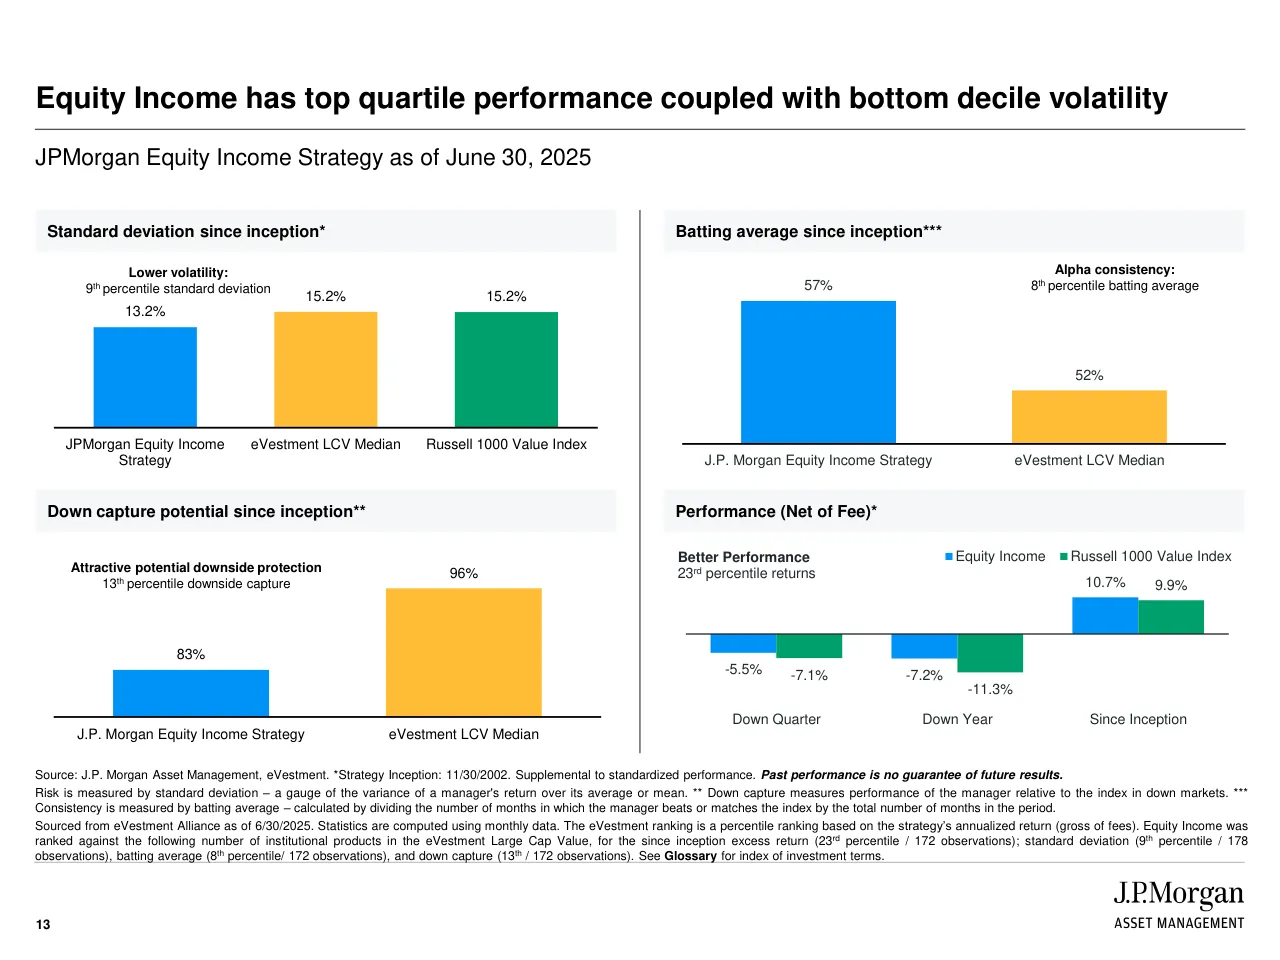
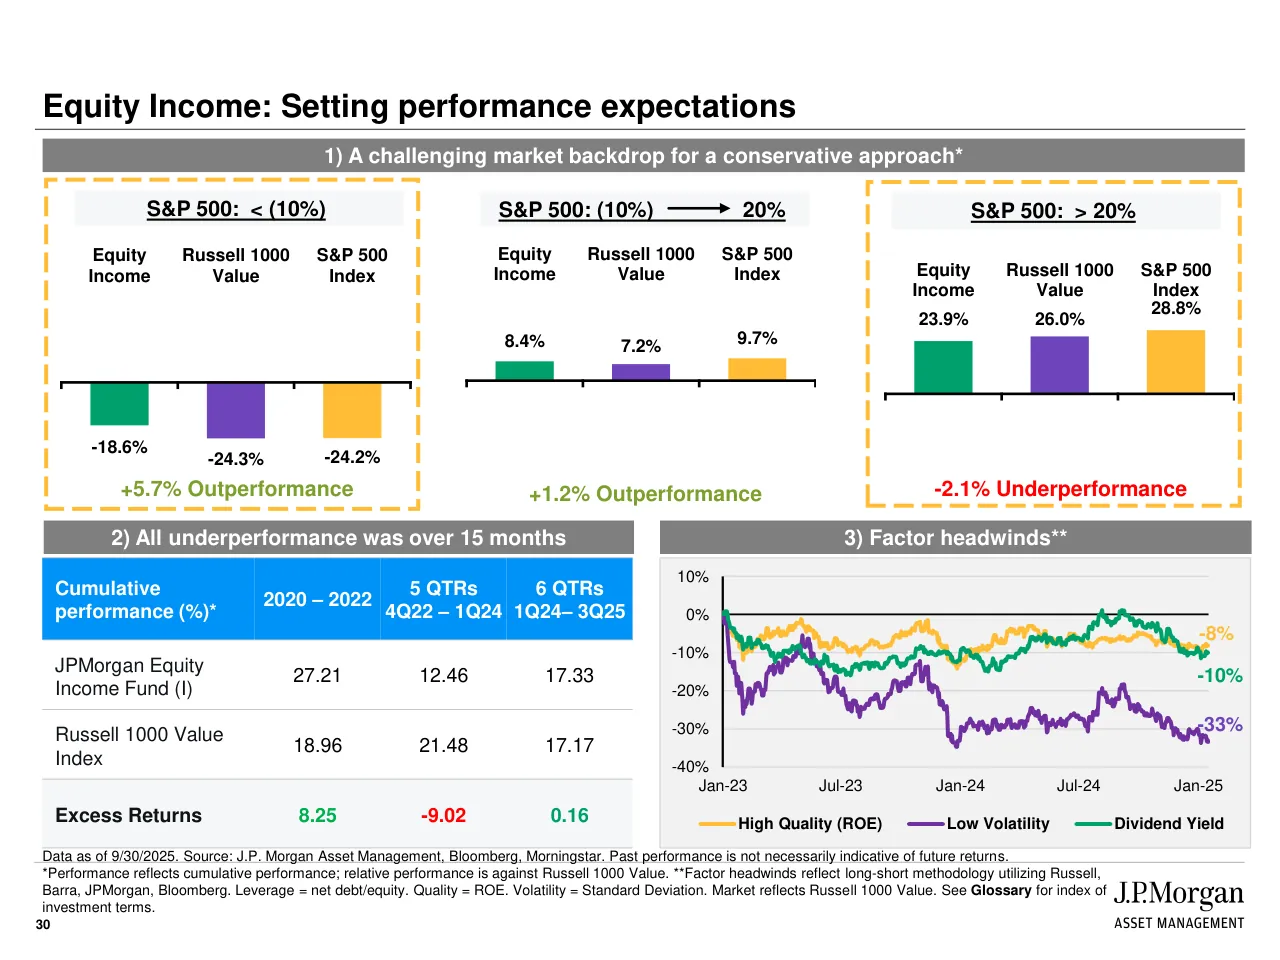
This 3Q 2025 strategy review for the JPMorgan Equity Income separately managed account is a numbered 38-slide deck. It opens with a cover and table of contents, then a Capabilities section covering the firm's roughly $4T in assets under supervision, its global equities resources, and equity assets under management. An Expertise section introduces the portfolio management and research team with experience figures for each person. The Portfolio section presents the bottom-up investment philosophy and process, a performance versus volatility chart, sector positions, top holdings, portfolio characteristics and third-quarter trades. A Results section compares annualized and calendar-year performance against the Russell 1000 Value Index, followed by quarter and year-to-date attribution tables. The appendix adds drawdown analysis, dividend sustainability charts, performance expectations, rolling excess returns, biographies, a GIPS composite reference, a glossary and disclosures. The deck closes on the disclosure page. Slide 13 pairs a percentile-ranking chart with a three-metric comparison, slide 30 uses three cumulative performance panels for market-cycle context, and slide 12 lays out the stock selection process as a four-step flow.
Slides worth studying
Questions about this deck
How many slides does the J.P. Morgan Asset Management JPMorgan Equity Income strategy review deck have?
The deck is a numbered 38-slide presentation, opening with a cover and table of contents on slides 1 and 2. Its sections are Capabilities, Expertise, Portfolio, Results, Appendix and GIPS Report, with the disclosure page closing the deck.
What does the J.P. Morgan Asset Management deck say about its assets under supervision?
Slide 4 is titled "JPMAM: Broad, diversified ~$4T AUS active manager" and shows total assets under supervision of $3.9T as of June 30, 2025. The same slide breaks these assets down by asset class, including Equities at $1,160 billion and Fixed Income at $925 billion.
What annualized performance does J.P. Morgan Asset Management report for the Equity Income SMA Composite on slide 20?
Slide 20 shows the Equity Income SMA Composite (Gross) at 5.46% for 3Q 2025 and 10.86% since inception (11/30/2002). Over the same periods the Russell 1000 Value Index shows 5.33% for 3Q 2025 and 9.16% since inception.
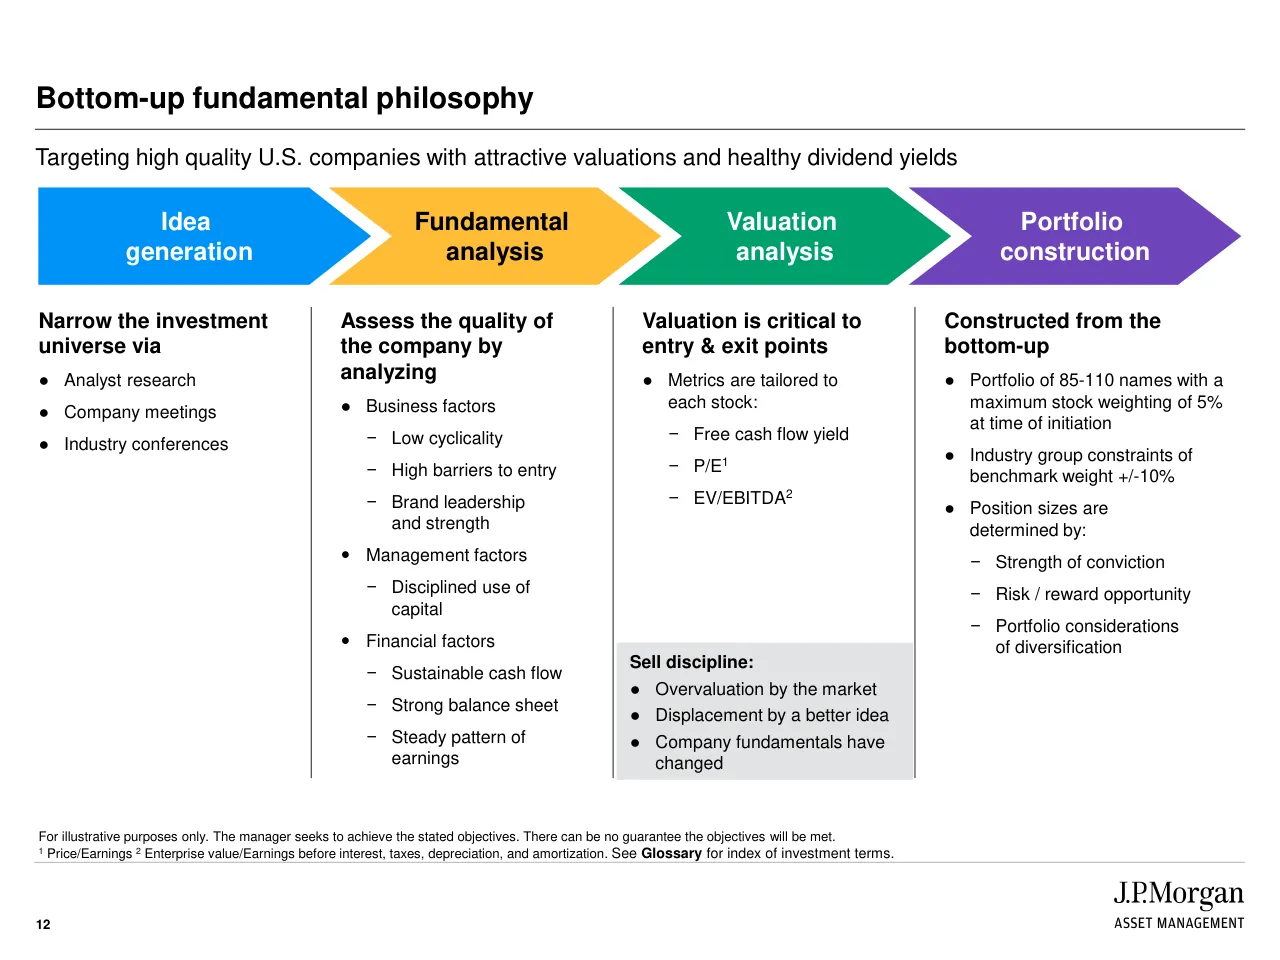
How is the J.P. Morgan Asset Management stock selection process structured in the deck?
Slide 12 lays out the bottom-up fundamental philosophy as a four-step flow: Idea generation, Fundamental analysis, Valuation analysis and Portfolio construction. The same slide states the portfolio holds 85-110 names with a maximum stock weighting of 5% at time of initiation.
Details
- Company: J.P. Morgan Asset Management
- Year: 2025
- Type: Fund presentation
- Industry: Asset management
- Pages: 38
Review score: 7 out of 10, Effective
Presentation quality, judged with the SlideDeck Co review heuristic. Ask, evidence and idea merit are not rated here.
The deck has a clear route (capabilities, team, process, portfolio, results, appendix) with divider slides, a consistent grid and a restrained color system, and slides 12 and 13 carry the argument with clear headlines and readable charts. It is built as a reading and reference document for advisors, so the dense tables on slides 16, 17, 20 and 36 are mostly appropriate, but the dense and overlong fine print and small table text make several pages hard to scan. Weaker spots hurt use: slide 30 packs three charts, a table and a line chart into one page with a small axis scale and unlabeled bar groupings, slide 20 is a very small two-table page, and the contents page, the cover and divider slides are plain, so the deck reads as competent compliance-driven material rather than a crafted story.
Worth keeping: Keep the four-step colored chevron flow with matching column text on slide 12, the action-title headlines with consistent subtitle and as-of dates, and the divider slides with the stable footer.
Most useful repair: Cut slide 30 into two slides, enlarge the table and chart text on slides 20, 21 and 22, and shorten or shrink the footnote blocks that crowd slides 13 and 30.
What would change the score: I would add a short summary of the key results up front, trim the pages in the middle that repeat positioning data, and label the colored bars on slide 13 and slide 30 directly so readers do not rely on the legends.
Confidence high. 38 of 38 pages inspected on contact sheets, 4 at readable size. Reviewed 2026-11-08. Model-assisted review (claude-sonnet-5-5).
Full text of the slides (38 slides)
Every slide's words and a description of its charts and images, so the deck can be searched and rebuilt. Also available as Markdown.
Slide 1
3Q 2025
JPMorgan Equity Income / Strategy
Separately Managed Account
J.P.Morgan
ASSET MANAGEMENT
Visuals: One icon at right of the grey panel: a concentric ring diagram drawn with black strokes. The outer ring is split into segments and the inner ring is split into segments, with thin black radial divider lines between them. The upper-left quadrant of the outer ring is filled solid bright blue (#0092F9) and forms a quarter-disc whose straight edges meet at the centre. The remaining segments are unfilled black outlines of about 0.3% of slide width. The icon's bounding box is about x 75.3%, y 31.1%, width 17.5%, height 23.4%. Logo: J.P.Morgan wordmark in black serif type above the words ASSET MANAGEMENT in black condensed sans-serif capitals, right-aligned at the bottom-right corner.
Slide 2
Table of contents
Capabilities
Equity Income
● Expertise
● Portfolio
● Results
Appendix
● GIPS® Report
J.P.Morgan
ASSET MANAGEMENT
2
Visuals: Only the J.P.Morgan Asset Management logo at bottom right: a serif 'J.P.Morgan' wordmark above sans-serif capitals 'ASSET MANAGEMENT'. No charts, tables, photographs or illustrations.
Slide 3
Capabilities
3
J.P.Morgan
ASSET MANAGEMENT
Visuals: Two thin white horizontal hairline rules (one above the title, one above the footer) and the J.P.Morgan Asset Management logo lockup at bottom right (serif 'J.P.Morgan' wordmark over a small sans-serif 'ASSET MANAGEMENT' line). No photographs, charts or illustrations.
Slide 4
JPMAM: Broad, diversified ~$4T AUS active manager
The power of perspective to build stronger portfolios
Assets under supervision ($B)
By Asset Class1,2
$205
Alternatives
Solutions
$1,160
Equities
$3.9T
$925
Fixed
Income
$473
$1,359
Liquidity
By Client Segment1
$1,203
Liquidity
$1,707
Financial
Intermediaries
$3.9T
$982
Institutional
$480M
Annual research budget3
70+
Investment engines4
57%
Largest pensions / SWFs as clients4
>70%
Coverage of industry assets5
With revenue diversified across regions1
63%
Americas
24%
EMEA
13%
APAC
Global 2024 rankings
#1
Active Flows6
#1
Active ETF Flows7
#1
Active Equity Flows6
#2
Active Fixed Income Flows6
#1
Institutional Money Market Funds AUM8
As of June 30, 2025; unless otherwise noted. Due to rounding, data may not always add up to the total assets under supervision (AUS).
1As of June 30, 2025. Includes custom glide path and retail advisory assets; 2 AUS by asset class includes AUS managed behalf of other investment teams; 3 Only for AM; 4 J.P. Morgan Asset Management as of December 31, 2024; 5 J.P. Morgan Asset Management Business Intelligence, as of December 31, 2024, and includes U.S. Advisors only; 6 J.P. Morgan Asset Management, ISS Market Intelligence Simfund, public filings and company websites; 7 Morningstar; 8 iMoneyNet. See Glossary for index of investment terms.
J.P.Morgan
ASSET MANAGEMENT
4
Visuals: Chart 1, donut 'By Asset Class' (no printed chart title beyond the heading 'By Asset Class1,2'): outer ring segments with labelled values: Equities $1,160 (dark navy #00458A, top-right segment), Liquidity $1,359 (bright blue #208FFF, bottom segment), Fixed Income $925 (mid blue #006CC2, left segment), Alternatives $205 (bright blue #0092F9, small top-left segment). Inner ring: Solutions $473 (light blue #97D4FF), shown as a ring between the outer ring and the centre. Centre label $3.9T in black. Thin white separator lines between segments. No legend; segments labelled directly with callout text. Units: $ billions (AUS in $B). Chart 2, donut 'By Client Segment' (heading 'By Client Segment1'): single ring with three segments: Financial Intermediaries $1,707 (dark green #007952, right and top-right segment), Institutional $982 (very dark green #005136, bottom segment), Liquidity $1,203 (green #00A16D, left and top-left segment). Centre label $3.9T in black. Thin white separators between segments. No legend; direct labels. No highlighted points. Stat box 1 (blue #0092F9 box): $480M 'Annual research budget3' and 70+ 'Investment engines4', separated by a thin white vertical rule. Stat box 2 (green #00A16D box): 57% 'Largest pensions / SWFs as clients4' and >70% 'Coverage of industry assets5', separated by a thin white vertical rule. Regional band (purple #6F44BB): 63% Americas, 24% EMEA, 13% APAC, with two thin white vertical dividers between columns. Rankings panel: five rows with a large '#' rank numeral at left and a label at right: #1 Active Flows6; #1 Active ETF Flows7; #1 Active Equity Flows6; #2 Active Fixed Income Flows6; #1 Institutional Money Market Funds AUM8. No icons or photographs. No logos other than the J.P.Morgan wordmark bottom-right.
Slide 5
Global Equities: Drawing on resources around the world
137 Fundamental Research
19 Quant. Research & Data Science
140 Portfolio Managers
32 Traders & Analytics
55 Investment Specialists
6 Heads of Research / 64 North America Analysts / 13 Asia Analysts / 15 Europe Analysts / 39 EM Analysts
8 Analysts – London / 11 Analysts – New York
34 US Equities / 60 International Equities / 46 Emerging market Equities
26 Traders / 6 Trading Analytics & Strategy
10 Investment Specialists in Asia / 18 Investment Specialists in Europe / 27 Investment Specialists in US
37 Implementation
13 Implementation Specialists - London / 15 Implementation Specialists - New York / 4 Implementation Specialists - Hong Kong / 3 Implementation Specialists - Taiwan / 2 Implementation Specialists - Japan
48 Sustainable Investing & Stewardship Team
25 Stewardship / 23 Sustainable Investing
400+ equity professionals in 9 locations worldwide
2500+ companies under coverage with over 5000 contacts per year
USD 190M+ annual global equity research budget*
1 technology platform (Spectrum) connecting a world of insights ^^
91% of Global Equity AUM is outperforming over the past 10 years
Data as 30 June 2025. This data is for the Global Equities Platform. Updated annually. Note this illustrates the resources available and does not necessarily reflect reporting lines. See Glossary for index of investment terms.
5
J.P.Morgan
ASSET MANAGEMENT
Visuals: Five coloured number tiles across the top row: 137 Fundamental Research in blue, 19 Quant. Research & Data Science in amber, 140 Portfolio Managers in green, 32 Traders & Analytics in purple, 55 Investment Specialists in navy. Second row: 37 Implementation in orange at left, 48 Sustainable Investing & Stewardship Team in olive green at right. Each tile has a large number at left and a label at right, separated by a thin vertical white line. Below each tile is a plain black list of sub-counts. A flat light grey (#E2E4E5) world map with white country borders fills the centre, with about nine small blue (#0092F9) ring markers with white centres at London, New York, Paris area, India, Hong Kong, Taiwan, Japan, Korea and Singapore. Four statistics with thin dark vertical dividers at about 28.9%, 54.9% and 77.5% of width. No photographs, charts or icons besides the logo.
Slide 6
Equities assets under management
As of September 30, 2025, J.P. Morgan Asset Management’s Equity teams manage USD 1,260 billion
Equities
USD 1,260bn total assets under management
U.S. Equity
USD 893bn total assets under management
USD 242bn
19%
USD 126bn
10%
USD 893bn
71%
USD 325bn
36%
USD 407bn
46%
USD 162bn
18%
U.S. Equity
Emerging Markets & Asia Pacific Equity
International Equity Group
Core
Value
Growth
Source: J.P. Morgan Asset Management. Data includes internal Fund of Funds and joint ventures. See Glossary for index of investment terms.
6
J.P.Morgan
ASSET MANAGEMENT
Visuals: Two donut charts, both with segments drawn clockwise from 12 o'clock. Left chart, titled Equities with total USD 1,260bn: a blue segment USD 893bn (71%) covering the right and bottom, a yellow segment USD 126bn (10%) at the lower left, and a green segment USD 242bn (19%) at the upper left. Legend below in three rows: blue square U.S. Equity, yellow square Emerging Markets & Asia Pacific Equity, green square International Equity Group. Right chart, titled U.S. Equity with total USD 893bn: a blue segment USD 407bn (46%) at the upper right and right, a yellow segment USD 162bn (18%) at the bottom, and a green segment USD 325bn (36%) covering the upper left and left. Legend in one row below: blue square Core, yellow square Value, green square Growth. Segments are separated by thin white gaps. Labels sit outside each segment with the USD value above and the percentage below in larger type. No highlighted points.
Slide 7
Expertise
7
Slide 8
An experienced team dedicated to value
The team also leverages the insights of the J.P. Morgan Equity organization, which includes over 20 research analysts in the U.S. and over 200 analysts globally
Jon Sherman
Managing Director
Head of U.S. Equity
Experience: 28/21
Don San Jose
Managing Director
CIO Value Team
Experience: 28/26
Equity Income Team
Andrew Brandon
Managing Director
Portfolio Manager
Experience: 28/26
David Silberman
Managing Director
Portfolio Manager
Experience: 36/36
Lerone Vincent
Managing Director
Research Analyst
Experience: 27/27
Tony Lee
Executive Director
Research Analyst
Experience: 13/13
Laura Huang
Executive Director
Research Analyst
Experience: 20/20
Investment Specialist Team
Jaime Steinhardt
Managing Director
Experience: 15/15
Rory Houser
Vice President
Experience: 10/10
Anne Sisto
Vice President
Experience: 10/8
Ellie O’Donoghue
Associate
Experience: 5/5
As of September 30, 2025. Years of experience: Industry / Firm.
8
Visuals: Eleven circular headshot photographs, each cropped to a circle about 8% of slide width, with name and role text beside them. Subjects in order: Jon Sherman (man, short greying hair, navy suit, light blue open-collar shirt, grey studio backdrop); Don San Jose (smiling man, dark suit, white shirt, patterned tie, grey backdrop); Andrew Brandon (smiling man with glasses, dark suit, green tie, blurred city backdrop in blue-grey); David Silberman (smiling man with grey hair, dark suit, blue tie, blurred city backdrop); Lerone Vincent (smiling man, dark suit, blue striped tie, blurred blue-grey backdrop); Tony Lee (smiling man with round glasses, dark suit, grey tie, blurred backdrop); Laura Huang (smiling woman with long dark hair, dark top, blurred blue-grey backdrop); Jaime Steinhardt (smiling woman with brown hair, dark top, dark grey backdrop); Rory Houser (smiling man, navy suit, striped tie, blurred city backdrop); Anne Sisto (smiling woman with long brown hair, dark top, light grey backdrop); Ellie O’Donoghue (smiling woman with red hair, black top, dark grey backdrop). Lighting is soft and even, framing is head-and-shoulders, all photos are circular crops with no overlay. Thin black horizontal lines run behind the photos and name blocks. No charts, tables or logos apart from the footer logo.
Slide 9
A team of skilled research analysts with 25+ years of experience
Each analyst is supported by a dedicated research associate, with an average of 8+ years of experience
David Small / Managing Director / Director of U.S. Research / Experience: 25/21
Danielle Hines / Managing Director / Associate Director of U.S. Research / Experience: 16/16
Consumer
Lisa S. Sadioglu / Managing Director / Consumer Cyclicals / Experience: 25/25
Greg Fowlkes / Managing Director / Retail / Experience: 26/20
Ryan Vineyard / Managing Director / Consumer Staples / Experience: 21/14
Healthcare
Bartjan van Hulten / Managing Director / Pharma / Biotech / Experience: 29/7
Misha Lozovik / Executive Director / Health Svcs & Medtech / Experience: 29/3
Financials
Steven Wharton / Managing Director / Banks & Capital Markets / Experience: 30/20
Brent Gdula / Executive Director / Insurance / Experience: 17/17
David Chan / Executive Director / Payments / Business Services / Experience: 18/8
REITs
Jason Ko / Executive Director / REITs / Experience: 24/24
Nick Turchetta / Executive Director / REITs / Experience: 15/6
Telecom, Media & Technology
Robert Bowman / Managing Director / Semis & Hardware / Experience: 32/32
Eric Li Cheung / Executive Director / Software and Svcs / Experience: 20/3
Sagar Rastogi / Executive Director / Software and Svcs / Experience: 17/8
Kris Erickson / Managing Director / Media / Experience: 25/13
Ryan Vineyard / Managing Director / Telecom & Cable / Experience: 21/14
Industrials
David Maccarrone / Managing Director / Energy/Infrastructure / Experience: 31/15
Aga Zmigrodzka / Executive Director / Energy/Infrastructure / Experience: 16/4
Teresa Kim / Managing Director / Utilities / Experience: 27/3
Joanna Shatney / Managing Director / Industrial Cyclicals / Experience: 29/11
Andrew Brill / Executive Director / Industrial Cyclicals / Experience: 22/9
As of September 30, 2025. Years of experience: Industry/ Firm.
J.P.Morgan
ASSET MANAGEMENT
9
Visuals: Twenty-two circular portrait photographs of analysts, one per person, each a head-and-shoulders headshot in business attire against a soft, mostly neutral blurred background, lit evenly by front light, and cropped to a circle of about 6% of slide width. Each photo is placed to the left of its name block and sits over the row rule. Also a J.P.Morgan wordmark logo bottom-right with the words ASSET MANAGEMENT beneath it. Thin black horizontal rules: one under the title, one across the top row, one per staff row, and one above the footnote in grey. No charts or tables.
Slide 10
Portfolio / 10 / J.P.Morgan / ASSET MANAGEMENT
Visuals: Thin white horizontal hairline rules at about y 25.7% (top) and y 89.8% (bottom), spanning x about 2.7% to 97.3%. J.P.Morgan wordmark logo (white serif 'J.P.Morgan' with 'ASSET MANAGEMENT' in white sans-serif capitals) at bottom right. No photographs, charts or icons.
Slide 11
Investment philosophy
“Our bottom-up fundamental philosophy targets high quality U.S. companies
with attractive valuations and healthy dividend yields.”
1. Quality
We focus on quality first:
● Companies with durable franchises
● Consistent earnings
● Strong management teams
2. Valuation
Valuation is critical:
● Quantitative and qualitative judgements
● Potential vs. current market value
3. Dividend
Dividend yields:
● Enhance total return
● Generate income
● Modest payout ratio indicates a
disciplined use of capital
Our approach leads to a portfolio that has historically
shown less volatility than the market with less exposure to the downside
For illustrative purposes only. The manager seeks to achieve the stated objectives. There can be no guarantee the objectives will be met. See Glossary for index of investment terms.
J.P.Morgan
ASSET MANAGEMENT
11
Visuals: No photographs, charts or tables. Three flat coloured header bars: a blue bar (#0092F9) with the white bold label '1. Quality', a yellow bar (#FFBE37) with the black bold label '2. Valuation', and a green bar (#00A16D) with the white bold label '3. Dividend'; each is a plain rectangle with square corners and no shadow. Below each bar is a solid black downward-pointing triangle about 3.2% of slide width wide and 2% tall, centred under its column. Two thin dark grey vertical divider lines (about #333333, roughly 0.1% of width) run from about 33.9% to 68.7% of slide height at x about 33.9% and 66.2%. A thin dark rule under the title spans the width, and a thin light grey rule sits above the footer. A light grey panel (#F5F7F8) holds the bold conclusion statement. A black-outlined rectangle (about 1 px, #000000, no fill, square corners) frames the quote. Logo: the 'J.P.Morgan' wordmark in a black serif typeface with 'ASSET MANAGEMENT' in black spaced capitals beneath it, bottom right.
Slide 12
Bottom-up fundamental philosophy
Targeting high quality U.S. companies with attractive valuations and healthy dividend yields
Idea generation
Fundamental analysis
Valuation analysis
Portfolio construction
Narrow the investment universe via
● Analyst research
● Company meetings
● Industry conferences
Assess the quality of the company by analyzing
● Business factors
– Low cyclicality
– High barriers to entry
– Brand leadership and strength
● Management factors
– Disciplined use of capital
● Financial factors
– Sustainable cash flow
– Strong balance sheet
– Steady pattern of earnings
Valuation is critical to entry & exit points
● Metrics are tailored to each stock:
– Free cash flow yield
– P/E¹
– EV/EBITDA²
Sell discipline:
● Overvaluation by the market
● Displacement by a better idea
● Company fundamentals have changed
Constructed from the bottom-up
● Portfolio of 85-110 names with a maximum stock weighting of 5% at time of initiation
● Industry group constraints of benchmark weight +/-10%
● Position sizes are determined by:
– Strength of conviction
– Risk / reward opportunity
– Portfolio considerations of diversification
For illustrative purposes only. The manager seeks to achieve the stated objectives. There can be no guarantee the objectives will be met.
¹ Price/Earnings ² Enterprise value/Earnings before interest, taxes, depreciation, and amortization. See Glossary for index of investment terms.
J.P.Morgan
ASSET MANAGEMENT
12
Visuals: Process diagram of four horizontal chevron arrows in a row, left to right: Idea generation (blue), Fundamental analysis (yellow), Valuation analysis (green), Portfolio construction (purple). Each chevron has a white gap to the next and the labels are centred in each chevron. Below the chevrons, four text columns of bullets, with thin vertical black dividers between columns 1-2, 2-3 and 3-4. A light grey rectangle (Sell discipline callout) sits at the bottom of column 3. Footer includes the J.P.Morgan wordmark and ASSET MANAGEMENT caption in the bottom right corner. No photographs, charts or tables.
Slide 13
Equity Income has top quartile performance coupled with bottom decile volatility
JPMorgan Equity Income Strategy as of June 30, 2025
Standard deviation since inception*
Lower volatility:
9th percentile standard deviation
13.2%
15.2%
15.2%
JPMorgan Equity Income / Strategy / eVestment LCV Median / Russell 1000 Value Index
Down capture potential since inception**
Attractive potential downside protection
13th percentile downside capture
83%
96%
J.P. Morgan Equity Income Strategy / eVestment LCV Median
Batting average since inception***
Alpha consistency:
8th percentile batting average
57%
52%
J.P. Morgan Equity Income Strategy / eVestment LCV Median
Performance (Net of Fee)*
Better Performance
23rd percentile returns
Equity Income
Russell 1000 Value Index
10.7%
9.9%
-5.5%
-7.1%
-7.2%
-11.3%
Down Quarter
Down Year
Since Inception
Source: J.P. Morgan Asset Management, eVestment. *Strategy Inception: 11/30/2002. Supplemental to standardized performance. Past performance is no guarantee of future results.
Risk is measured by standard deviation – a gauge of the variance of a manager's return over its average or mean. ** Down capture measures performance of the manager relative to the index in down markets. ***
Consistency is measured by batting average – calculated by dividing the number of months in which the manager beats or matches the index by the total number of months in the period.
Sourced from eVestment Alliance as of 6/30/2025. Statistics are computed using monthly data. The eVestment ranking is a percentile ranking based on the strategy's annualized return (gross of fees). Equity Income was ranked against the following number of institutional products in the eVestment Large Cap Value, for the since inception excess return (23rd percentile / 172 observations); standard deviation (9th percentile / 178 observations), batting average (8th percentile/ 172 observations), and down capture (13th / 172 observations). See Glossary for index of investment terms.
13
J.P.Morgan
ASSET MANAGEMENT
Visuals: Four bar charts in panels. (1) Standard deviation since inception*: vertical bar chart, no axis scale printed, three bars with labelled values: JPMorgan Equity Income Strategy 13.2% (blue #0092F9), eVestment LCV Median 15.2% (yellow #FFBE37), Russell 1000 Value Index 15.2% (green #00A16D); callout 'Lower volatility: 9th percentile standard deviation' above the first bar. (2) Down capture potential since inception**: vertical bar chart with two bars: J.P. Morgan Equity Income Strategy 83% (blue), eVestment LCV Median 96% (yellow); callout 'Attractive potential downside protection / 13th percentile downside capture' above the left bar. (3) Batting average since inception***: vertical bar chart with two bars: J.P. Morgan Equity Income Strategy 57% (blue), eVestment LCV Median 52% (yellow); callout 'Alpha consistency: 8th percentile batting average' above right bar. (4) Performance (Net of Fee)*: clustered column chart around a zero baseline with no axis scale printed; legend top right: Equity Income (blue square), Russell 1000 Value Index (green square). Categories Down Quarter (Equity Income -5.5%, Russell 1000 Value Index -7.1%), Down Year (Equity Income -7.2%, Russell 1000 Value Index -11.3%), Since Inception (Equity Income 10.7%, Russell 1000 Value Index 9.9%). Callout 'Better Performance / 23rd percentile returns' at top left. No highlighted points beyond the callouts. Bars in charts 1 and 2 are not highlighted apart from colour coding. Logo: J.P.Morgan wordmark in serif with ASSET MANAGEMENT in sans-serif caps below, bottom right.
Slide 14
Sector positions
JPMorgan Equity Income Portfolio as of September 30, 2025
Benchmark
Russell 1000 Value Index
Absolute sector & relative weightings (%)
30
26.6
25
20
14.9
15
13.5
11.3
10
8.0
7.6
5.3
4.7
5
3.1
2.4
1.7
0
Financials
Industrials
Health Care
Information
Technology
Consumer
Discretionary
Consumer
Staples
Energy
Utilities
Real Estate
Materials
Communication
Services
Relative
Positioning
(%)1
3.9
1.8
1.8
0.9
0.3
0.0
-0.7
0.2
-1.1
-1.7
-6.3
Source: J.P. Morgan Asset Management, Frank Russell Company, Wilshire Atlas (includes cash). For illustrative purposes only. 1Reflects relative position to the benchmark Russell 1000 Value Index. The
Portfolio is actively managed. Holdings, sector weights, allocations and leverage, as applicable are subject to change at the discretion of the Investment Manager without notice. See Glossary for index of
investment terms.
14
J.P.Morgan
ASSET MANAGEMENT
Visuals: Vertical bar chart titled Absolute sector & relative weightings (%). Y axis runs 0 to 30 in steps of 5, unit percent (%), with tick labels at 0, 5, 10, 15, 20, 25 and 30. X axis lists 11 sectors as categories. One series of solid blue bars, each with a value label above it: Financials 26.6; Industrials 14.9; Health Care 13.5; Information Technology 11.3; Consumer Discretionary 8.0; Consumer Staples 7.6; Energy 5.3; Utilities 4.7; Real Estate 3.1; Materials 2.4; Communication Services 1.7. No legend; no highlighted points. Beneath the chart is a table with one row labelled Relative Positioning (%)1 and values in the same column order: 3.9, 1.8, 1.8, 0.9, 0.3, 0.0, -0.7, 0.2, -1.1, -1.7, -6.3. Logo: J.P.Morgan wordmark with ASSET MANAGEMENT beneath, bottom right. No photographs or icons.
Slide 15
Financials: Opportunities to add value in different rate environments
JPMorgan Equity Income Portfolio as of September 30, 2025
26.6%
Current / Financials Weight
Portfolio diversification / across sub-sector
0.7%
0.9%
1.2%
2.4%
8.3%
3.6%
4.3%
5.2%
Diversified Banks
Investment Banking & Brokerage
Asset Management & Custody Banks
Consumer Finance
Other Insurance
Insurance Brokers
Transaction & Payment Services
Financial Exchanges & Data
Source: J.P. Morgan Asset Management, Wilshire Atlas (includes cash). See Glossary for index of investment terms.
J.P.Morgan
ASSET MANAGEMENT
15
Visuals: Donut chart, untitled, with a percentage label outside each segment and a legend at right. Segments run clockwise from 12 o'clock: Diversified Banks 8.3% (bright blue #0092F9, largest segment, about 8.3% of the ring), Investment Banking & Brokerage 5.2% (amber #FFBE37), Asset Management & Custody Banks 4.3% (orange #EB7200), Consumer Finance 3.6% (green #00A16D), Other Insurance 2.4% (dark navy #00458A), Insurance Brokers 1.2% (purple about #7030A0), Transaction & Payment Services 0.9% (olive green about #7FA332), Financial Exchanges & Data 0.7% (red #FF0000). The eight values sum to 26.6%, matching the panel figure. Ring is about 15% of slide width in outer radius with a white hole of about half the outer radius; segments separated by no visible gaps. No axes, no legend title, no highlighted points. Legend: eight rows of small filled squares (about 1% of slide width) in the segment colours, each followed by its category name, spaced about 3.6% apart vertically from y 34.2% to 58.8%. Left grey panel is a flat rectangle with no photograph or icon.
Slide 16
Stock positioning / JPMorgan Equity Income Portfolio as of September 30, 2025 / Top 10 holdings / Portfolio / Dividend / Weight (%) / Yield (%) / Wells Fargo 3.52 2.13 / Bank of America 3.02 2.14 / Philip Morris 2.18 3.61 / Microsoft 2.05 0.71 / ConocoPhillips 2.03 3.26 / Charles Schwab 2.03 1.11 / Eaton 1.99 1.13 / General Dynamics 1.93 1.81 / Chevron 1.93 4.38 / Air Products & Chemicals 1.87 2.65 / Total 22.54 / Top 5 overweights / Portfolio / Benchmark / Relative / weight (%) / weight(%) / position (%) / 1 / Wells Fargo 3.52 0.93 2.59 / Microsoft 2.05 0.00 2.05 / Bank of America 3.02 1.10 1.92 / Air Products and Chemicals 1.87 0.21 1.66 / General Dynamics 1.93 0.30 1.63 / Top 5 underweights / Portfolio / Benchmark / Relative / weight (%) / weight(%) / position (%) / 1 / Berkshire Hathaway 0.00 3.19 -3.19 / Alphabet 0.00 3.13 -3.13 / JPMorgan Chase & Co 2 0.00 3.01 -3.01 / Amazon 0.00 1.99 -1.99 / Exxon 0.00 1.68 -1.68 / 1Reflects relative position to the Russell 1000 Value Index. 2Due to regulatory reasons, the portfolio is unable to hold JPMorgan Chase & Co. / Source: J.P. Morgan Asset Management (includes cash), Frank Russell Company. Percentages may not add up to 100% due to rounding and cash. Holdings and allocations are subject to / change at the discretion of the Investment Manager without notice. The inclusion of the securities mentioned above is not to be interpreted as recommendations to buy or sell. For illustrative / purposes only. See Glossary for index of investment terms. / J.P.Morgan / ASSET MANAGEMENT / 16
Visuals: Three tables, no charts, photographs or logos apart from the wordmark. Table 1, Top 10 holdings: columns Top 10 holdings (name), Portfolio Weight (%), Dividend Yield (%); rows Wells Fargo 3.52 / 2.13; Bank of America 3.02 / 2.14; Philip Morris 2.18 / 3.61; Microsoft 2.05 / 0.71; ConocoPhillips 2.03 / 3.26; Charles Schwab 2.03 / 1.11; Eaton 1.99 / 1.13; General Dynamics 1.93 / 1.81; Chevron 1.93 / 4.38; Air Products & Chemicals 1.87 / 2.65; Total 22.54 (portfolio weight only, dividend yield blank). Table 2, Top 5 overweights: columns Portfolio weight (%), Benchmark weight (%), Relative position (%) with superscript 1; rows Wells Fargo 3.52 / 0.93 / 2.59; Microsoft 2.05 / 0.00 / 2.05; Bank of America 3.02 / 1.10 / 1.92; Air Products and Chemicals 1.87 / 0.21 / 1.66; General Dynamics 1.93 / 0.30 / 1.63. Table 3, Top 5 underweights: same columns; rows Berkshire Hathaway 0.00 / 3.19 / -3.19; Alphabet 0.00 / 3.13 / -3.13; JPMorgan Chase & Co (superscript 2) 0.00 / 3.01 / -3.01; Amazon 0.00 / 1.99 / -1.99; Exxon 0.00 / 1.68 / -1.68. No highlighted points. Numbers are centred in their columns. Table header cells are filled, and row bands alternate white and very light grey.
Slide 17
Portfolio characteristics
JPMorgan Equity Income Portfolio as of September 30, 2025
Benchmark Russell 1000 Value Index
Portfolio Benchmark
Portfolio Portfolio Benchmark
P/E Ratio1 16.8x 17.1x
EPS Growth2 10.0% 9.7%
Average Market Cap3 $258.0 B $518.2 B
Number of Holdings 83 856
Current Dividend Yield 2.3% 1.5%
Dividend Growth4 4.9% 6.1%
Active Share 68.3% N/A
ROE6 20.0% 19.2%
ROIC4 11.7% 10.7%
Standard Deviation5 14.6% 15.8%
Turnover6 15.7% N/A
Tracking Error5 2.67 N/A
Beta5 0.91 1.00
BARRA tilts relative to benchmark
Size 0.22
Dividend Yield 0.21
Leverage 0.18
Earnings Quality 0.07
Momentum 0.07
Earnings Yield 0.01
Growth -0.02
Profitability -0.06
Value -0.10
Beta -0.14
Market capitalization weightings3
Portfolio Benchmark
98% 85%
1% 11%
4%
1%
> $25 B $10 B - $25 B $5 B - $ 10 B < $5 B
Source: J.P. Morgan Asset Management, Frank Russell Company, Bloomberg, BARRA, Wilshire Atlas (includes cash). The above characteristics are shown for illustrative purposes only and are subject to
change without notice. Representative the current portfolio holdings. However, it cannot be assumed that these types of investments will be available to or will be selected by the portfolio in the future.
1FY2 (excl neg). 2Consensus P/E Fwd 2. 3USD. 4Trailing 12 months. 5Trailing 5 years (Annualized) 6Trailing 3 Years See Glossary for index of investment terms.
17
J.P.Morgan
ASSET MANAGEMENT
Visuals: Three visual elements. (1) Table: 3 columns (row label, Portfolio, Benchmark) and 13 rows (header plus 12 data rows) with values: P/E Ratio 16.8x / 17.1x; EPS Growth 10.0% / 9.7%; Average Market Cap $258.0 B / $518.2 B; Number of Holdings 83 / 856; Current Dividend Yield 2.3% / 1.5%; Dividend Growth 4.9% / 6.1%; Active Share 68.3% / N/A; ROE 20.0% / 19.2%; ROIC 11.7% / 10.7%; Standard Deviation 14.6% / 15.8%; Turnover 15.7% / N/A; Tracking Error 2.67 / N/A; Beta 0.91 / 1.00. Header row is grey #E2E4E5 with bold labels. (2) Horizontal bar chart titled BARRA tilts relative to benchmark, with a vertical black zero axis at about x 76.7%; no axis scale or units are printed. Bars are labelled with values: Size 0.22 (blue), Dividend Yield 0.21 (blue), Leverage 0.18 (blue), Earnings Quality 0.07 (blue), Momentum 0.07 (blue), Earnings Yield 0.01 (blue), Growth -0.02 (yellow-orange), Profitability -0.06 (yellow-orange), Value -0.10 (yellow-orange), Beta -0.14 (yellow-orange). Positive bars extend right of the axis in blue #0092F9, negative bars extend left in yellow #FFBE37. No legend and no highlighted points. (3) Column chart titled Market capitalization weightings with superscript 3, legend Portfolio (blue #0092F9) and Benchmark (yellow #FFBE37), no y-axis or scale printed, black baseline. Categories and labelled values: > $25 B Portfolio 98%, Benchmark 85%; $10 B - $25 B Portfolio 1%, Benchmark 11%; $5 B - $ 10 B Benchmark 4% with no visible Portfolio bar (about 0%); < $5 B label 1% with no visible bar, series not identifiable from position. No photographs, icons or illustrations.
Slide 18
Portfolio activity: 3Q 2025
JPMorgan Equity Income Portfolio as of September 30, 2025
Top buys1
Top sells1
Citi*
Exxon Mobil*
Medtronic
UnitedHealth
Accenture*
Seagate Technologies
Nike
Charles Schwab
Mondelēz
Wells Fargo
Source: J.P. Morgan Asset Management
1 Based on change in position size
*Was either initiated or eliminated during the quarter.
Holdings and allocations are subject to change at the discretion of the Investment Manager without notice. The companies/securities above are shown for illustrative purposes only. Their inclusion should not be
interpreted as a recommendation to buy or sell. The Portfolio is actively managed. Holdings, sector weights, allocations and leverage, as applicable are subject to change at the discretion of the Investment Manager
without notice. See Glossary for index of investment terms.
J.P.Morgan
ASSET MANAGEMENT
18
Visuals: Two small line-and-colour icons. (1) Top-left above Top buys: a stack of three outlined coins drawn in thin black strokes with a solid bright blue circle bearing a white dollar sign overlapping their lower-left, icon about 4.2% wide by 5.4% high, unboxed on white. (2) Top-right above Top sells: a black-outlined open hand palm-up holding a solid bright blue circle with a white dollar sign, icon about 4.1% wide by 5.4% high, unboxed on white. Ten round chevron buttons, each a light grey circle (#F2F3F5) about 3% wide by 4% high with a bold black right-pointing chevron, one beside each list item: five in the left column at about x 3.0% and five in the right column at about x 52.0%, vertically centred on each row. Thin black horizontal rules (about 0.1% of slide height) separate the rows, four per column. No chart, table or photograph.
Slide 19
Results
19
J.P.Morgan
ASSET MANAGEMENT
Slide 20
Performance
JPMorgan Equity Income Strategy SMA as of September 30, 2025. Supplemental to annual performance report.
Market value
As of 9/2025
Equity Income Strategy
$76,606 mm
Annualized performance (%)
3Q 2025
YTD 2025
1 year
3 years
5 years
10 years
Since Inception (11/30/2002)
Equity Income SMA Composite (Gross)
5.46
12.04
9.89
14.66
13.48
11.87
10.86
Equity Income SMA Composite (Net of max. allowable fees – 300bps)*
4.66
9.51
6.59
11.22
10.07
8.52
7.53
Russell 1000 Value Index
5.33
11.65
9.44
16.96
13.88
10.72
9.16
Excess Returns (Gross)
0.13
0.39
0.45
-2.30
-0.40
1.15
1.70
Excess Returns (Net)
-0.67
-2.15
-2.85
-5.74
-3.80
-2.20
-1.63
Calendar year performance (%)
2010
2011
2012
2013
2014
2015
2016
2017
2018
2019
2020
2021
2022
2023
2024
Equity Income SMA Composite (Gross)
19.31
9.08
14.22
32.13
14.60
-1.14
15.94
18.29
-4.00
27.24
4.20
26.25
-1.23
5.33
13.02
Equity Income SMA Composite (Net of max. allowable fees – 300bps)*
15.91
5.90
10.94
28.47
11.31
-4.08
12.62
14.93
-6.88
23.42
1.10
22.46
-4.19
2.17
9.63
Russell 1000 Value Index
15.51
0.39
17.51
32.53
13.45
-3.83
17.34
13.66
-8.27
26.54
2.80
25.16
-7.53
11.46
14.37
Excess Returns (Gross)
3.80
8.69
-3.29
-0.40
1.15
2.69
-1.40
4.63
4.27
0.70
1.40
1.09
6.30
-6.13
-1.35
Excess Returns (Net)
0.40
5.51
-6.57
-4.06
-2.14
-0.25
-4.72
1.27
1.39
-3.12
-1.70
-2.70
3.34
-9.29
-4.74
Past performance is not a reliable indicator of current and future results. Performance includes the reinvestment of income. Please note, the “net of fee” composite performance returns is calculated using a model investment management fee. It is based on a representative fee applicable to institutional clients looking to invest in the strategy and it is higher or equal to the weighted average investment management fee of the underlying accounts within the composite at year end. Actual fees may be lower based on assets under management and other factors. Where fees are lower, “net of fees” performance returns will be higher. As such, “net of fees” performance for actual accounts may differ significantly from the “net of fees” performance shown above. Excess returns are calculated by subtracting the benchmark returns from the strategy returns. Source: J.P. Morgan Asset Management. Please see disclosure page for index definitions. *Please note, actual fees associated with this strategy may be lower. See Glossary for index of investment terms.
20
J.P.Morgan
ASSET MANAGEMENT
Visuals: Two data tables, no photographs, charts or icons. Table 1 (Market value): header row with columns 'Market value' and 'As of 9/2025'; one row 'Equity Income Strategy' with value '$76,606 mm'. Table 2 (Annualized performance): columns 'Annualized performance (%)', '3Q 2025', 'YTD 2025', '1 year', '3 years', '5 years', '10 years', 'Since Inception (11/30/2002)'; rows: Equity Income SMA Composite (Gross) 5.46, 12.04, 9.89, 14.66, 13.48, 11.87, 10.86; Equity Income SMA Composite (Net of max. allowable fees – 300bps)* 4.66, 9.51, 6.59, 11.22, 10.07, 8.52, 7.53; Russell 1000 Value Index 5.33, 11.65, 9.44, 16.96, 13.88, 10.72, 9.16; Excess Returns (Gross) 0.13, 0.39, 0.45, -2.30, -0.40, 1.15, 1.70 (bold); Excess Returns (Net) -0.67, -2.15, -2.85, -5.74, -3.80, -2.20, -1.63 (bold). Table 3 (Calendar year performance): header 'Calendar year performance (%)' then 2010 to 2024 as 15 columns; rows: Equity Income SMA Composite (Gross) 19.31, 9.08, 14.22, 32.13, 14.60, -1.14, 15.94, 18.29, -4.00, 27.24, 4.20, 26.25, -1.23, 5.33, 13.02; Equity Income SMA Composite (Net of max. allowable fees – 300bps)* 15.91, 5.90, 10.94, 28.47, 11.31, -4.08, 12.62, 14.93, -6.88, 23.42, 1.10, 22.46, -4.19, 2.17, 9.63; Russell 1000 Value Index 15.51, 0.39, 17.51, 32.53, 13.45, -3.83, 17.34, 13.66, -8.27, 26.54, 2.80, 25.16, -7.53, 11.46, 14.37; Excess Returns (Gross) 3.80, 8.69, -3.29, -0.40, 1.15, 2.69, -1.40, 4.63, 4.27, 0.70, 1.40, 1.09, 6.30, -6.13, -1.35 (bold); Excess Returns (Net) 0.40, 5.51, -6.57, -4.06, -2.14, -0.25, -4.72, 1.27, 1.39, -3.12, -1.70, -2.70, 3.34, -9.29, -4.74 (bold). Logo: J.P.Morgan wordmark in black serif with ASSET MANAGEMENT beneath in black sans caps.
Slide 21
Performance attribution – 3Q 2025
JPMorgan Equity Income Portfolio as of September 30, 2025
Benchmark
Russell 1000 Value Index
Stock: -0.35% | Sector: 0.21%
Top contributors
Relative
weight (%)
Impact (%)
Top detractors
Relative
weight (%)
Impact (%)
Seagate Technologies / 1.08 / 0.55 | Alphabet* / -2.75 / -0.91
Corning / 0.90 / 0.42 | JPMorgan Chase & Co¹* / -2.91 / -0.26
AbbVie / 1.25 / 0.30 | Fidelity National Information Services / 0.83 / -0.18
Norfolk Southern / 1.56 / 0.28 | Intel* / -0.37 / -0.17
General Dynamics / 1.55 / 0.25 | Micron Technology* / -0.50 / -0.17
Note: Stock attribution reflects net contribution vs. benchmark. Stock return displayed for whole period.
Sector attribution (%)
Stock Selection
Sector Allocation
0.9% 0.0% 0.2% 0.0% 0.2% 0.0% 0.1% 0.0% 0.1% 0.0% 0.0% 0.0% -0.1% 0.0% -0.1% 0.0% -0.1% 0.0% -0.1% 0.0% -0.4% -0.3%
Information Technology / Consumer Discretionary / Health Care / Utilities / Financials / Industrials / Real Estate / Consumer Staples / Energy / Materials / Communication Services
Past performance is no guarantee of future results. Source: J.P. Morgan Asset Management, Frank Russell Company, Wilshire Atlas (includes cash). ¹Due to regulatory reasons, the portfolio is unable to hold JPMorgan Chase & Co. The securities highlighted above have been selected based on their significance and are shown for illustrative purposes only. They are not recommendations. The portfolio is an actively managed. Holdings, sector weights, allocations and leverage, as applicable are subject to change at the discretion of the Investment Manager without notice. *Underweight relative to benchmark. Gross of fees. See Glossary for index of investment terms.
J.P.Morgan
ASSET MANAGEMENT
21
Visuals: Two data tables and one clustered column chart, plus a small benchmark label box, a stock/sector summary box, a J.P.Morgan wordmark logo, and divider rules. Top contributors table: columns Stock / Relative weight (%) / Impact (%); rows Seagate Technologies 1.08 0.55; Corning 0.90 0.42; AbbVie 1.25 0.30; Norfolk Southern 1.56 0.28; General Dynamics 1.55 0.25. Top detractors table: columns Stock / Relative weight (%) / Impact (%); rows Alphabet* -2.75 -0.91; JPMorgan Chase & Co¹* -2.91 -0.26; Fidelity National Information Services 0.83 -0.18; Intel* -0.37 -0.17; Micron Technology* -0.50 -0.17. Chart: clustered vertical bar chart titled Sector attribution (%), y-axis unlabelled with no printed scale (zero baseline is a black horizontal line), values printed above or below each bar, no axis ticks. Two series: Stock Selection in blue #0092F9 and Sector Allocation in amber #FFBE37, legend top-right of chart. Printed values by category (stock, sector): Information Technology 0.9%, 0.0%; Consumer Discretionary 0.2%, 0.0%; Health Care 0.2%, 0.0%; Utilities 0.1%, 0.0%; Financials 0.1%, 0.0%; Industrials 0.0%, 0.0%; Real Estate -0.1%, 0.0%; Consumer Staples -0.1%, 0.0%; Energy -0.1%, 0.0%; Materials -0.1%, 0.0%; Communication Services -0.4%, -0.3%. No highlighted points. Category labels sit under the zero line, two-line wrapped where needed. The J.P.Morgan logo is a serif wordmark with ASSET MANAGEMENT in sans-serif capitals beneath. No photographs.
Slide 22
Performance attribution – YTD 2025 / JPMorgan Equity Income Portfolio as of September 30, 2025 / Benchmark / Russell 1000 Value Index / Stock: 1.38% | Sector: -0.53% / Top contributors / Relative weight (%) / Impact (%) / Top detractors / Relative weight (%) / Impact (%) / Seagate Technologies / 0.96 / 1.21 / JPMorgan Chase & Co1* / -2.89 / -0.95 / Wells Fargo / 2.66 / 0.62 / Alphabet* / -0.94 / -0.88 / Charles Schwab / 1.75 / 0.56 / UnitedHealth / 0.68 / -0.56 / Corning / 0.70 / 0.54 / Micron Technology* / -0.45 / -0.37 / CVS / 1.03 / 0.53 / Berkshire Hathaway* / -3.49 / -0.36 / Note: Stock attribution reflects net contribution vs. benchmark. Stock return displayed for whole period. / Sector attribution (%) / 1.8% / Stock Selection / Sector Allocation / 0.1% / 0.5% / 0.0% / 0.6% / -0.1% / 0.1% 0.1% / 0.1% / -0.1% / 0.1% / -0.1% / 0.0% / -0.2% 0.0% / -0.2% / 0.0% / -0.3% / 0.0% / -0.3% / 0.0% / -0.7% / -0.5% / Information Technology / Consumer Staples / Health Care / Financials / Consumer Discretionary / Real Estate / Industrials / Utilities / Materials / Energy / Communication Services / Past performance is no guarantee of future results. Source: J.P. Morgan Asset Management, Frank Russell Company, Wilshire Atlas (includes cash). 1Average weight relative to the / Russell 1000 Value Index. 2Due to regulatory reasons, the portfolio is unable to hold JPMorgan Chase & Co. The securities highlighted above have been selected based on their significance / and are shown for illustrative purposes only. They are not recommendations. The portfolio is an actively managed. Holdings, sector weights, allocations and leverage, as applicable are / subject to change at the discretion of the Investment Manager without notice. *Underweight relative to benchmark. Gross of fees. See Glossary for index of investment terms. / 22 / J.P.Morgan / ASSET MANAGEMENT
Visuals: Two data tables and one clustered column chart. Left table: Top contributors, columns Relative weight (%) and Impact (%), header fill blue #0092F9 with white bold text, rows Seagate Technologies 0.96 / 1.21; Wells Fargo 2.66 / 0.62; Charles Schwab 1.75 / 0.56; Corning 0.70 / 0.54; CVS 1.03 / 0.53. Right table: Top detractors, same columns, header fill light grey #E2E4E5 with black bold text, rows JPMorgan Chase & Co1* -2.89 / -0.95; Alphabet* -0.94 / -0.88; UnitedHealth 0.68 / -0.56; Micron Technology* -0.45 / -0.37; Berkshire Hathaway* -3.49 / -0.36. Rows alternate white and #F5F7F8. Chart: clustered column chart titled Sector attribution (%), no axis lines or gridlines shown, data labels printed to one decimal place in percent. Series Stock Selection (blue #0092F9) and Sector Allocation (orange #FFBE37), legend top right. Values by sector, stock selection then sector allocation: Information Technology 1.8 / 0.1; Consumer Staples 0.5 / 0.0; Health Care 0.6 / -0.1; Financials 0.1 / 0.1; Consumer Discretionary 0.1 / -0.1; Real Estate -0.1 / 0.1; Industrials -0.2 / 0.0; Utilities -0.2 / 0.0; Materials -0.3 / 0.0; Energy -0.3 / 0.0; Communication Services -0.7 / -0.5. Zero baseline is a black horizontal line. No point is highlighted. Small cyan box shows Stock: 1.38% | Sector: -0.53%. Logo: J.P.Morgan serif wordmark with ASSET MANAGEMENT caption in bottom right corner.
Slide 23
Executive summary
JPMorgan Equity Income Strategy as of June 30, 2025
Expertise
Portfolio
Results
Experienced team coupled with
proprietary insights from our
seasoned research group
Bottom-up stock selection
targeting high quality U.S.
companies at attractive valuations
Our investment approach has
delivered strong and consistent
risk-adjusted returns over time
● Experienced investment team
averaging 30 years of industry
experience
● Supported by the expertise of three
dedicated analysts
● Leveraging the fundamental insights of
a team of over 20 U.S. Equity career
analysts averaging over 25 years of
industry experience
● Targets quality companies with
consistent earnings, strong
management teams and a healthy
dividend yield
● Fundamental bottom-up approach
to stock selection that is not
benchmark driven
● Fully invested with cash <5%
● No derivatives or options used in
the portfolio
● Has generated top quartile performance
and bottom decile volatility since
inception*
● Attractive combination of performance
and less exposure to the downside
● Dividend yield enhances the portfolio’s
total return
Past performance is not a reliable indicator of current and future results.
Source: J.P. Morgan Asset Management. eVestment. Data as of 6/30/2025. The J.P. Morgan Equity Income Strategy was ranked in the eVestment Large Cap Value Universe. The
eVestment ranking is a percentile ranking based on the strategy’s return and standard deviation (gross of fees). *Inception 11/30/2002. Statistics are computed using monthly data. Equity
Income was ranked against the following number of institutional products in the eVestment Large Cap Value. Excess Return: 23rd percentile / 172 observations. Standard Deviation: 9th
percentile / 172 observations. See Glossary for index of investment terms.
J.P.Morgan
ASSET MANAGEMENT
23
Visuals: Three blue flat icons, one above each column heading. Left: a people icon with one solid blue head and blue semicircle body in the centre, flanked by two outlined smaller figures with thin black outlines, occupying about 5.3% to 11.3% of width and 20.8% to 27.2% of height. Centre: a solid blue folder with a thin black outline on its tab and right edge, about 37.5% to 43.3% of width and 20.8% to 27.2% of height. Right: a black-outlined line chart frame (vertical and horizontal axis lines forming an L) with three solid blue bars of ascending height and a black arrow rising diagonally from the bottom-left to the upper-right, about 69.2% to 75.2% of width and 20.4% to 26.8% of height. No photographs, charts or tables.
Slide 24
Appendix / 24 / J.P.Morgan / ASSET MANAGEMENT
Visuals: none. Apart from the rules, the logo lockup at bottom right is the only non-text graphic: the J.P.Morgan wordmark in a serif typeface with the words ASSET MANAGEMENT beneath it in small sans-serif capitals.
Slide 25
Equity Income outperformed ALL drawdowns of 10% or more
Equity Incomes rolling 1-year returns in periods where the Russell 1000 Value is down 10% or more
Excess return
15%
10%
9%
9%
8%
7%
7%
6%
10%
6%
6%
6%
Average outperformance =
5%
5%
5.2%
4%
3%
3%
3%
3%
3%
2%
0%
0%
5%
0%
May-08 Jun-08 Jul-08 Aug-08 Sep-08 Oct-08 Nov-08 Dec-08 Jan-09 Feb-09 Mar-09 Apr-09 May-09 Jun-09 Jul-09 Aug-09 Sep-09 Mar-20 Apr-20 Sep-22
Source: J.P. Morgan Asset Management. Since PM inception Date: 12/31/2004. Net of fees. As of 9/30/2025. Data reflects rolling 1 year returns for Equity Income
(HLIEX) and the Russell 1000 Value. Past performance is not a reliable indicator of current and future results. See Glossary for index of investment terms.
J.P.Morgan
ASSET MANAGEMENT
25
Visuals: Chart: vertical bar chart, single series titled Excess return, legend marker a small blue square placed above the plot. Y-axis 0% to 15% with ticks at 0%, 5%, 10% and 15%, no axis title, tick labels in black Arial. X-axis is categorical with month labels May-08 through Sep-22 (20 categories), no axis title. Bars are solid blue #0092F9 with no outline, evenly spaced with narrow gaps. Value labels above each bar: May-08 2%, Jun-08 3%, Jul-08 3%, Aug-08 3%, Sep-08 5%, Oct-08 6%, Nov-08 7%, Dec-08 7%, Jan-09 9%, Feb-09 10%, Mar-09 9%, Apr-09 8%, May-09 6%, Jun-09 6%, Jul-09 5%, Aug-09 3%, Sep-09 0%, Mar-20 4%, Apr-20 3%, Sep-22 6%. Reference line: horizontal dashed orange line (about #E87722, stroke about 0.4% of slide height, dash length about 1.5% of width) at the 5.2% level, spanning from the Sep-08 bar area to the Sep-22 bar. Callout: rectangle with thin dashed orange border (#E87722) and no fill containing bold black text Average outperformance = (line break) 5.2%, placed in the upper right of the plot over the Jul-09 to Sep-22 area with its bottom edge just above the dashed line. Highlighted point: none beyond the dashed reference line. Bars are not cropped and no gridlines are shown.
Slide 26
Dividend sustainability is critical / Dividend Yield and Dividend Growth Rate of Equity Income vs Russell 1000 Value Index – Trailing Twelve Months / Higher dividend yield / Gross Dividend Yield / 3% / 2.3% / 2% / 1% / 0% / Equity Income / Russell 1000 Value / Index / 1.5% / Consistent dividend growth / Trailing 12 Month Dividend Growth / 7% / 6% / 5% / 4% / 3% / 2% / 1% / 0% / 4.9% / 6.1% / Equity Income / Russell 1000 Value / Index / More dividend increases / Trailing 12 Month Dividend Increase** / 90% / 80% / 70% / 60% / 50% / 40% / 30% / 20% / 10% / 0% / 80% / 52% / Equity Income / Russell 1000 Value / Index / Source: J.P. Morgan Asset Management, Factset. As of September 30, 2025. Dividend yield is calculated by taking the sum-total dividend yield of each stock held in the portfolio. The dividend yield for each / stock is the most recent dividend payout annualised and divided by the share price. Dividend growth calculates the annualized average rate of increase in the dividends paid by stock held in the portfolio. / **Refer to dividend increase during the time period as a percentage of holdings. ***Refer to dividend cuts and suspensions during the time period as a percentage of holdings. The Equity Income Fund and the / Russell 1000 Value Index dividend yield and dividend growth rates are calculated in the same manner. For illustrative purposes only. Yield is not guaranteed and may change over time. See Glossary for / index of investment terms. / 26 / J.P.Morgan / ASSET MANAGEMENT
Visuals: Three vertical bar charts side by side, each with a bold heading and a regular subtitle giving the measure. Chart 1 'Higher dividend yield', Gross Dividend Yield, y-axis 0% to 3% in 1% steps with light grey horizontal gridlines at each step and black axis lines; bars: Equity Income 2.3% (blue #0092F9, labelled 2.3%), Russell 1000 Value Index 1.5% (grey #C5C7C9, labelled 1.5%); category labels below the x-axis. Chart 2 'Consistent dividend growth', Trailing 12 Month Dividend Growth, y-axis 0% to 7% in 1% steps with light grey gridlines; bars: Equity Income 4.9% (amber #FFBE37, labelled 4.9%), Russell 1000 Value Index 6.1% (grey #C5C7C9, labelled 6.1%). Chart 3 'More dividend increases', Trailing 12 Month Dividend Increase**, y-axis 0% to 90% in 10% steps with light grey gridlines; bars: Equity Income 80% (green #00A16D, labelled 80%), Russell 1000 Value Index 52% (grey #C5C7C9, labelled 52%). No legend; each chart's categories are printed beneath its bars. No highlighted points beyond the coloured Equity Income bars. Logo: J.P.Morgan wordmark in serif type with ASSET MANAGEMENT in spaced capitals beneath.
Slide 27
Dividend Yield Over Time
What share of companies have >=2% dividend yield over time?
Stocks with Dividend Yield >=2% Over Time
80%
70%
LT Average = 57%
60%
% of Russell 1000 Value Index
50%
40%
Dividend Yield >=2%
LT Average
30%
2004
2008
2012
2016
2020
2024
Source: JPM Asset Management, Factset, MSCI Barra. Data as of 6/30/2025.Reflects weight in Russell 1000 Value Index There is no guarantee that companies that can
issue dividends will declare, continue to pay, or increase dividends. See Glossary for index of investment terms.
J.P.Morgan
ASSET MANAGEMENT
27
Visuals: Chart: filled area chart titled Stocks with Dividend Yield >=2% Over Time. Y axis titled % of Russell 1000 Value Index, range 30% to 80% with labelled ticks at 30%, 40%, 50%, 60%, 70%, 80%. X axis runs 2004 to about 2025 with labelled ticks at 2004, 2008, 2012, 2016, 2020, 2024. Series 1, Dividend Yield >=2%, is a solid blue area filled from the 30% baseline up to the monthly line; it peaks at about 78% around 2008, about 73% around 2015 and 2019, and bottoms at about 40% around 2020 and about 41% around 2024 (values are estimates, the slide prints none). Series 2, LT Average, is a horizontal gold line at 57%, labelled LT Average = 57% in gold bold text placed inside the blue area around 2017 to 2019. No points are individually highlighted beyond the labelled average. Legend below the x axis: blue square labelled Dividend Yield >=2% and gold line labelled LT Average. Logo: J.P.Morgan wordmark in a serif typeface with ASSET MANAGEMENT in small caps sans-serif below it, black, at bottom right.
Slides 28 to 38 continue in the full text file.
Download this deck
The hosted PDF of every library deck is free for readers of the SlideDeck Co newsletter. Join with your email and the viewer and download appear here.
Raising or reporting on a fund of your own? The SlideDeck Co Private Equity Deck is a slide library for fund presentations, with a worked fund case.