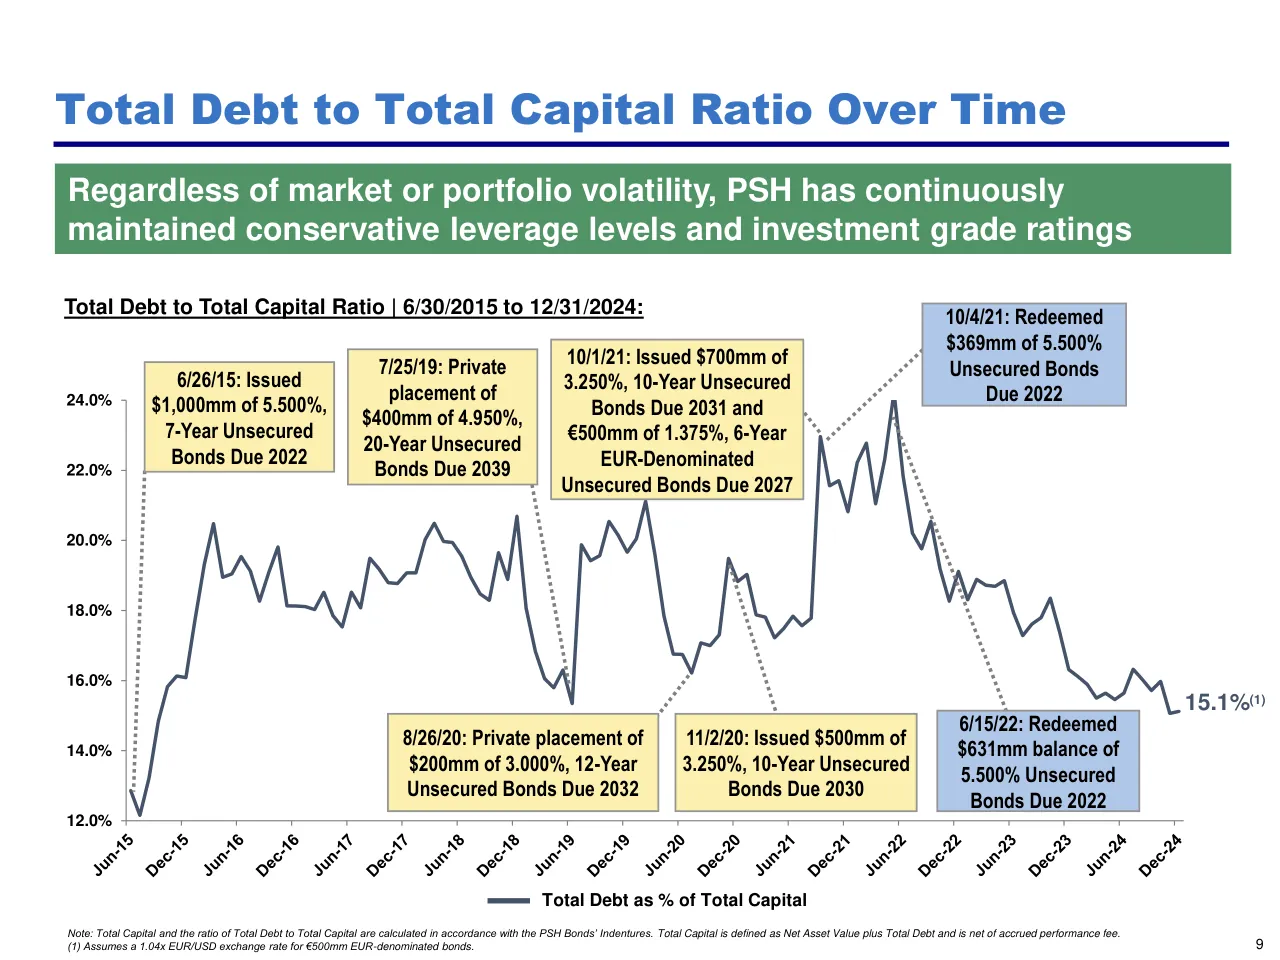
The deck is the annual investor presentation for Pershing Square Holdings, Ltd. (PSH), dated February 11, 2025. It opens with a title slide and a long disclaimer on performance, risk and the limits of the analysis. The agenda then runs through a chairman's introduction, the board of directors and its process, and a strategic update covering the debt financing strategy, performance against the discount to NAV, the PSCM stake sale, the postponed PSUS IPO, and a proposed transaction with Howard Hughes Holdings. A 2024 performance review follows, with long-run return tables, a contributors and detractors breakdown, and assets under management. The business update covers market concentration, index inclusion and the investment team. The equity portfolio section closes the deck with one slide per major holding. Slides worth studying include the debt maturity and leverage chart, the net-return comparison tables, and the contributors and detractors tables, which show how gross and net figures are set side by side.
Slides worth studying
Questions about this deck
What does Pershing Square Holdings, Ltd. say about its long-term debt financing strategy in the investor presentation?
Slide 8 says PSH's ability to access low-cost, investment grade, long-term debt is an important competitive advantage, with laddered maturities from 2027 to 2039 and a weighted-average maturity of 7 years. It also gives a weighted-average cost of capital of 3.1%.
How many slides are in the Pershing Square Holdings, Ltd. annual investor presentation, and how is it structured?
The deck has 75 slides. Per slide 3's agenda, it runs from a title slide and disclaimer through the chairman's introduction, the board of directors, a strategic update, the 2024 PSH performance review, the business and organizational update, and the equity portfolio update.
What were Pershing Square Holdings, Ltd.'s 2024 NAV and total shareholder return figures according to the deck?
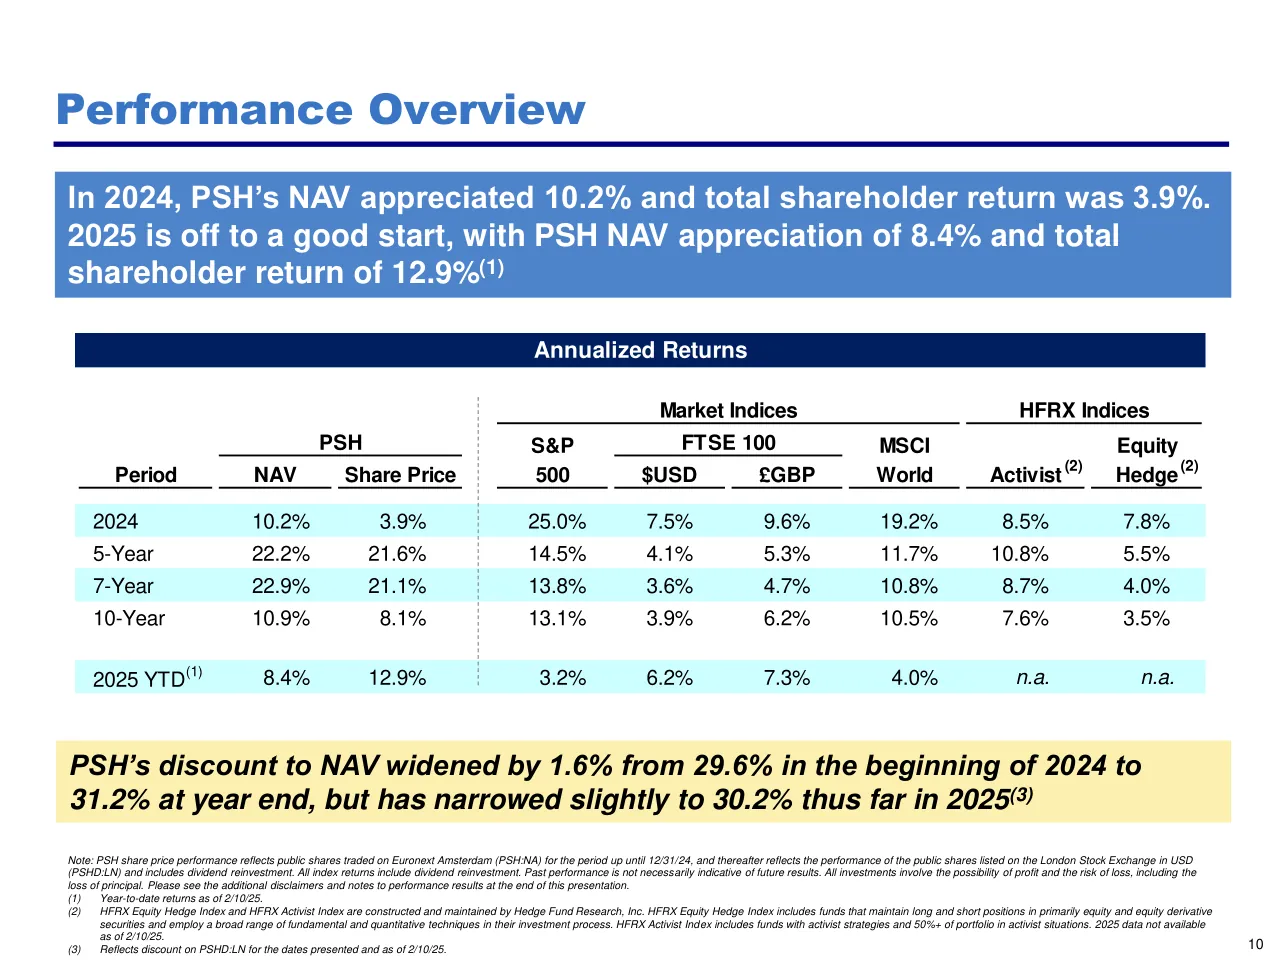
Slide 10 states that in 2024, PSH's NAV appreciated 10.2% and total shareholder return was 3.9%. The same slide shows the 2025 year-to-date NAV appreciation of 8.4% and total shareholder return of 12.9% as of 2/10/25.
What does Pershing Square Holdings, Ltd. report about the PSCM stake sale?
Slide 13 says that on June 3, 2024, PSCM announced the sale of a 10% primary common equity interest for $1.05 billion to a consortium of strategic investors. It also states that the transaction has no impact on PSCM's management team and its role in managing PSH.
Details
- Company: Pershing Square Holdings, Ltd.
- Year: 2025
- Type: Fund presentation
- Industry: Investment management
- Pages: 75
More from Pershing Square
All Pershing Square decks in the library
Review score: 7 out of 10, Effective
Presentation quality, judged with the SlideDeck Co review heuristic. Ask, evidence and idea merit are not rated here.
The deck has a clear, repeatable structure: a colored agenda, section dividers, and nearly every content slide opens with a full-sentence takeaway banner above a chart or table (slides 9, 10, 15, 32 to 36). The charts are legible, annotated at the key events, and the performance tables are tidy, so an investor audience can follow the strategic update, the return story and each holding. The weaknesses are consequential, though: dense text-heavy slides (5, 17, 45, 49, 68, 71), very small footnotes, cramped org chart (42) and annotation clutter on the long share-price charts (46, 55, 62, 66), and a plain title slide and sparse dividers. The color-coded banners (blue, green, red) do not carry a consistent meaning, and the tone is documentary rather than designed.
Worth keeping: Keep the sentence-style takeaway banner above each chart, the yellow callout for the closing conclusion, and the annotated timeline charts such as slide 9 and slide 15.
Most useful repair: Cut the text on dense slides like 5, 17 and 68 to fewer lines, and enlarge or restructure the org chart on slide 42 so names are readable.
What would change the score: I would give the title slide and section dividers real visual weight and use banner colors with one consistent meaning, so the deck has a stronger identity and rhythm.
Confidence high. 72 of 75 pages inspected on contact sheets, 4 at readable size. Reviewed 2026-11-08. Model-assisted review (claude-sonnet-5-5).
Full text of the slides (75 slides)
Every slide's words and a description of its charts and images, so the deck can be searched and rebuilt. Also available as Markdown.
Slide 1
Annual Investor Presentation
February 11, 2025
Visuals: One logo: the Pershing Square Holdings logo at lower left, consisting of a dark navy (#003A63) rounded square containing a white stylised 'PS' monogram made of interlocking bars, with the words 'Pershing / Square / Holdings' set to the right in navy regular sans-serif type on three lines. No photographs, charts or other graphics.
Slide 2
Disclaimer
All information provided herein is for informational purposes only and should not be deemed a recommendation to buy or sell any security mentioned. Pershing Square Capital Management, L.P. (“Pershing Square”) believes this presentation contains a balanced presentation of the performance of the portfolio it manages, including a general summary of certain portfolio holdings that have both over and under performed its expectations.
This presentation contains information and analyses relating to all of the publicly disclosed positions representing over 50 basis points in the portfolio of Pershing Square Holdings, Ltd. (“PSH” or the “Company”) during 2024. Pershing Square may currently or in the future buy, sell, cover or otherwise change the form of its investments discussed in this presentation for any reason. Pershing Square hereby disclaims any duty to provide any updates or changes to the information contained herein including, without limitation, the manner or type of any Pershing Square investment.
Past performance is not necessarily indicative of future results. All investments involve risk including the loss of principal. It should not be assumed that any of the transactions or investments discussed herein were or will prove to be profitable, or that the investment recommendations or decisions we make in the future will be profitable or will equal the investment performance of the investments discussed herein. Specific companies or investments shown in this presentation are meant to demonstrate Pershing Square’s active investment style and the types of industries and instruments in which we invest and are not selected based on past performance.
The analyses and conclusions of Pershing Square contained in this presentation are based on publicly available information. Pershing Square recognizes that there may be confidential or otherwise non-public information in the possession of the companies discussed in the presentation and others that could lead these companies to disagree with Pershing Square’s conclusions. The analyses provided include certain statements, assumptions, estimates and projections prepared with respect to, among other things, the historical and anticipated operating performance of the companies. Such statements, assumptions, estimates, and projections reflect various assumptions by Pershing Square concerning anticipated results that are inherently subject to significant economic, competitive, legal, regulatory, and other uncertainties and contingencies and have been included solely for illustrative purposes. No representations, express or implied, are made as to the accuracy or completeness of such statements, assumptions, estimates or projections or with respect to any other materials herein. Any forward-looking statement contained in this presentation is subject to various risks and uncertainties. See also “Forward-Looking Statements” in Additional Disclaimers and Notes to Performance Results at the end of this presentation. All trademarks included in this presentation are the property of their respective owners.
This document may not be distributed without the express written consent of Pershing Square and does not constitute an offer to sell or the solicitation of an offer to purchase any security or investment product. This presentation is expressly qualified in its entirety by reference to PSH’s prospectus, Annual Report, and Semiannual Financial Statements Including Investment Manager’s Report, which includes discussions of certain specific risk factors, tax considerations, fees and other matters, and its other governing documents.
SEE ADDITIONAL DISCLAIMERS AND NOTES TO PERFORMANCE RESULTS AT THE END OF THIS PRESENTATION FOR ADDITIONAL IMPORTANT INFORMATION
2
Visuals: None apart from a single horizontal navy rule (solid bar, about 0.5% of slide height thick, spanning from about 4.2% to 96% of slide width) that sits directly under the title, roughly 5% below the title baseline.
Slide 3
Agenda
Chairman’s Introduction
Strategic Update
2024 PSH Performance Review
Business & Organizational Update
Equity Portfolio Update
Q&A
Slide 4
Chairman’s Introduction
Slide 5
Board of Directors of PSH / Board Director / Summary Experience / Rupert Morley / Independent Director / Chairman of the Board / Chairman of the Board, Bremont Watch Company / Trustee and Chairman of investment advisory group, Comic Relief / Trustee, Kennedy Memorial Trust / Former CEO of Sterling Relocation, Hamptons Estate Agency, and Propertyfinder.co.uk / Former Director of Thistle Hotels, English Welsh & Scottish Railways, and Graham-Field Health Products / Bronwyn Curtis, OBE / Senior Independent Director / Chairman, TwentyFour Income Fund; Senior Independent Director, BH Macro; Director, Mercator Media / Trustee, Centre for Economic Policy Research / Former Chairman, UK Office for Budget Responsibility Oversight Board / Former Governor, London School of Economics / Former Head of Global Research, HSBC and Former Head of European Broadcast, Bloomberg LP / Halit Coussin / Director / Chief Legal Officer, the Investment Manager / Chief Compliance Officer, the Investment Manager / Director, Pershing Square Holdco GP, LLC / Schulte, Roth & Zabel LLP / Charlotte Denton / Independent Director / Director and Audit Chair, Starwood European Real Estate Finance / Director and Chair, Alpha Real Capital; Director, Cinven, Hitec, and Next Energy Investment Manager / Former Director, Butterfield Bank (Guernsey) Ltd / KPMG, Rothschild, Northern Trust / Andrew Henton / Independent Director / Chairman of the Board, Onward Opportunities Ltd, SW7 Holdings Ltd, and Utmost Worldwide Limited / Director, TaDaweb S.A., Longview Partners (Guernsey) Ltd, and Butterfield Bank Guernsey Limited / Former Chairman of the Board, Boussard & Gavaudan Holding Ltd / Former Director, St John Ambulance, Guernsey / Tope Lawani / Independent Director / Co-Founder and Managing Partner, Helios Investment Partners / Co-CEO and Director, Helios Fairfax Partners Corp (TSX:HFPC) / Director, Helios Towers plc, NBA Africa, Professional Fighters League Africa, and The END Fund / Member, MIT Corporation (Massachusetts Institute of Technology’s board of trustees) / Member, Harvard Law School Dean’s Advisory Board / Halit Coussin and Charlotte Denton joined the Board of Directors while Rupert Morley became Chairman of the Board in 2024 / 5
Visuals: Table with two header cells: Board Director and Summary Experience, on a blue #3A75C4 band. Six body rows, one per director, each with a head-and-shoulders portrait photo in the left cell. Rupert Morley: smiling man with grey hair in a dark suit and white shirt against a plain grey backdrop. Bronwyn Curtis: smiling woman with blonde hair in a red jacket against a light grey backdrop. Halit Coussin: smiling woman with long dark hair in a dark top against a light backdrop. Charlotte Denton: woman with long wavy auburn hair in a light top against a pale backdrop. Andrew Henton: smiling older man with grey hair in a dark suit and tie, slightly angled. Tope Lawani: man with short dark hair in a dark suit against a light grey backdrop. Photos are soft, evenly lit studio portraits, cropped to rectangles about 5 to 6% of slide width, not full-bleed, with no overlay or tint. Each row has a dash-bulleted list of experience. No charts, logos or icons.
Slide 6
PSH Board Process
Quarterly meetings; additional meetings as needed
Review and monitor
Investment performance and portfolio
Operational risk management
Investor relations
Share price performance
Expenses
Regulatory matters
Board Committees (membership limited to independent directors
except for risk and nomination committees)
Audit Committee
Management Engagement Committee
Nomination Committee
Remuneration Committee
Risk Committee
Additional matters
6
Slide 7
PSH Board Additional Matters Considered in 2024
Share buybacks
Dividend policy
Debt strategy
Fee-related amendments to the Investment Management Agreement
Pershing Square Capital Management, L.P. (“PSCM”) stake sale
Pershing Square USA, Ltd. (“PSUS”)
UK fee disclosure forbearance
Euronext Amsterdam listing
Strategies for addressing discount to NAV
7
Slide 8
Long-Term Debt Financing Strategy
PSH’s ability to access low-cost, investment grade, long-term debt is an
important competitive advantage for PSH
✓
PSH has attractive credit characteristics
Simple, transparent and highly liquid investment portfolio
Significant asset coverage: PSH debt is covered 6.6x by total assets(1)
Underlying portfolio companies are diversified across industries and have relatively
low commodity exposure and cyclical risk
Proven investment strategy with a long-term track record
Facilitates opportunistic issuances
✓
Laddered maturities from 2027 to 2039 are well matched with PSH’s
long-term investment horizon
Weighted-average maturity of 7 years; weighted-average cost of capital of 3.1%
✓
No margin leverage
✓
No mark-to-market covenants
(1) Total Assets is defined as Net Asset Value plus Total Debt as of 12/31/24.
8
Visuals: None apart from the text hierarchy: green Wingdings check-mark glyphs (#509467) mark the top-level items, and blue square Wingdings2 bullets (#3A75C4) mark the sub-items. The one superscript footnote marker (1) follows the 6.6x sentence.
Slide 9
Total Debt to Total Capital Ratio Over Time
Regardless of market or portfolio volatility, PSH has continuously
maintained conservative leverage levels and investment grade ratings
Total Debt to Total Capital Ratio | 6/30/2015 to 12/31/2024:
10/4/21: Redeemed
$369mm of 5.500%
Unsecured Bonds
Due 2022
10/1/21: Issued $700mm of
3.250%, 10-Year Unsecured
Bonds Due 2031 and
€500mm of 1.375%, 6-Year
EUR-Denominated
Unsecured Bonds Due 2027
7/25/19: Private
placement of
$400mm of 4.950%,
20-Year Unsecured
Bonds Due 2039
6/26/15: Issued
$1,000mm of 5.500%,
7-Year Unsecured
Bonds Due 2022
24.0%
22.0%
20.0%
18.0%
16.0%
14.0%
12.0%
Jun-15 Dec-15 Jun-16 Dec-16 Jun-17 Dec-17 Jun-18 Dec-18 Jun-19 Dec-19 Jun-20 Dec-20 Jun-21 Dec-21 Jun-22 Dec-22 Jun-23 Dec-23 Jun-24 Dec-24
15.1%(1)
6/15/22: Redeemed
$631mm balance of
5.500% Unsecured
Bonds Due 2022
8/26/20: Private placement of
$200mm of 3.000%, 12-Year
Unsecured Bonds Due 2032
11/2/20: Issued $500mm of
3.250%, 10-Year Unsecured
Bonds Due 2030
Total Debt as % of Total Capital
Note: Total Capital and the ratio of Total Debt to Total Capital are calculated in accordance with the PSH Bonds’ Indentures. Total Capital is defined as Net Asset Value plus Total Debt and is net of accrued performance fee.
(1) Assumes a 1.04x EUR/USD exchange rate for €500mm EUR-denominated bonds.
9
Visuals: One line chart titled 'Total Debt to Total Capital Ratio | 6/30/2015 to 12/31/2024:'. Y-axis: 'Total Debt to Total Capital' ratio in percent, linear, ticks labelled 12.0%, 14.0%, 16.0%, 18.0%, 20.0%, 22.0%, 24.0%, range 12% to 24%. X-axis: quarterly-to-semiannual time from Jun-15 to Dec-24, labels every six months (Jun-15, Dec-15, Jun-16, Dec-16, Jun-17, Dec-17, Jun-18, Dec-18, Jun-19, Dec-19, Jun-20, Dec-20, Jun-21, Dec-21, Jun-22, Dec-22, Jun-23, Dec-23, Jun-24, Dec-24), labels rotated about 45 degrees. Series: one dark slate-blue line labelled 'Total Debt as % of Total Capital', about 2.25% of slide height thick, no markers. No values are printed except the final point, 15.1% at Dec-24 (with footnote marker (1)). Estimated values from the line: about 12.9% at Jun-15, about 12.2% just after, about 15.8% at Dec-15, about 20.5% at Jun-16, about 18.2% at Dec-16, about 20.5% at Jun-18, about 18.3% at Dec-18, about 15.3% at Jun-19, about 19.9% at Dec-19, about 21.2% near Jun-20 region before dropping, about 16.8% at Jun-20, about 19.5% at Dec-20, about 17.2% at Jun-21, about 23.0% at Dec-21, about 24.0% at Jun-22 (the peak), about 18.3% at Dec-22, about 18.3% near Jun-23, about 16.3% at Dec-23, about 15.5% at Jun-24, about 16.3% near Aug-24, and 15.1% at Dec-24. Legend: single entry, a short dark slate line swatch followed by 'Total Debt as % of Total Capital', centred below the x-axis. Highlighted points: seven callout boxes, each joined to its point by a grey dotted leader line. Five yellow callouts (6/26/15, 7/25/19, 10/1/21, 8/26/20, 11/2/20) and two blue callouts (10/4/21 and 6/15/22). Gridlines: none. Axis lines: thin grey vertical and horizontal axis lines.
Slide 10
Performance Overview
In 2024, PSH’s NAV appreciated 10.2% and total shareholder return was 3.9%.
2025 is off to a good start, with PSH NAV appreciation of 8.4% and total
shareholder return of 12.9%(1)
Annualized Returns
Market Indices
HFRX Indices
PSH
S&P
FTSE 100
MSCI
Equity
Period
NAV
Share Price
500
$USD
£GBP
World
Activist(2)
Hedge(2)
2024 10.2% 3.9% 25.0% 7.5% 9.6% 19.2% 8.5% 7.8%
5-Year 22.2% 21.6% 14.5% 4.1% 5.3% 11.7% 10.8% 5.5%
7-Year 22.9% 21.1% 13.8% 3.6% 4.7% 10.8% 8.7% 4.0%
10-Year 10.9% 8.1% 13.1% 3.9% 6.2% 10.5% 7.6% 3.5%
2025 YTD(1) 8.4% 12.9% 3.2% 6.2% 7.3% 4.0% n.a. n.a.
PSH’s discount to NAV widened by 1.6% from 29.6% in the beginning of 2024 to
31.2% at year end, but has narrowed slightly to 30.2% thus far in 2025(3)
Note: PSH share price performance reflects public shares traded on Euronext Amsterdam (PSH:NA) for the period up until 12/31/24, and thereafter reflects the performance of the public shares listed on the London Stock Exchange in USD (PSHD:LN) and includes dividend reinvestment. All index returns include dividend reinvestment. Past performance is not necessarily indicative of future results. All investments involve the possibility of profit and the risk of loss, including the loss of principal. Please see the additional disclaimers and notes to performance results at the end of this presentation.
(1) Year-to-date returns as of 2/10/25.
(2) HFRX Equity Hedge Index and HFRX Activist Index are constructed and maintained by Hedge Fund Research, Inc. HFRX Equity Hedge Index includes funds that maintain long and short positions in primarily equity and equity derivative securities and employ a broad range of fundamental and quantitative techniques in their investment process. HFRX Activist Index includes funds with activist strategies and 50%+ of portfolio in activist situations. 2025 data not available as of 2/10/25.
(3) Reflects discount on PSHD:LN for the dates presented and as of 2/10/25.
10
Visuals: One data table, titled Annualized Returns on a navy #002060 bar with white bold text. Column groups: Period (label column); PSH with sub-columns NAV and Share Price; Market Indices with sub-columns S&P 500, FTSE 100 (sub-columns $USD and £GBP), and MSCI World; HFRX Indices with sub-columns Activist(2) and Equity Hedge(2). Rows: 2024 with values 10.2% (NAV), 3.9% (Share Price), 25.0% (S&P 500), 7.5% ($USD), 9.6% (£GBP), 19.2% (MSCI World), 8.5% (Activist), 7.8% (Equity Hedge). 5-Year with 22.2%, 21.6%, 14.5%, 4.1%, 5.3%, 11.7%, 10.8%, 5.5%. 7-Year with 22.9%, 21.1%, 13.8%, 3.6%, 4.7%, 10.8%, 8.7%, 4.0%. 10-Year with 10.9%, 8.1%, 13.1%, 3.9%, 6.2%, 10.5%, 7.6%, 3.5%. A blank spacer row, then 2025 YTD(1) with 8.4%, 12.9%, 3.2%, 6.2%, 7.3%, 4.0%, n.a., n.a. (the two n.a. entries in italics). Alternate rows 2024, 7-Year and 2025 YTD are shaded light cyan #CCFFFF; 5-Year and 10-Year are white. No chart, photograph, logo or icon.
Slide 11
Strategies to Address the Discount
Strong investment performance
Compound annual NAV net returns of 22.9% for the last seven years(1)
Global marketing efforts outside of the United States
Inclusion of PSH in the FTSE 100 index in December 2020. Now the 53rd largest company by market capitalization(2)
AIC reclassification from Hedge Funds to U.S. Equity
Retained Cadarn Capital for increased UK/European/Asian distribution and LodeRock Advisors for increased Canadian distribution
Corporate actions
Gained premium listing on the London Stock Exchange in May 2017
Initiated quarterly dividend in Q1 2019. Revised dividend policy in Q2 2022 whereby dividends now increase with NAV
Quarterly dividend is now $0.1646 per share, a 65% increase from $0.10 per share in 2019
PSH has repurchased 68 million shares, representing 27.4% of initial shares outstanding, at an average price of $22 and average discount to NAV of 29%(3)
In 2024, PSH repurchased 2.5 million shares at an average price of $47 and average discount to NAV of 31%
PSCM affiliates have accumulated a 27% ownership stake through outright purchases(4)
The board continues to believe that the most powerful driver of long-term shareholder returns will be continued strong absolute and relative NAV performance
Past performance is not necessarily indicative of future results. All investments involve the possibility of profit and the risk of loss, including the loss of principal. Please see the additional disclaimers and notes to performance results at the end of this presentation.
(1) The 1-year, 5-year, and 10-year compound annual NAV net returns for PSH were 10.2%, 22.2%, and 10.9%, respectively. See slide 10 for further details.
(2) FTSE 100 companies ranked by market capitalization as of 2/10/25.
(3) Initial shares outstanding reflect public and management shares outstanding as of 4/30/17. Repurchase data as of 2/10/25.
(4) Ownership percentage based on current shares outstanding. Includes Pershing Square employees and affiliates.
11
Visuals: none. Decorative elements only: a navy horizontal rule under the title, blue triangle bullets (Wingdings3) for level-1 items, blue square bullets (Wingdings2) for level-2 items, and a pale yellow highlight box behind the closing statement. No charts, photographs, logos or icons.
Slide 12
Strategic Update
Slide 13
PSCM Stake Sale
On June 3, 2024, PSCM announced the sale of a 10% primary common equity interest for $1.05 billion to a consortium of strategic investors
Transaction has no impact on PSCM’s management team and its role in managing PSH
PSCM’s obligations under the Investment Management Agreement will be unchanged
Proceeds from the stake sale will be used to anchor new strategies or fund launches, which could benefit PSH by reducing the performance fees that it pays
The amended Fee Offset Arrangement allows PSH to receive an additional fee reduction from 20% of management fees earned on any Pershing Square funds that invest in public securities which do not charge performance fees(1)
PSH will continue to receive a fee reduction from 20% of performance fees earned on non-PSH investment funds managed by PSCM that invest in public securities which do charge performance fees(1)
PSCM intends to launch new investment funds which could substantially reduce PSH performance fees over time
(1) Subject to certain exceptions.
13
Visuals: Four non-photographic shapes: (1) a solid green rectangle, fill #509467, no outline, square corners, no shadow, spanning x 4.3% to 96.2% and y 78.0% to 88.5%, placed behind the white text it holds. (2) A dark navy horizontal rule, about 0.5% of slide height thick, colour #000080, square ends, running under the title across the full content width. (3) Three solid blue right-pointing triangle glyphs (Wingdings3), colour #3A75C4, one beside each level-1 bullet at x 5.9%, y 19.0%, 29.5% and 45.2%. (4) Three small solid blue square glyphs (Wingdings2), colour #3A75C4, one beside each level-2 bullet at x 10.3%, y 38.9%, 54.7% and 66.3%. No charts, tables, photographs, logos or icons.
Slide 14
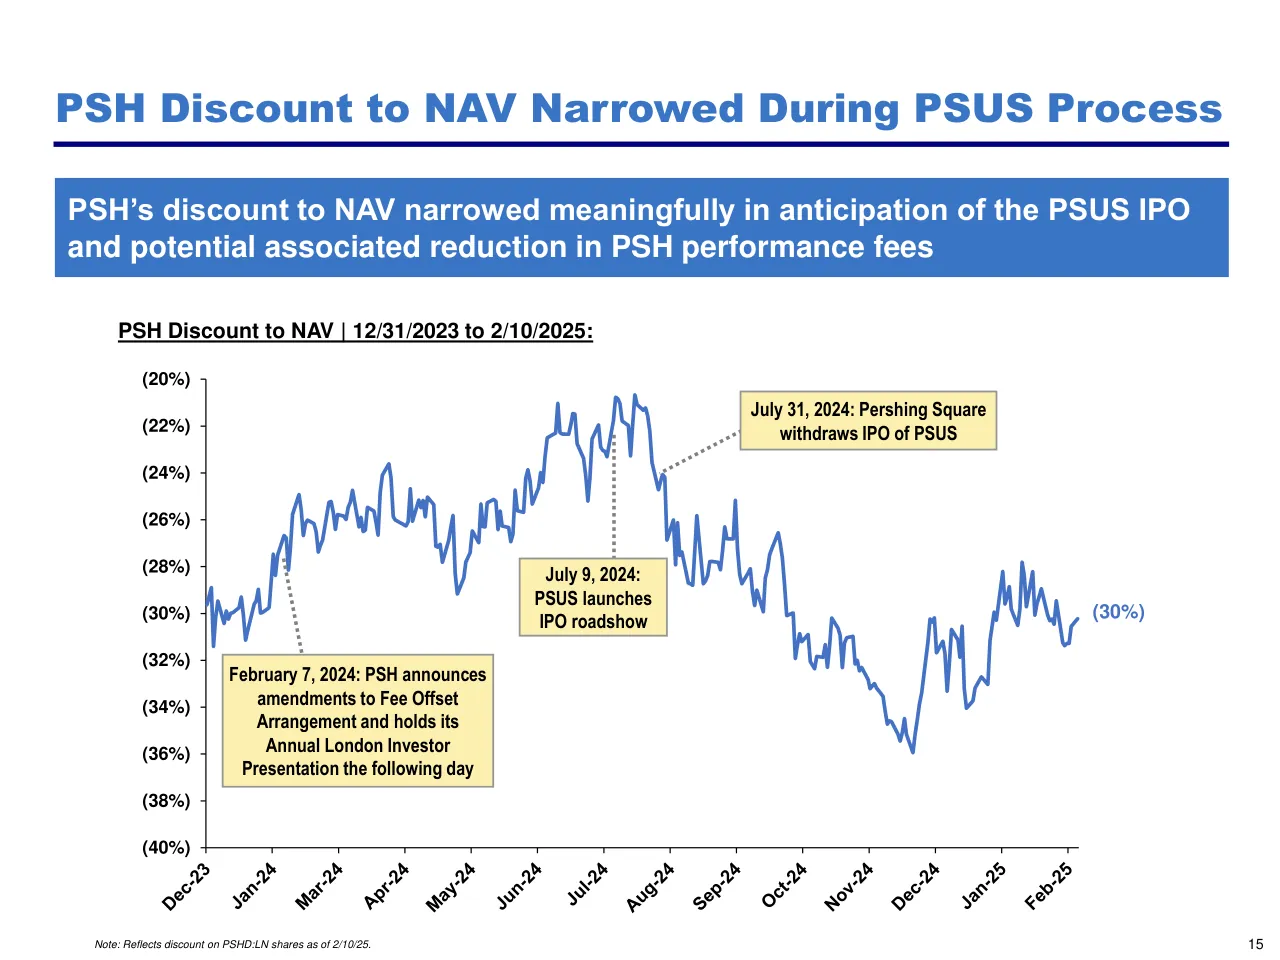
PSUS IPO Update / Made the decision to postpone PSUS IPO, initially planned for July 2024 / Received substantial interest from retail and institutional investors (family offices, asset managers, / sovereign wealth funds, high-net worth individuals) over a two-month marketing phase / However, investor considerations around potential aftermarket trading dynamics prompted us to / re-evaluate PSUS’s structure in order to simplify the IPO investment decision / PSUS IPO should result in material reduction of PSH’s performance fees / As part of PSH’s amended Fee Offset Arrangement, PSH’s performance fees will be reduced by / 20% of management fees earned on PSUS / Countercyclical benefit: Fee reduction derived from PSUS’s recurring management fees will have / a greater relative impact on PSH’s performance fee percentage in years with lower gross returns / PSH discount narrowed substantially in anticipation of PSUS IPO / Discount to NAV narrowed from 38% in October 2023 to 21% in July 2024 (1) / We continue to re-evaluate the PSUS transaction structure and will keep PSH / investors informed as regulations allow / (1) Reflects discount on PSHD:LN shares. / 14
Visuals: No charts, tables, photographs or logos. Three blue right-pointing triangle markers (Wingdings3 glyph, #3A75C4) sit at the left of the bold headlines, and five blue square bullets (Wingdings2 glyph, #3A75C4) sit at the left of the sub-points. A navy horizontal rule (#000080, about 0.5% of slide height thick) runs under the title from x about 4.2% to 96%.
Slide 15
PSH Discount to NAV Narrowed During PSUS Process / PSH’s discount to NAV narrowed meaningfully in anticipation of the PSUS IPO / and potential associated reduction in PSH performance fees / PSH Discount to NAV | 12/31/2023 to 2/10/2025: / (20%) / (22%) / (24%) / (26%) / (28%) / (30%) / (32%) / (34%) / (36%) / (38%) / (40%) / Dec-23 / Jan-24 / Mar-24 / Apr-24 / May-24 / Jun-24 / Jul-24 / Aug-24 / Sep-24 / Oct24 / Nov-24 / Dec-24 / Jan-25 / Feb-25 / July 31, 2024: Pershing Square / withdraws IPO of PSUS / July 9, 2024: / PSUS launches / IPO roadshow / (30%) / February 7, 2024: PSH announces / amendments to Fee Offset / Arrangement and holds its / Annual London Investor / Presentation the following day / Note: Reflects discount on PSHD:LN shares as of 2/10/25. / 15
Visuals: Line chart titled 'PSH Discount to NAV | 12/31/2023 to 2/10/2025:' (bold, underlined). Y-axis: 'PSH discount to NAV' expressed as percentage, labelled from (20%) at top to (40%) at bottom in 2% steps, with the axis drawn as a negative range so that deeper discounts sit lower; no axis title printed. X-axis: monthly ticks labelled Dec-23, Jan-24, Mar-24, Apr-24, May-24, Jun-24, Jul-24, Aug-24, Sep-24, Oct24, Nov-24, Dec-24, Jan-25, Feb-25, rotated about 45 degrees. One series: a single blue line (#4472C4 approximately, about 3 pt wide) of daily values. Printed value: only the final point is labelled '(30%)' in blue at the right end. Estimated values (about): start Dec-23 about (29%); dip to about (31%) early Jan-24; rise to about (25%) by late Jan-24; about (24%) to (26%) Feb-Apr-24; about (26%) mid-May-24; about (23%) to (25%) Jun-24; peak about (21%) early Jul-24; about (22%) to (23%) late Jul-24; about (27%) early Aug-24; about (28%) to (30%) Sep-24; about (26%) to (30%) Oct-24; about (30%) to (33%) Nov-24; low about (36%) early Dec-24; about (31%) to (33%) Jan-25; about (28%) mid-Jan-25; about (30%) to (31%) Feb-25. Callouts: three pale yellow boxes with thin grey outline and dotted grey leader lines. Box 1 'February 7, 2024: PSH announces amendments to Fee Offset Arrangement and holds its Annual London Investor Presentation the following day' sits below the line near Jan-Feb-24 with its leader running up to about (27%). Box 2 'July 9, 2024: PSUS launches IPO roadshow' sits below the peak with a vertical dotted leader up to about (22%) at Jul-24. Box 3 'July 31, 2024: Pershing Square withdraws IPO of PSUS' sits above-right with a diagonal dotted leader down to about (24%) at late Jul-24. No legend. Highlighted points: the three annotated dates are the highlighted points, marked by the leader lines; no markers are drawn on the line.
Slide 16
HHH Transaction Background / Pershing Square’s involvement with HHH dates back to its spin-off from GGP in 2010 / In November 2010, Pershing Square received 7.8 million shares(1) from the spin-off and, along with other / investors, initially capitalized the company with a $250 million rights offering at $47.62 per share / Supported the company’s evolution since 2010, including a comprehensive strategic review / in 2019 / In June 2019, the company hired Centerview Partners to advise on a range of strategic alternatives, including / a sale of the company / The company concluded the strategic review by embarking on a transformation plan to simplify the business, / reduce overhead expenses and enhance the management team / Despite substantial business progress and a high-quality board & management team, the / company’s share price has underperformed since its spin-off from GGP / When we filed our 13D on August 6, 2024, HHH’s closing share price the previous day was $61.46 / Including the market value of the Seaport Entertainment spinoff, the $16.62 increase from the company’s 2010 / rights offering price represents a 35% total return over the prior 14 years, or a 2.2% compound annual return / (1) / Includes 2.4mm shares in stock and 5.4mm shares from equity swap exposure. / 16
Visuals: None apart from non-text markers: a solid navy horizontal rule under the title, blue right-pointing triangle glyphs (Wingdings3) before each bold lead bullet, and blue square glyphs (Wingdings2) before each sub-bullet. No photographs, charts, tables, logos or icons.
Slide 17
HHH Transaction Background (Cont’d)
Over time, PSH and the Pershing Square private funds (collectively, the “Pershing Square
Funds”) have increased their ownership in HHH to 37.6% through a series of transactions:
Sold 4.7 million shares at an average price of $125 per share in 2018
Acquired 10.0 million shares by investing $500 million of equity at $50 per share as part of a $600 million
rights offering in March 2020 to stabilize the company’s balance sheet through the COVID-19 crisis
Acquired 5.4 million shares at an average price of $73 per share from September 2021 to December 2023
Ultimately, the lack of recognition for HHH’s portfolio and accomplishments by the market
led to our decision in August 2024 to evaluate potential transaction alternatives
On January 13, 2025, Pershing Square submitted an offer letter to the company outlining
the following proposed transaction:
Pershing Square HoldCo, L.P., the holding company of the Investment Manager (“Pershing Square
Holdco”), acquires $1.0 billion of HHH common stock at $85 per share in a secondary purchase from public
float shareholders
Simultaneously, HHH does a self-tender for up to $500 million of stock at $85 per share
We are actively engaged in discussions with the company and will keep PSH investors
informed of any material developments
17
Slide 18
Post-Transaction HHH Business Plan
Pershing Square’s proposal is fundamentally to transform HHH into a diversified
holding company that purchases controlling interests in public and private companies
Pershing Square’s senior leadership becomes the management team of HHH, the holding company
Pershing Square’s senior leadership includes Bill Ackman – Chairman & CEO, Ryan Israel – Chief Investment
Officer, and Ben Hakim – President
Pershing Square senior leadership will not receive any cash or stock compensation as employees of HHH
The Howard Hughes Corporation (“HHC”) will remain unchanged as the principal subsidiary of HHH
Current HHC senior leadership team, led by David O’Reilly as CEO, will continue in their roles managing HHC
HHC will continue to develop its core MPC business line with no change in strategy or employees
The full resources of Pershing Square Holdco, including the Investment Manager’s investment team,
accounting, finance, technology and other teams and resources are made available to HHH
In consideration for services, Pershing Square Holdco will receive a fee of 1.5 percent per annum of the equity
market capitalization of the company, paid quarterly
HHH will not pay any promote or performance fees to Pershing Square Holdco or its employees
Post-transaction, we will eliminate the management fees PSH pays to PSCM on
HHH shares owned by PSH
18
Slide 19
Benefits to PSH from Proposed Transaction / Reduction in PSH management fees / Management fees paid by PSH to PSCM associated with PSH's current stake of 16.5 million / HHH shares would be eliminated / These fees today equate to ~$21 million(1), or ~0.15% of PSH's current equity AUM, implying / a post-transaction PSH management fee of ~1.35% / Improved HHH should enhance the value of PSH’s stake in the company / Leverages Pershing Square’s leadership and investment expertise / Asymmetric hedging strategy can mitigate HHH’s exposure to macroeconomic risks / Differentiated ability to source and execute private transactions / Vastly improved access to equity and debt capital markets / Transaction should widen investor interest driven by expanded investment strategy and / Pershing Square’s broad retail and institutional following / PSH and HHH will pursue distinct yet synergistic investment mandates / (1) / Assuming transaction price of $85 (1.5% x $85 per share x 16.6 million HHH shares owned by PSH = $21 million). / 19
Visuals: No photographs, charts, tables or logos. Three green check-mark glyphs (Wingdings, #509467) act as heading markers, and nine blue square bullet glyphs (Wingdings2, #3A75C4) mark the sub-points. A dark navy horizontal rule (about #000080, roughly 0.6% of height thick) runs beneath the title from about x 4.2% to x 96%. A superscript (1) follows '$21 million' in the second bullet.
Slide 20
2024 Performance Review
Slide 21
2024 Performance Overview
2024 Return: PSH NAV Net of Fees vs. Indices Total Return
25.0%
19.2%
10.2%
8.5%
7.5%
7.8%
PSH NAV
S&P 500
FTSE / 100(1)
MSCI / World
HFRX / Activist / Index(2)
HFRX Equity / Hedge / Index(2)
21
Reflects returns from 12/31/23 through 12/31/24, including dividend reinvestment for indices. Past performance is not necessarily indicative of future results. All investments involve the possibility of profit and the risk of loss, including the loss of / principal. Please see the additional disclaimers and notes to performance results at the end of this presentation. / (1) FTSE 100 index reflects USD-denominated returns for consistency with other indices. / (2) HFRX Equity Hedge Index and HFRX Activist Index are constructed and maintained by Hedge Fund Research, Inc. HFRX Equity Hedge Index includes funds that maintain long and short positions in primarily equity and equity derivative / securities and employ a broad range of fundamental and quantitative techniques in their investment process. HFRX Activist Index includes funds with activist strategies and 50%+ of portfolio in activist situations.
Visuals: Vertical bar chart with no printed axes or gridlines and no legend. Six bars sit on a shared black baseline at about 74.7% of slide height, each with its value printed above it. Bars left to right: PSH NAV 10.2% (blue #4472C4, the only blue bar, about 7.9% wide and 14.1% tall); S&P 500 25.0% (green #509467, tallest bar, about 40.3% top edge); FTSE 100(1) 7.5% (green, about 64.4% top edge); MSCI World 19.2% (green, about 48.3% top edge); HFRX Activist Index(2) 8.5% (green, about 63.0% top edge); HFRX Equity Hedge Index(2) 7.8% (green, about 63.9% top edge). Bar heights are proportional to the printed values, with no printed scale. A dashed grey vertical divider at about 21.4% of slide width separates the PSH NAV bar from the index bars, running from about 33% to 84% of slide height. No highlighted points beyond the blue PSH NAV bar. No logos, photographs or icons.
Slide 22
Cumulative Net Returns Since Inception
Pershing Square L.P. (“PSLP”) / PSH
Since Firm Inception (1/1/04 – 2/10/25)
PSH Annual Investor Presentation
January 19, 2018
PSLP/PSH:
2,370%
Since PSH Inception
(12/31/12 – 2/10/25)
PSH: 366%
S&P 500: 431%
2,400%
2,200%
2,000%
1,800%
1,600%
1,400%
1,200%
1,000%
800%
600%
400%
200%
0%
Returning to Our Roots
We have created a strong path forward that reminds us of our early roots
✓ Restructured to a smaller investment-centric organization
■ Growth will come from returns, not asset gathering
■ More efficient and impactful team will strengthen the firm’s culture
✓ Reinforced our core investment principles
■ We have learned from our mistakes and carved our investment principles in stone
■ New investments in 2017 demonstrate strong alignment with core principles
✓ Continue to create value with activism
■ ADP and Chipotle are in early stages of value creation
S&P 500:
720%
2004 / 2005 / 2006 / 2007 / 2008 / 2009 / 2010 / 2011 / 2012 / 2013 / 2014 / 2015 / 2016 / 2017 / 2018 / 2019 / 2020 / 2021 / 2022 / 2023 / 2024 / 2025
First 11.5 Years Since Firm Inception
(Jan 2004 – July 2015)
Challenging Period
(Aug 2015 – Dec 2017)
Permanent Capital Era
(Jan 2018 – Present)
Note: PSLP/PSH data represents returns an investor would have earned by investing in PSLP at its January 1, 2004 inception and converting to PSH at its launch on December 31, 2012.
Past performance is not necessarily indicative of future results. All investments involve the possibility of profit and the risk of loss, including the loss of principal. Please see the additional disclaimers and notes to performance results at the end
of this presentation.
22
Visuals: Line chart titled 'Cumulative Net Returns Since Inception' (subtitle: 'Since Firm Inception (1/1/04 – 2/10/25)'). X-axis: calendar years 2004 to 2025, one tick per year, labels rotated about 30 degrees, no axis title. Y-axis: cumulative net return in percent, 0% to 2,400% in 200% steps, labels on the left, no axis title. Two series, both sampled annually. Series 1, PSLP/PSH (blue line, labelled 'PSLP/PSH: 2,370%' at the right end): about 0% in 2004, about 70% in 2005, about 110% in 2006, about 170% in 2007, about 200% in 2008, about 160% in 2009, about 270% in 2010, about 380% in 2011, about 400% in 2012, about 460% in 2013, about 640% in 2014, about 740% in 2015, about 380% in 2016, about 440% in 2017, about 390% at start of 2018 then about 520% and 440% in early 2018, about 700% in 2019, about 980% in 2020, about 1,430% in 2021, about 1,250% in 2022, about 1,700% in 2023, about 2,100% in 2024, 2,370% at 2025 (printed value). Series 2, S&P 500 (green line, labelled 'S&P 500: 720%' at the right end): about 0% in 2004, about 10% in 2005, about 20% in 2006, about 45% in 2007, about 30% in 2008, about 0% in 2009, about 10% in 2010, about 40% in 2011, about 55% in 2012, about 80% in 2013, about 120% in 2014, about 140% in 2015, about 150% in 2016, about 200% in 2017, about 230% in 2018, about 270% in 2019, about 330% in 2020, about 450% in 2021, about 370% in 2022, about 490% in 2023, about 660% in 2024, 720% at 2025 (printed value). No legend; series identified by end labels in matching colours. Highlighted points: the two end-of-line values (2,370% and 720%). Printed reference values in inset box: PSH 366% and S&P 500 431% since 12/31/12. A dashed grey vertical divider at the start of 2018 separates the periods. Three black bracket lines under the x-axis group the years 2004 to mid-2015, Aug 2015 to Dec 2017 and Jan 2018 to present. Inset screenshot: a small excerpt of an earlier slide titled 'Returning to Our Roots' on white, with a red-brown (#9C3A0E) banner reading 'We have created a strong path forward that reminds us of our early roots', navy rule under the title, three green check marks with black bold headings and small blue square bullets beneath; it is not cropped and sits inside a thin black border. A grey arrow runs from the bottom-right of the inset to the 2018 divider.
Slide 23
Reinforced Commitment to Core Principles
Pershing Square’s Core Investment Principles
Key Business Characteristics
Simple, predictable, free-cash-flow-generative business
Formidable barriers to entry
Limited exposure to extrinsic factors that we cannot control
Generally, low financial leverage levels
Minimal capital markets dependency
Typically, highly liquid, mid- and large-cap companies
In limited circumstances, we are willing to waive certain of the above criteria if there are sufficient mitigating factors, and the position is sized appropriately
Attractive Valuation
Fair price “as is,” but a substantial discount to optimized value
Base case valuation not reliant on future M&A or platform value
Good Management & Governance
In-place or identified management with high degree of integrity, track record of success, and appropriate incentives
Typically, no controlling shareholder
Occasional Mispriced Probabilistic Investments
Must offer highly asymmetric return to compensate for possibility of permanent loss of capital
Limited to investments within our circle of competence
Will represent a small percentage of fund capital in the aggregate and an appropriate “return on invested brain damage”
Simple, predictable, free-cash-flow-generative business
Formidable barriers to entry
Limited exposure to extrinsic factors that we cannot control
Strong balance sheet
Attractive valuation
Minimal capital markets dependency
Large market capitalization
Exceptional management & governance
Pershing Square
The above is intended to be illustrative and there is no guarantee that PSCM will be able to identify the constituent investments that reflect these characteristics
23
Visuals: Left: a photographed-looking parchment or speckled grey paper panel (about 41.7 by 66.8 percent of slide) reproducing Pershing Square’s Core Investment Principles, with a blue heading, navy underline, bold section headings in navy, dark blue, red, blue and green, and bullets marked with small blue triangles. Lower left: a navy rectangle (#00578F) holding the white Pershing Square logo, a white square-stylised P-shaped mark and the words Pershing / Square in white sans-serif. Right: eight icon tiles, each a flat light grey (#F2F2F2) square with a navy (#003F6E) pictogram above a black label. Row 1 left: stacked banknotes with a dollar coin, label Simple, predictable, free-cash-flow-generative business. Row 1 right: brick wall, label Formidable barriers to entry. Row 2 left: circular gear arrows icon, label Limited exposure to extrinsic factors that we cannot control. Row 2 right: document with money bag marked dollar sign, label Strong balance sheet. Row 3 left: balance scales, label Attractive valuation. Row 3 right: rising trend line with arrow, label Minimal capital markets dependency. Row 4 left: office buildings, label Large market capitalization. Row 4 right: group of three people silhouettes, label Exceptional management & governance.
Slide 24
Significant Outperformance Since the Inception of
Pershing Square’s Permanent Capital Era
7 Year Compound Annual Return: PSH NAV Net of Fees vs. Indices Total Return
22.9%
13.8%
10.8%
8.7%
4.0%
3.6%
PSH NAV
S&P 500
FTSE
100(1)
MSCI
World
HFRX
Activist
Index(2)
HFRX Equity
Hedge
Index(2)
PSH Annual Outperformance:
910 bps
1,930 bps
1,210 bps
1,420 bps
1,890 bps
Reflects returns from 12/31/17 through 12/31/24, including dividend reinvestment for indices. Pershing Square began its ‘‘permanent capital era’’ on 1/1/18 by focusing on growing its permanent capital base through generating and
compounding long-term returns and renewing its commitment to its core investment principles. Please refer to page 22 for more information on Pershing Square’s permanent capital era. Please refer to page 10 for PSH’s one, five, and ten-year
annualized returns. Past performance is not necessarily indicative of future results. All investments involve the possibility of profit and the risk of loss, including the loss of principal. Please see the additional disclaimers and notes to performance
results at the end of this presentation.
(1) FTSE 100 index reflects USD-denominated returns for consistency with other indices.
(2) HFRX Equity Hedge Index and HFRX Activist Index are constructed and maintained by Hedge Fund Research, Inc. HFRX Equity Hedge Index includes funds that maintain long and short positions in primarily equity and equity derivative
securities and employ a broad range of fundamental and quantitative techniques in their investment process. HFRX Activist Index includes funds with activist strategies and 50%+ of portfolio in activist situations.
24
Visuals: Column bar chart with no chart title beyond the yellow subtitle band. Chart type: vertical column chart, six categories. Categories left to right: PSH NAV, S&P 500, FTSE 100(1), MSCI World, HFRX Activist Index(2), HFRX Equity Hedge Index(2). Values printed above each bar: PSH NAV 22.9%; S&P 500 13.8%; FTSE 100 3.6%; MSCI World 10.8%; HFRX Activist Index 8.7%; HFRX Equity Hedge Index 4.0%. Value axis: no axis drawn and no tick labels; bar heights are proportional to the printed values, with the baseline at the zero line. Series: one series. The PSH NAV bar is highlighted in blue #4472C4 and the five index bars are green #509467. A grey dashed vertical divider separates the PSH NAV bar from the index bars. Baseline is a thin black horizontal line. Below the chart, a cyan strip labelled PSH Annual Outperformance lists 910 bps (under PSH NAV column area), 1,930 bps (FTSE 100), 1,210 bps (MSCI World), 1,420 bps (HFRX Activist Index), and 1,890 bps (HFRX Equity Hedge Index). No legend. No photographs, logos or icons.
Slide 25
PSLP / PSH Annual Net Returns
Year
PSLP / PSH
S&P 500
2004
42.6%
10.9%
2005
39.9%
4.9%
2006
22.5%
15.8%
2007
22.0%
5.5%
2008
(13.0%)
(37.0%)
2009
40.6%
26.4%
2010
29.7%
15.1%
2011
(1.1%)
2.1%
2012
13.3%
16.0%
2013
9.6%
32.4%
2014
40.4%
13.7%
2015
(20.5%)
1.4%
2016
(13.5%)
11.9%
2017
(4.0%)
21.8%
2018
(0.7%)
(4.4%)
2019
58.1%
31.5%
2020
70.2%
18.4%
2021
26.9%
28.7%
2022
(8.8%)
(18.1%)
2023
26.7%
26.3%
2024
10.2%
25.0%
2025 YTD(1)
8.4%
3.2%
1.5% Management Fee,
20% Incentive Fee,
Unlevered
PSLP
1.5% Management Fee,
16% Incentive Fee,
Modestly Levered
PSH
Compound Annual Return
Since Firm Inception (1/1/04 - 2/10/25)(2)
16.4%
10.5%
Since PSH Inception (12/31/12 - 2/10/25)
13.5%
14.8%
Past performance is not necessarily indicative of future results. All investments involve the possibility of profit and the risk of loss, including the loss of principal. Please see the additional disclaimers and notes to performance results at the end
of this presentation.
(1) Year-to-date returns as of 2/10/25.
(2) PSLP/PSH data represents returns an investor would have earned by investing in PSLP at its January 1, 2004 inception and converting to PSH at its launch on December 31, 2012.
25
Visuals: One data table with columns Year, PSLP / PSH and S&P 500 and rows 2004 to 2025 YTD(1) plus a yellow summary block. Rows by year, PSLP / PSH then S&P 500: 2004 42.6% 10.9%; 2005 39.9% 4.9%; 2006 22.5% 15.8%; 2007 22.0% 5.5%; 2008 (13.0%) (37.0%); 2009 40.6% 26.4%; 2010 29.7% 15.1%; 2011 (1.1%) 2.1%; 2012 13.3% 16.0%; 2013 9.6% 32.4%; 2014 40.4% 13.7%; 2015 (20.5%) 1.4%; 2016 (13.5%) 11.9%; 2017 (4.0%) 21.8%; 2018 (0.7%) (4.4%); 2019 58.1% 31.5%; 2020 70.2% 18.4%; 2021 26.9% 28.7%; 2022 (8.8%) (18.1%); 2023 26.7% 26.3%; 2024 10.2% 25.0%; 2025 YTD 8.4% 3.2%. Alternate rows 2004, 2006, 2008, 2010, 2012, 2014, 2016, 2018, 2020, 2022, 2024 are shaded light cyan; the other rows are white. A dashed vertical divider separates the year column from the PSLP / PSH column and the PSLP / PSH column from the S&P 500 column. Two thin black curly brackets sit to the right of the S&P 500 column: the upper spans 2004 to 2012 and is labelled PSLP, the lower spans 2013 to 2025 YTD and is labelled PSH. Summary block (Compound Annual Return): Since Firm Inception (1/1/04 - 2/10/25) 16.4% and 10.5%; Since PSH Inception (12/31/12 - 2/10/25) 13.5% and 14.8%. No photographs, logos or icons.
Slide 26
PSLP / PSH Cumulative Net Returns
Net Returns vs. S&P 500
through December 31, 2024
PSH
PSLP / PSH
2,185%
694%
415%
331%
324%
242%
180%
173%
147%
97%
10% 25%
1-Year
5-Year
7-Year
10-Year
Since PSH
Inception
(12/31/2012)
Since Firm
Inception
(1/1/2004)
PSLP / PSH
S&P 500
Note: PSLP/PSH data represents returns an investor would have earned by investing in PSLP at its January 1, 2004 inception and converting to PSH at its launch on December 31, 2012.
Past performance is not necessarily indicative of future results. All investments involve the possibility of profit and the risk of loss, including the loss of principal. Please see the additional disclaimers and notes to performance results at the end of this presentation.
26
Visuals: Clustered column chart, vertical bars, no chart title inside the plot, no y-axis, no gridlines and no axis numbers. Two series: PSLP / PSH in blue #4472C4 and S&P 500 in green #509467, with each bar carrying its printed value. Categories left to right: 1-Year PSLP / PSH 10%, S&P 500 25%; 5-Year 173%, 97%; 7-Year 324%, 147%; 10-Year 180%, 242%; Since PSH Inception (12/31/2012) 331%, 415%; Since Firm Inception (1/1/2004) 2,185%, 694%. Bar heights are proportional to the printed values except that the bars are not drawn to a visible scale; about 1-Year bars are nearly flat. Highlighted points: the final group Since Firm Inception is separated from the others by a vertical dashed grey divider and is the tallest pair of bars. Category axis is a thin light grey baseline at about 75% of slide height. Legend: a rounded box with navy border containing a blue square followed by PSLP / PSH and a green square followed by S&P 500. Bars are solid rectangles with no outline, no gradient, no shadow.
Slide 27
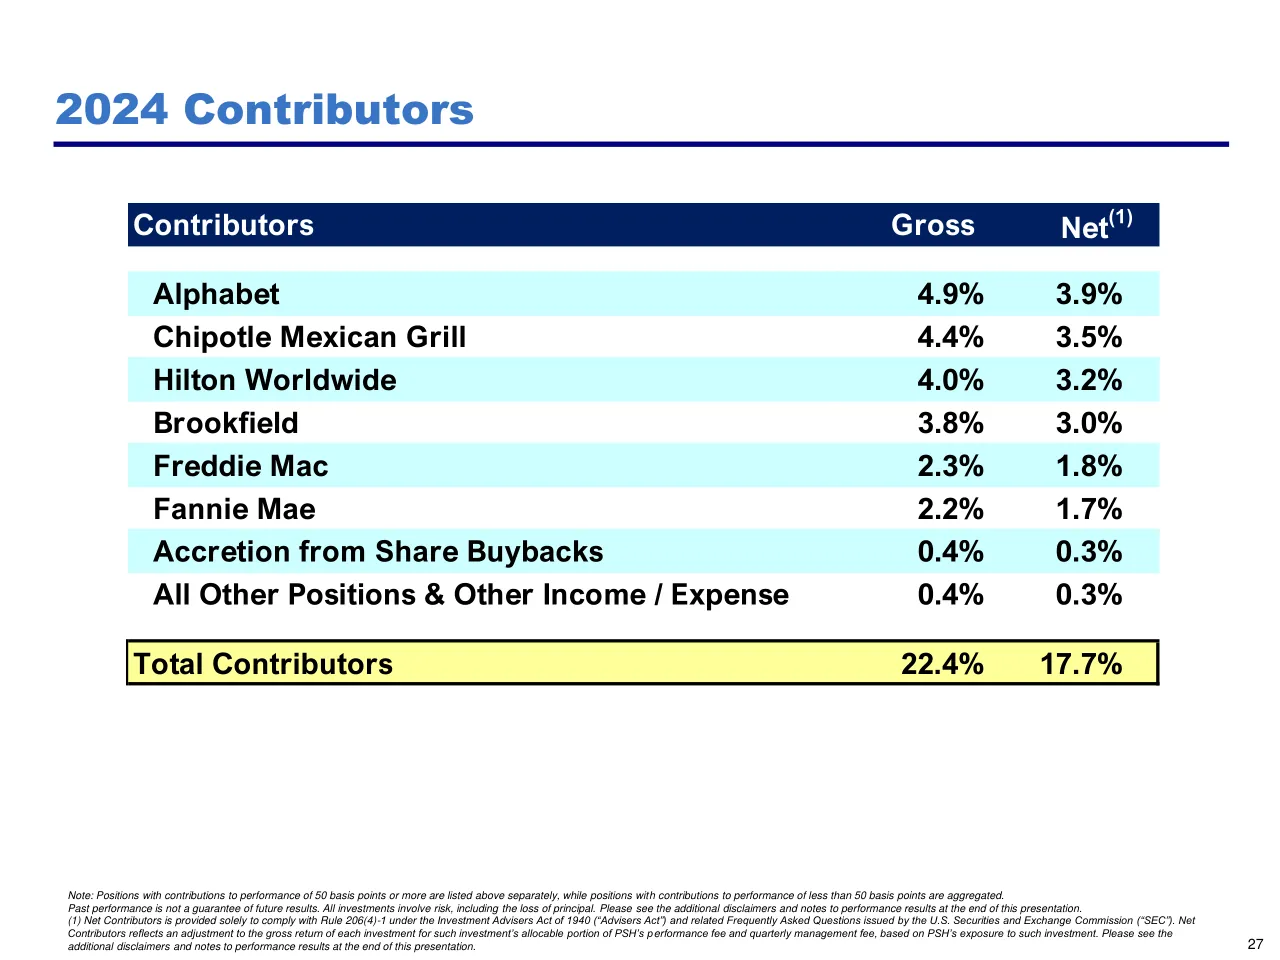
2024 Contributors
Contributors / Gross / Net(1)
Alphabet / 4.9% / 3.9%
Chipotle Mexican Grill / 4.4% / 3.5%
Hilton Worldwide / 4.0% / 3.2%
Brookfield / 3.8% / 3.0%
Freddie Mac / 2.3% / 1.8%
Fannie Mae / 2.2% / 1.7%
Accretion from Share Buybacks / 0.4% / 0.3%
All Other Positions & Other Income / Expense / 0.4% / 0.3%
Total Contributors / 22.4% / 17.7%
27
Note: Positions with contributions to performance of 50 basis points or more are listed above separately, while positions with contributions to performance of less than 50 basis points are aggregated.
Past performance is not a guarantee of future results. All investments involve risk, including the loss of principal. Please see the additional disclaimers and notes to performance results at the end of this presentation.
(1) Net Contributors is provided solely to comply with Rule 206(4)-1 under the Investment Advisers Act of 1940 (“Advisers Act”) and related Frequently Asked Questions issued by the U.S. Securities and Exchange Commission (“SEC”). Net
Contributors reflects an adjustment to the gross return of each investment for such investment’s allocable portion of PSH’s performance fee and quarterly management fee, based on PSH’s exposure to such investment. Please see the
additional disclaimers and notes to performance results at the end of this presentation.
Visuals: One table, no chart, photo, logo or icon. Columns: Contributors (label column, left-aligned), Gross (right-aligned percentages), Net(1) (right-aligned percentages, with superscript (1)). Header row: Contributors, Gross, Net(1) on navy #002060 bar. Body rows, top to bottom, with values Gross and Net: Alphabet 4.9% and 3.9%; Chipotle Mexican Grill 4.4% and 3.5%; Hilton Worldwide 4.0% and 3.2%; Brookfield 3.8% and 3.0%; Freddie Mac 2.3% and 1.8%; Fannie Mae 2.2% and 1.7%; Accretion from Share Buybacks 0.4% and 0.3%; All Other Positions & Other Income / Expense 0.4% and 0.3%. Alternate rows Alphabet, Hilton Worldwide, Freddie Mac and Accretion from Share Buybacks are shaded light cyan #CCFFFF; the others are white. A final Total Contributors row, 22.4% gross and 17.7% net, is set on a pale yellow #FFFF99 band with a black outline of about 2 px.
Slide 28
2024 Detractors
Detractors
Gross
Net(1)
Nike
(2.2%)
(1.9%)
Interest Rate Swaptions
(1.9%)
(1.7%)
Universal Music Group
(1.7%)
(1.5%)
Restaurant Brands International
(1.6%)
(1.4%)
Howard Hughes Holdings
(0.6%)
(0.5%)
Total Detractors - Underlying Portfolio
(8.0%)
(7.0%)
Bond Interest Expense
(0.6%)
(0.5%)
Total Detractors - incl. Interest Expense
(8.6%)
(7.5%)
28
Note: Positions with contributions to performance of 50 basis points or more are listed above separately, while positions with contributions to performance of less than 50 basis points are aggregated.
Past performance is not a guarantee of future results. All investments involve risk, including the loss of principal. Please see the additional disclaimers and notes to performance results at the end of this presentation.
(1) Net Detractors is provided solely to comply with Rule 206(4)-1 under the Advisers Act of 1940 and related Frequently Asked Questions issued by the SEC. Net Detractors reflects an adjustment to the gross return of each
investment for such investment’s allocable portion of PSH’s performance fee and quarterly management fee, based on PSH’s exposure to such investment. Please see the additional disclaimers and notes to performance results at the
end of this presentation.
Visuals: A table with three columns: Detractors (name), Gross and Net(1), with values in parentheses. Header row: Detractors, Gross, Net(1) in white bold on navy #002060. Row 1 (cyan #CCFFFF fill): Nike, (2.2%), (1.9%). Row 2 (white, no fill): Interest Rate Swaptions, (1.9%), (1.7%). Row 3 (cyan): Universal Music Group, (1.7%), (1.5%). Row 4 (white): Restaurant Brands International, (1.6%), (1.4%). Row 5 (cyan): Howard Hughes Holdings, (0.6%), (0.5%). Gap, then a yellow #FFFF99 total row with a black outline of about 0.3% of slide height: Total Detractors - Underlying Portfolio, (8.0%), (7.0%). Gap, then a cyan row: Bond Interest Expense, (0.6%), (0.5%). Gap, then a second yellow outlined total row: Total Detractors - incl. Interest Expense, (8.6%), (7.5%). No charts, photographs or logos. Navy rule under the title is a solid line in dark navy #000080, about 0.4% of slide height thick.
Slide 29
Total Assets Under Management
AUM (1)
Insider Capital (2)
As of 2/10/2025 ($ in millions)
Total
Equity
Total
% of Equity
Pershing Square Holdings ("PSH")
$16,531
$14,215
$3,864
27.2%
Pershing Square, L.P. ("PSLP")
1,460
1,460
591
40.5%
Pershing Square International ("PSI")
478
478
98
20.4%
Total Core Funds
$18,469
$16,153
$4,553
28.2%
Note: Assets under management are gross of any accrued performance fees. Past performance is not necessarily indicative of future results. All investments involve the possibility of profit and the risk of loss, including the loss of principal.
Please see the additional disclaimers and notes to performance results at the end of this presentation.
(1) Total AUM includes $1.8 billion and €500 million (translated to USD at the prevailing exchange rate) of PSH bond proceeds. Equity AUM excludes these amounts.
(2) Includes Pershing Square employees and affiliates and charitable entities associated with Pershing Square employees or Pershing Square affiliates.
29
Visuals: One table, no chart, photo or logo. Columns: row label column (left, no header text besides 'As of 2/10/2025 ($ in millions)'), AUM Total, AUM Equity, Insider Capital Total (italic), Insider Capital % of Equity (italic). Group headers: 'AUM' with superscript (1) spanning Total and Equity, and 'Insider Capital' in bold italic with superscript (2) spanning Total and % of Equity. Rows: 'Pershing Square Holdings ("PSH")' $16,531 | $14,215 | $3,864 | 27.2%; 'Pershing Square, L.P. ("PSLP")' 1,460 | 1,460 | 591 | 40.5%; 'Pershing Square International ("PSI")' 478 | 478 | 98 | 20.4%; 'Total Core Funds' $18,469 | $16,153 | $4,553 | 28.2%. Header row is navy with white bold text; rows 1 and 3 are pale cyan, row 2 is white, and the total row is pale yellow with a thin black outline. A grey dashed vertical line separates the AUM columns from the Insider Capital columns. Thin white underlines sit beneath the AUM and Insider Capital group headers and beneath the Total, Equity, Total and % of Equity column headers. No highlighted points beyond the total row.
Slide 30
Business and Organizational Update
Slide 31
Key Business Developments in the Last Year / The last twelve months were a productive period marked by robust idea / generation and significant progress on strategic initiatives / Initiated new core investments in Brookfield and Nike in 2024, and Uber in 2025 / Closely monitored macroeconomic developments and evaluated hedging / opportunities to protect our portfolio from downside risks / Sold a 10% common equity stake in PSCM to a group of strategic investors, / the proceeds of which will be used to anchor new strategies or fund launches / Proposed strategic transaction with Howard Hughes Holdings / Redesigning the PSUS transaction structure / 31
Visuals: No photographs, charts, tables or diagrams. Five green check-mark glyphs (Wingdings check, #509467) act as bullet markers, one beside each bullet item, with the two-line bullets sharing a single check. A solid navy horizontal rule (#000080, about 0.5% of slide height thick) runs under the title from about x 4.3% to x 96%.
Slides 32 to 75 continue in the full text file.
Download this deck
The hosted PDF of every library deck is free for readers of the SlideDeck Co newsletter. Join with your email and the viewer and download appear here.
Raising or reporting on a fund of your own? The SlideDeck Co Private Equity Deck is a slide library for fund presentations, with a worked fund case.