
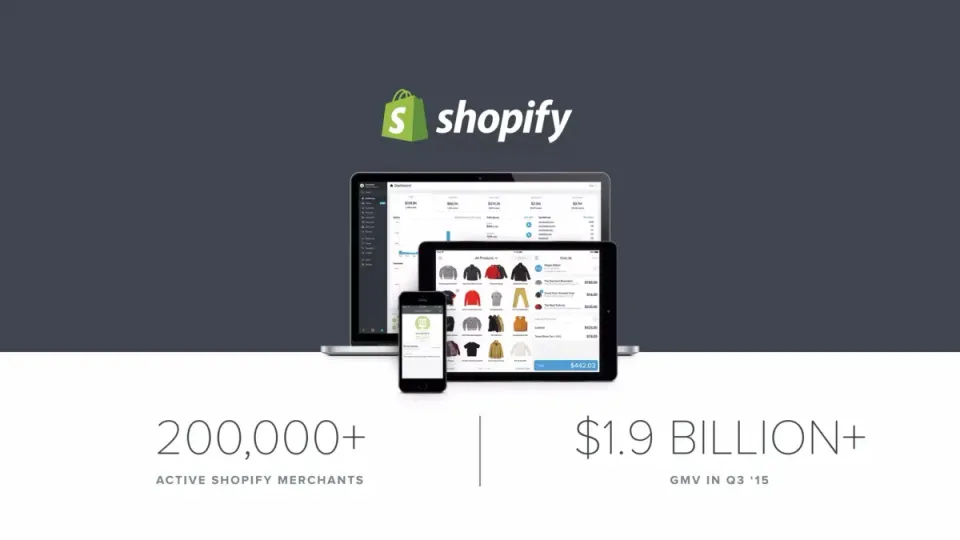
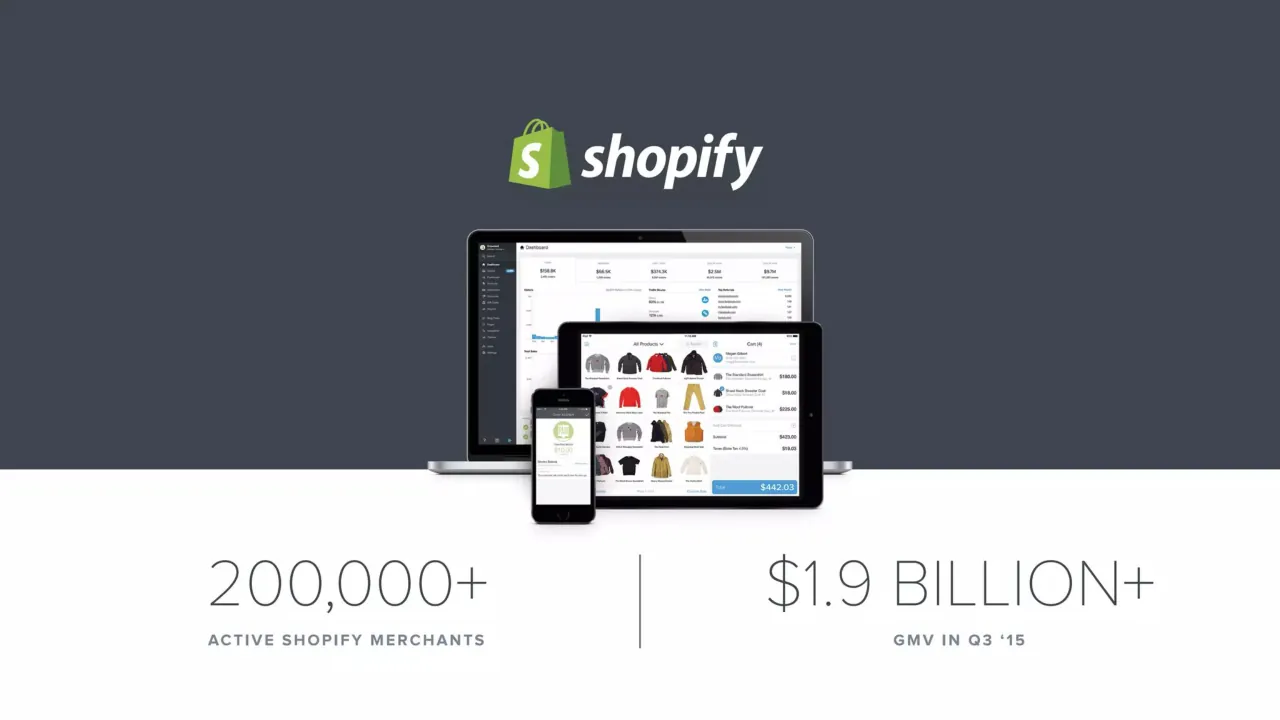
The deck opens with headline metrics of more than 200,000 active merchants and over $1.9 billion in gross merchandise volume in Q3 2015. A safe harbour statement on forward-looking claims and non-GAAP measures follows. It then covers the company's multi-channel commerce platform and its market of entrepreneurs, small and mid-sized businesses, and larger brands. A market-sizing slide sets a global total addressable market against current core geographies. Next comes a company history in the form of a Build-a-Business timeline, along with the partner ecosystem of app developers, theme designers, and agencies. The financial section shows revenue, monthly recurring revenue, and GMV growth with year-on-year comparisons, a gross profit slide, and an operating leverage slide tracking expenses as a share of revenue. Growth vectors and investment highlights come next, and the deck closes with the line 'Make commerce better for everyone.' An appendix reconciles non-GAAP figures to GAAP.
Slides worth studying
Questions about this deck
What does the Shopify deck say about its total addressable market?
Slide 10 ('Headroom on SMB TAM') shows a global TAM of 46M merchants and $46B, with a TAM of 10M merchants and $10B in the current core geographies. The slide cites AMI Partners as the source.
What revenue figures does the Shopify presentation show for 2012 to 2015?
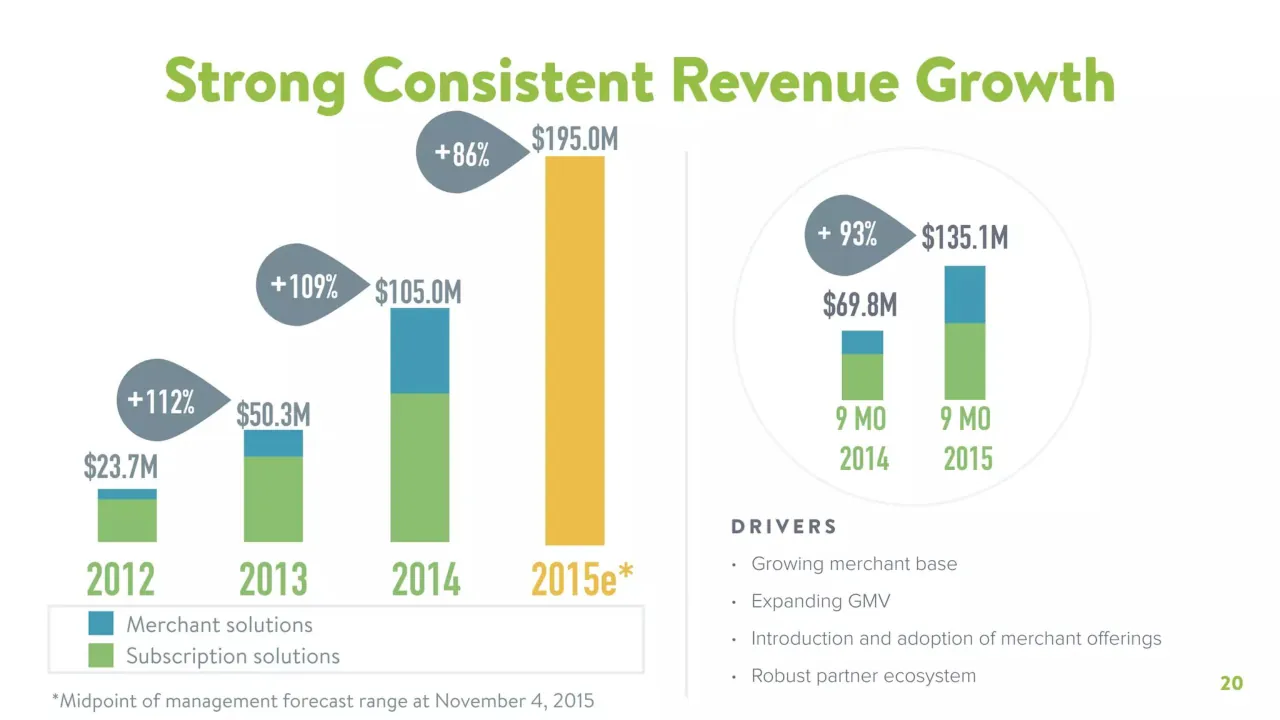
Slide 20 ('Strong Consistent Revenue Growth') shows total revenue of $23.7M in 2012, $50.3M in 2013, and $105.0M in 2014, with 2015e at $195.0M, the midpoint of management's forecast range at November 4, 2015. For the nine months, revenue rose 93% from $69.8M in 9 MO 2014 to $135.1M in 9 MO 2015.
How many slides are in the Shopify deck and how is it structured?
The deck has 29 slides. It opens with headline metrics on slide 1, includes a safe harbour statement on slide 2, covers the market and platform in slides 3 to 11, and presents the financial section on slides 19 to 24. It closes with 'Make commerce better for everyone.' on slide 27, followed by an appendix reconciling non-GAAP figures to GAAP on slides 28 and 29.
What subscription plan prices does the Shopify deck list?
Slide 7 ('Our Market') lists Basic at $29 per month for Entrepreneurs, Professional at $79 per month for SMB, and Unlimited at $179 per month for Enterprise.
Details
- Company: Shopify
- Year: 2016
- Type: Investor presentation
- Industry: E-commerce software
- Pages: 29
Review score: 8 out of 10, Strong
Presentation quality, judged with the SlideDeck Co review heuristic. Ask, evidence and idea merit are not rated here.
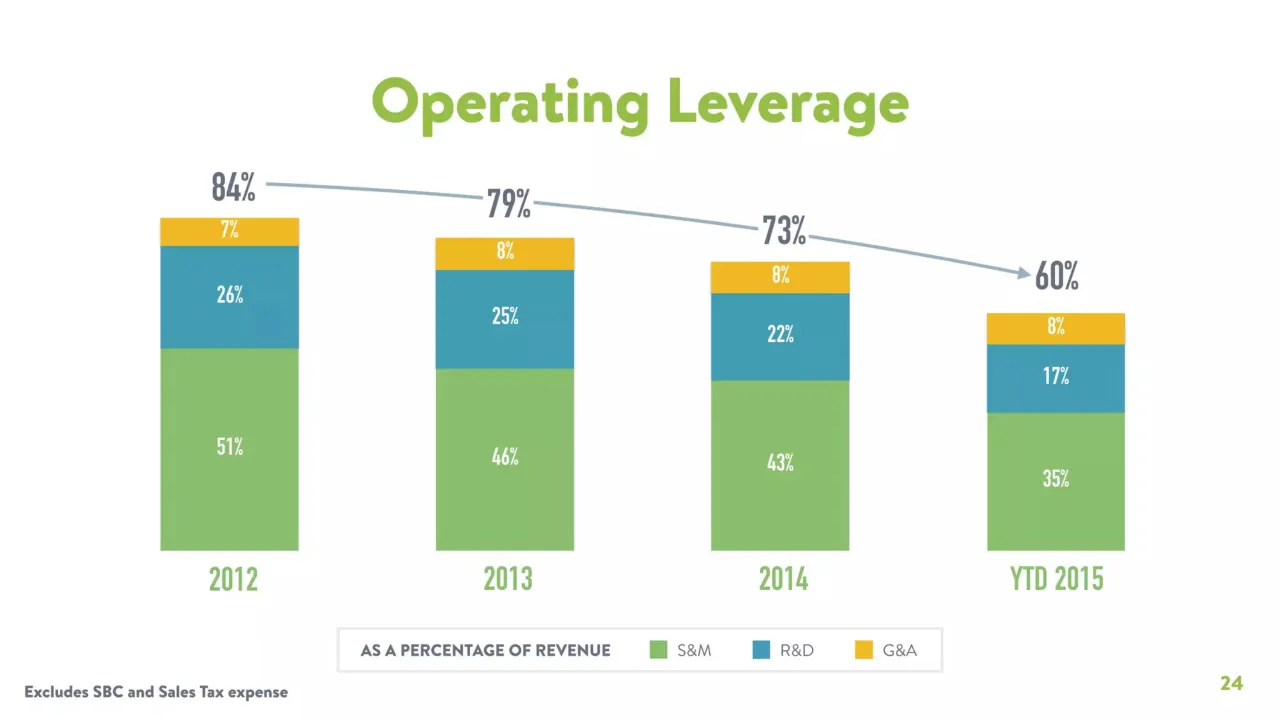
The deck has a clear route from headline metrics (slide 1) through product (4-6), market (7-11), ecosystem (13-17) and numbers (18-24) to growth vectors and close (25-27), and a consistent identity of green titles, flat illustrations and photographic dividers carries it. The financial charts are disciplined: slides 20 and 24 have direct value labels, growth callouts, a legend and a footnote, and the operating leverage arrow on slide 24 makes its point at a glance. Weaknesses remain: the safe harbour on slide 2 is an unreadable text block, slides 12 and 15 have small or unlabelled text and screenshots, slide 26 is a plain bullet list with a lot of empty space, and the Snowdevil story on slides 3-5 delays the business case.
Worth keeping: Keep the consistent green title and chart style, the labelled financial charts on slides 20-24 and the opening metrics on slide 1.
Most useful repair: Shrink or move the safe harbour on slide 2 to the back, and increase the small type on slides 12, 15 and 29 or reduce what is shown.
What would change the score: I would turn slide 26 into a visual or tie each highlight to a number from the preceding slides, and cut slides 8 and 15 to a single clear message each.
Confidence high. 29 of 29 pages inspected on contact sheets, 4 at readable size. Reviewed 2026-11-08. Model-assisted review (claude-sonnet-5-5).
Full text of the slides (29 slides)
Every slide's words and a description of its charts and images, so the deck can be searched and rebuilt. Also available as Markdown.
Slide 1
shopify / 200,000+ / ACTIVE SHOPIFY MERCHANTS / $1.9 BILLION+ / GMV IN Q3 '15
Visuals: Logo: the Shopify logo (green shopping-bag mark with white 'S' and white lowercase 'shopify' wordmark) centred in the upper band. Illustration/photograph of three devices centred over the band boundary: a laptop (back, largest, screen showing a dark-sidebar Shopify dashboard with metric cards and a line/bar chart), a tablet in landscape (middle right, screen showing a grid of apparel product thumbnails with a cart panel listing items and a blue 'Total $442.03' bar), and a smartphone in portrait (front centre-left, screen showing a green 'PAID' order badge with '$10.00' and a note panel). Devices are rendered in black and silver with no visible cropping and sit on a thin silver laptop base. A thin vertical dark grey line divides the two statistics.
Slide 2
Safe Harbour
This presentation contains forward-looking statements that are based on our management’s current estimates, beliefs and assumptions, which are based on / management’s perception of historic trends, current conditions and expected future developments, as well as other factors management believes are appropriate / in the circumstances. Although we believe that the plans, intentions, expectations, assumptions and strategies reflected in these forward-looking statements are / reasonable, these statements relate to future events or our future financial performance, and involve known and unknown risks, uncertainties and other factors / that may cause our actual results to be materially different from any future results expressed or implied by these forward-looking statements. Although the / forward-looking statements contained in this presentation are based upon what we believe are reasonable assumptions, investors are cautioned against placing / undue reliance on these statements since actual results may vary from the forward-looking statements. Forward-looking statements involve known and unknown / risks, uncertainties and other factors, which are, in some cases, beyond our control and which could materially affect our results. These risks are described in / further detail in the section entitled “Risk Factors” and elsewhere in our filings with regulatory agencies. If one or more of these risks or uncertainties occur, or if / our underlying assumptions prove to be incorrect, actual results may vary significantly from those implied or projected by the forward-looking statements. / References to long-term trends in our model are forward-looking and made as of the current date. Nothing in this presentation should be regarded as a / representation by any person that these long- term trends will be achieved and we undertake no duty to update its long-term trends.
We believe that the case studies presented in this presentation provide a representative sample of how our merchants have been able to use various features of / our platform to grow their respective businesses. References in this presentation to increased visits, growth and sales following implementation of our platform do / not necessarily mean that our platform was the only factor contributing to such increases.
To supplement the financial measures prepared in accordance with generally accepted accounting principles (GAAP), we use non-GAAP financial measures that / exclude certain items. Non-GAAP financial measures are not prepared in accordance with GAAP; therefore, the information is not necessarily comparable to other / companies and should be considered as a supplement to, not a substitute for, or superior to, the corresponding measures calculated in accordance with GAAP.
JANUARY 2016
2
Slide 3
Store #1: Snowdevil / CIRCA 2004 / Search / About Us / Shopping Cart / Snowdevil → Snowboards / Hello / Snowboards / Bindings / Goggles / All / Blog / Search... / Blowout Deals / Carbon 900 bindings 180$ / Arbor: Legacy 199$ / Nidecker: Axis / Designed with expertise of Bertrand Denervaud, to perform equally while freestyling and freeriding. The Axis is a higher quality board to learn on at a price that will allow to afford to ride more. With... / $399.99 USD / Read more... / Never Summer: T5 / The T5 © has the ideal / $499.97 USD / MacBook Pro
Visuals: Photograph of a wooden desk against a white painted brick wall. Left: a khaki canvas backpack with brown leather straps and a white rope, with a 'S G' monogram patch and 'DUBLIN' text. Centre: a silver MacBook Pro open to a website screenshot showing a Snowdevil store page: a blue and white Snowdevil logo beside a snowy mountain banner with a red maple leaf, a left navigation column, and two product listings (Nidecker Axis boards shown as red snowboards, and a Never Summer T5 board partly cut off at the bottom of the screen). The screen is white and blue text on white. Left-centre: a black iPhone lying on the desk. Right: an amber glass dome bulb in a walnut block lamp with a red fabric cable, and a stack of green, blue and orange notebooks under a brown leather pouch, one notebook showing a green '3'. Lighting is soft and even, daylight from the left. Dominant colours are white, warm brown, khaki, silver and red. The photo is full-bleed, not cropped, with no overlay or tint.
Slide 4
One Platform, Every Channel, Any Device.
Snow Devil
Online
Snow Devil
Brick-and-Mortar
Snow Devil
Snow Devil
Snow Devil
Snow Devil
Pop-up
OPEN
OPEN
OPEN
OPEN
OPEN
STOREFRONTS
4
Visuals: Flat vector illustration of a street of storefronts in a left-to-right row. The tallest building on the left is labelled Online, a red-orange two-storey shop with four arched windows showing a skateboard, clothes, shelves and a shopper, and an OPEN door. To its right are four shorter, boxed storefronts in teal (labelled Brick-and-Mortar), red (labelled Pinterest), navy blue (labelled facebook) and blue (labelled twitter), each with an OPEN door and a Snow Devil logo. At the far right is an orange Pop-up tent-style banner with a Snow Devil logo over a teal cart area with luggage trolleys and a staff member at a counter. A dashed orange outline box with a plus sign sits at the far right as an empty future storefront. Each building roof has a round cream Shopify-style bag icon with green S and four legs. Characters are scattered: a man waving at the left edge, a woman carrying a box, a man sitting on a teal bench using a phone, a woman in a teal dress, and two people with luggage at the pop-up. Faint teal bushes and a pale cloud sit behind the buildings. Strokes are minimal; shapes are flat fills with thin white window and door frames. Lighting is flat with no shadows; the pavement has thin grey joint lines. The composition is not cropped and the illustration is not boxed.
Slide 5
One Platform, Every Channel, Any Device.
Snow Devil
Powered by Shopify
Payments
Promotions
Analytics
Apps
Inventory
Order Management
Shipping
A single, integrated back office
5
Visuals: Isometric-style illustration of a three-storey-like two-row building cutaway representing a single integrated back office. The roof is dark charcoal with a Snow Devil logo sign above it: a blue rounded-rectangle outline with the words 'Snow Devil' in bold blue italic sans-serif and a devil-horn motif on the letter D. A green pill label 'Powered by Shopify' overlaps the lower right of the sign. The building facade is orange with a grid of rooms: top row contains Payments (shelves with money bags and a pink piggy bank), a vault with two people, Promotions (chalkboard reading 'snowboards shredding winter gear' with two people), Analytics (plant, person and easel with a rising line chart), Apps (dark room with an orange plus-sign tile), and a narrow side panel. Bottom row contains Inventory (shelving with boxes and snowboards and a worker holding a box), Order Management (plant, desk, person at a computer), Shipping (person with a box, clock, bulletin board) and a server rack. A white delivery truck with a cab is on the left side, touching the building. The building sits on a pale blue-grey platform. Callout labels with dark grey dot-and-stem leader lines point to each room. A grey line with a small open circle runs from the platform's right edge down to the caption. Lighting is flat, with warm yellow room lights. Dominant colours: orange #FF6633, dark charcoal #2B2B2B, green #8DC63F, blue #1F5FBF, pale blue #E4EEF7. Not cropped, not full-bleed; drawn on white.
Slide 6
Multi-channel Commerce Platform
A single, simple to use back office
Powering all your sales channels
Everything integrated
6
osComm / Google A / Loyalty App / micros / eBay Ad / Zendesk / Amazon / Chase Pa / Open So
My Store ~ Home ~ Shopify
Warren
https://snowdevil.myshopify.com/admin
shopify
Search
Home
Orders 38
Products
Customers
Reports
Discounts
Online Store
Point of Sale
Apps
Settings
Home
Home / Activity
Changes to help grow your business
Online store
Overview
Blog Posts
Themes
The left navigation has been reorganized to make it easier to manage multiple sales channels. Each channel, for example Online Store, has its own overview and features. Your new home screen gives you notifications and insights to help you run your business.
Sales channels >
1 order needs to be captured and fulfilled. View order
1 order has been paid but needs to be fulfilled. View order
Sales and orders
No sales today
Visuals: Two overlapping browser-window screenshots on the left, with a hand-drawn dark grey brush-stroke arrow. The back window (about x 6 to 47%, y 30 to 62%) is a blurred grey-blue page with a row of nine browser tabs and a blank address bar. The front window (about x 9 to 54%, y 42 to 100%, cropped at the bottom edge) is a Shopify admin home screen: a dark slate left sidebar with white icons and labels, a pale mint-green banner, and a central blue card titled 'Changes to help grow your business' with a white globe icon labelled 'Online store' and three white icons labelled Overview, Blog Posts and Themes. Below the card are two notification rows with blue dots and 'View order' buttons, and a 'Sales and orders' panel. The arrow curves from the top of the back window down to the front window's tab area, pointing at it.
Slide 7
Our Market
shopify plus
Enterprise
$179 PER MONTH
UNLIMITED
SMB
$79 PER MONTH
PROFESSIONAL
Entrepreneurs
$29 PER MONTH
BASIC
7
Visuals: A stacked triangular pyramid with three horizontal tiers, from bottom to top: a dark slate-grey tier labelled 'Entrepreneurs' (base tier, widest), a mid blue-grey tier labelled 'SMB', and a pale grey-blue tier labelled 'Enterprise' at the apex. Each tier is a flat fill with no outline and no gradient. Left of the pyramid are price callouts: '$29 PER MONTH' with 'BASIC' beside the base tier, '$79 PER MONTH' with 'PROFESSIONAL' beside the SMB tier, and '$179 PER MONTH' with 'UNLIMITED' beside the Enterprise tier. A black-and-yellow Shopify Plus logo (wordmark 'shopify' in black bold italic, 'plus' in yellow italic with a small plus sign) sits to the left of the top tier. No photographs, charts or icons.
Slide 8
Entrepreneurship / DID IT WORK? / YES / BUILD / NO / IDEA / Small merchants today can become our largest merchants tomorrow. / Completeness, reduced complexity, and ease of use. / Leaves little room for disruption from below. / 8
Visuals: Diagram (left-centre): a circular cycle of four curved arrows with arrowheads, drawn in medium slate grey #5F6679 with a stroke about 0.5% of slide height and rounded ends. Nodes in order clockwise from top: DID IT WORK? (top, dark bold caps, text only, the arc leaves its right end), NO (right, lower), IDEA (bottom), BUILD (left). Arrow from DID IT WORK? down-right curves to NO with arrowhead pointing down at NO; arrow from NO curves down-left to IDEA with arrowhead pointing at IDEA; arrow from IDEA curves up-left to BUILD with arrowhead pointing up at BUILD; arrow from BUILD curves up-right to DID IT WORK? with arrowhead pointing at it. Separate large arc labelled YES, from the right end of DID IT WORK? rising over the top to point down-right into the pyramid apex-side, arrowhead at the pyramid's upper-left edge, same slate colour and slightly thicker stroke. Pyramid (upper right): a solid triangle of three horizontal bands, apex at top centre, base wide at bottom with small rounded corners; top band very light grey-blue #C3C8D1 (narrowest), middle band mid grey #9CA5B4, bottom band dark slate #646B7C (widest). Bands are equal height, no outlines, no shadow, no labels, flat style. No photographs, icons or logos.
Slide 9
Build-a-Business
2011
TIM FERRISS
2012
SETH GODIN
2013
GARY VAYNERCHUK
2014
DAYMOND JOHN
2015
SIR RICHARD BRANSON
$3.5M
SOLD
$12M
SOLD
$55M
SOLD
$100M
SOLD
$250M
SOLD
“I’m biased, but I think being an entrepreneur is a pretty damn good thing.”
– SIR RICHARD BRANSON
9
Visuals: Five circular portrait photographs, one per column, each a head-and-shoulders crop inside a thick dark grey ring (about 1% of slide width). 1) Tim Ferriss: young man with short reddish-blond hair, looking straight to camera, slight smile, plain light background. 2) Seth Godin: bald man with yellow-framed rectangular glasses, slight smile, head tilted, plain light background. 3) Gary Vaynerchuk: smiling dark-haired man in dark jacket, plain light background. 4) Daymond John: smiling bald man in dark suit, white shirt and dark striped tie, plain light background. 5) Sir Richard Branson: smiling man with long wavy blond-white hair, open collar white shirt, dark jacket, plain light background. Each portrait is cropped to a circle and sits inside its ring. Dominant photo colours are neutral skin tones with white and grey backgrounds. Lighting is soft and even, frontal. No other graphics apart from the quote panel and its pointer.
Slide 10
Headroom on SMB TAM
46M
$46B Global TAM (3)
10M
$10B TAM (3)
Global (1)
Current Core Geographies (2)
Source: AMI Partners
(1) Merchants defined as retailers with less than 500 employees. Includes commercially located businesses, sole proprietorships and home-based businesses
(2) Key geographies include: U.S., Canada, U.K., Western Europe, Australia and New Zealand
(3) Annualized revenue per merchant of approximately $1,000 based on the three months ended March 31, 2015
10
Visuals: Nested circle diagram (proportional-style, not to scale): a large light blue-grey circle labelled '46M' and '$46B Global TAM (3)', with a smaller dark slate circle positioned in its lower-left area labelled '10M' and '$10B TAM (3)'. The large circle is about 33% of slide width in diameter, centred around x 50%, y 50%; the small circle is about 14% of slide width, centred around x 41%, y 60%. Legend at lower left: a light blue-grey square labelled 'Global (1)' and a dark slate square labelled 'Current Core Geographies (2)'. No values beyond those printed; no axes or chart legend beyond the two squares.
Slide 11
Larger Brands
TESLA
MVMT
GOOP by Gwyneth Paltrow
patagonia
The Economist
WIKIPEDIA
Lollapalooza
EMINEM
SUBWAY
Budweiser
STRAVA
GitHub
BlackMilk
LOS ANGELES LAKERS
DODOCASE
TACO BELL
theCHIVE
BlackMilk
DODOCASE
theCHIVE
11
Visuals: Illustration: a large isosceles triangle (pyramid) with a rounded apex, apex at about x 50%, y 24%, base spanning the full slide width from about x 4% to x 96% at the bottom edge. The upper part of the triangle is light blue-grey (about #C2C8D2) and a horizontal band across the lower portion from about y 88% to the bottom is a darker blue-grey (about #9CA5B3). Rows of brand logos from top to bottom: Tesla wordmark; MVMT and GOOP by Gwyneth Paltrow; patagonia, The Economist, WIKIPEDIA, Lollapalooza; EMINEM, SUBWAY, Budweiser, STRAVA, GitHub; BlackMilk, Los Angeles Lakers, DODOCASE, Taco Bell, theCHIVE. Three thin white upward arrows, one under BlackMilk, one under DODOCASE and one under theCHIVE, rise from the bottom band to the bottom row of logos. In the bottom band, grey copies of BlackMilk (with a drip extending down to the slide edge), DODOCASE and theCHIVE are shown. Logos in the upper rows are black, bottom-band logos are mid grey (about #6E7480). All logos are flat, unboxed and unshadowed.
Slide 12
Build-a-Business Success
DODOcase
April 2010 Enters BaB competition
June 2010 Hits 10k orders in first 90 days
July 2010 Wins Shopify's Build A Business Competition
April 2011 First year's sales total more than $3M
June 2011 Expands into retail location
Nov 2011 Obama starts using a DODOcase
2012 Product line expands to iPhone Cases
2013 Facebook store launches
2014 Upgrades to Shopify Plus
2015 22 full-time employees and growing
12
HANDCRAFTED QUALITY, STYLISH FUNCTIONALITY.
Designed by you. Built by craftsmen in San Francisco.
CREATE NOW
CUSTOMIZABLE FOR IPAD AIR, IPAD MINI, IPAD 3/4, IPHONE 6 & NEXUS 7
THE FEW THINGS YOU CARRY, CARRY WELL.
HANDCRAFTED IPAD & IPHONE CASES, LAPTOP SLEEVES, WALLETS, FOLIOS & PAPER NOTEBOOKS MADE IN AMERICA.
CUSTOM CASES / DODOCASE / LEATHERCRAFT / FOLIO / DURABLES
HANDCRAFTED QUALITY. STYLISH PROTECTION. Designed by you. Made by craftsmen in San Francisco.
Visuals: Left: a vertical stack of three full-bleed photographs and screenshots, separated by hard edges. Top: a website screenshot of the DODOcase homepage on a dark brown brick wall background, with a person in a red plaid shirt holding a dark brown leather notebook open, a red CREATE NOW button, and a small dodo bird icon. Middle: a light grey product-page screenshot titled THE FEW THINGS YOU CARRY, CARRY WELL with five product thumbnails labelled CUSTOM CASES, DODOCASE, LEATHERCRAFT, FOLIO, DURABLES. Bottom: an overhead photograph on a wooden table with an orange notebook, a white iPad with a dark cover reading HANDCRAFTED QUALITY. STYLISH PROTECTION., an orange spool of thread, a wooden-handled screwdriver, colored pencils, and fabric swatches, cropped at the bottom edge. Timeline: a vertical grey line with filled green circles marking the main milestones (April 2010, June 2010, 2014, 2015) and hollow grey-outlined circles marking the sub-milestones (July 2010 to 2013). Logo: DODOcase logo with a circular dodo-bird emblem in dark grey outline followed by wordmark.
Slide 13
Partner Ecosystem
App Developers
Agencies
Theme Designers
SHOPIFY APP STORE
SHOPIFY EXPERTS
SHOPIFY THEME STORE
200k
Merchants
13
Visuals: Three grey cloud shapes on the left (App Developers, Agencies, Theme Designers) and one large cloud on the right (200k Merchants with a Shopify bag logo above the numbers). Three browser-style screenshots in the centre column: top, the Shopify App Store page with a dark banner for the rare email app, the heading App Store and a green Create your store now button; middle, the Shopify Experts page headed Here are our top Photography Experts, showing two expert profile cards with thumbnails, a green View Profile button and a filter sidebar; bottom, the Shopify Theme Store page headed Theme Store, with a green Sign up now button, device mockups and several theme thumbnails with blue badges. Arrows: App Developers to App Store (short horizontal arrow), App Developers to Shopify Experts (diagonal down-right), Agencies to Shopify Experts (horizontal), Theme Designers to Shopify Experts (diagonal up-right), Theme Designers to Theme Store (horizontal), App Store to Merchants cloud (diagonal down-right), Experts to Merchants (horizontal), Theme Store to Merchants (diagonal up-right). All arrows are dark slate lines with solid triangular heads, roughly 3 px stroke. The screenshots are flat, unframed, with a faint drop shadow, and are not cropped beyond their browser edges.
Slide 14
Partners
STRATEGIC PARTNERS
Google Domains
UBER
amazon
APP AND INTEGRATION PARTNERS
xero
MailChimp
zendesk
AdRoll
DESIGN AND DEVELOPMENT AGENCIES
bold
DEMACMEDIA
BVACCEL
SDG Spiegel DesignGroup
simplistic
14
Visuals: Logo tiles, 12 in total, all rectangular with square corners and a flat slate-grey fill, each holding one white logo centred in the tile. Row 1 (Strategic Partners): tile 1 'Google Domains' white wordmark, Google in a serif face with 'Domains' in a light sans; tile 2 'UBER' white outlined square U-mark above the spaced word UBER, drawn in slate-grey on a white-outlined square; tile 3 'amazon' white lowercase wordmark with a white smile arrow under it. Row 2 (App and Integration Partners): tile 4 'xero' white wordmark inside a white circle, the wordmark in slate; tile 5 'MailChimp' white script wordmark with a small chimp-hand mark omitted; tile 6 'zendesk' white flower-like mark to the left of white lowercase wordmark with a registered mark; tile 7 'AdRoll' white bold wordmark with a curled tail on the final L. Row 3 (Design and Development Agencies): tile 8 'bold' white bold lowercase wordmark; tile 9 'DEMACMEDIA' white spaced capitals with the word MEDIA in a lighter weight; tile 10 'BVACCEL' white bold capitals; tile 11 'SDG' white bold stylised letters with 'Spiegel DesignGroup' in small white text to the right; tile 12 'simplistic' white lowercase sans wordmark. Thin slate-grey horizontal rules flank each section label.
Slide 15
Leading / Blog
Content / Marketing
Global / In-person / Events
Search / Engine / Marketing
15
shopify
Sell online
Sell in person
Blog
More
Log in
Get started
Articles
Guides
Forums
Success stories
Growth tools
Search articles
How to Sell Online · 98 shares
Acquisition vs. Retention: Should Your Ecommerce / Business Play Offense or Defense?
by Richard Lazazzera · Apr 21, 2015 · 0 comments
Join 48,822 entrepreneurs who / already have a head start.
Get free online marketing tips and resources / delivered directly to your inbox.
Email Address
Get updates
No charge. Unsubscribe anytime.
RESOURCES
How to Start a Business / Resources and tips for getting started
How to Sell Online / Start generating more traffic and sales today
Ecommerce Trends / Industry trends and news that matters
Ecommerce Inspiration / Ideas & examples for improving your business
Physical Retail / Build a profitable and thriving retail business
How to Sell Online · 163 shares
Social Media Marketing: Pinterest for / Business 101
by Lucas Santo · Apr 20, 2015 · 4 comments
Announcements · 1515 shares
Shopify Files For Proposed Initial Public / Offering
by Tobias Lütke · Apr 14, 2015
The Ultimate Guide to Dropshipping
Looking to build a successful online business? This comprehensive guide covers everything / you need to know about running a dropshipping business.
Understanding Dropshipping / Chapter 2 The Supply Chain and Fulfilment Process / Chapter 3 Finding and Working With Suppliers / Chapter 4 Picking Products to Dropship
DROP SHIPPING
Evaluating Sales Channels / Running a Dropshipping Business / The Key Elements of Success
Additional Resources / Glossary / Infographic / About the Authors
sell online
Web Images News Books More Search tools
About 787,000,000 results (0.83 seconds)
Online Selling Website - Fast & Easy eCommerce Solution
www.shopify.com/free-trial
Sell Online Now - Open an Online Store for $15/month
www.volusion.com/SellOnline
Start Selling Online Now - Sell Online Easily - Free Trial
www.americommerce.com/
Sell Products Online - Start & Create an Online Store - Shopify
www.shopify.com/online
Amazon.com : Sell Online - Selling on Amazon
www.amazon.com/sellonamazon
Create Your Free Online Store And Sell Online | Square Sites
Sell Online With Google
www.google.ca/adwords
Start Selling Online
www.weebly.com/StartSellingOnline
Yahoo Stores Free Trial
www.yahoo.com/Stores
Best Sites to Sell Online
www.top10ecommercesitebuilders.com/
Products to Sell Online
www.doba.com/
Start Selling Now
www.setz.com/
Sell My Stuff Ottawa
Visuals: Top-left: a cropped screenshot of the Shopify blog page on a white background with a dark top navigation bar; a large basketball arena photo (backboard and hoop lit by stage lights against a dark blue background), a Pinterest-badged photo of a smiling man in a blue shirt, a solid green tile with a white Shopify logo, and a right sidebar with a dark slate signup panel and resource list. Top-right: a photograph of an open silver laptop on a wooden table, screen showing The Ultimate Guide to Dropshipping infographic with a red box graphic, warm blurred background with a glass bottle and a red-and-white box at right, warm orange-brown tones. Bottom-left: a photograph of a large bright loft-style room with an audience of about 60 people sitting on benches and chairs facing a small panel group at left, overhead lights and exposed ducts, cool white and beige tones with warm wood floor, shot from the back corner at a high angle, full-bleed to the quadrant. Bottom-right: a cropped Google search results screenshot on a light grey background showing the query sell online, with blue sponsored ad blocks and organic results in purple and blue text, a blue Search button and a grey Google logo.
Slide 16
Synonymous with Ecommerce
GOOGLE TRENDS DATA FILTERED FOR USA
2009
2010
2011
2012
2013
2014
2015
“Ecommerce”
“Shopify”
16
Visuals: Line chart titled 'GOOGLE TRENDS DATA FILTERED FOR USA' (letterspaced caps, grey). X-axis: time in years from 2009 to 2015, labels at 2009, 2010, 2011, 2012, 2013, 2014, 2015, with small tick marks at each month; no numeric units printed. Y-axis: no labels or numeric values printed; five faint horizontal gridlines at roughly equal intervals. Series 1 '"Ecommerce"' in light green #8DC152 line, about 4 px thick: starts about mid-high, fluctuates roughly between the upper-middle gridlines, dips to its lowest around late 2010 and early 2012, stays around the middle level through 2013 and 2014, then drifts down slightly to end near 2015 at a level below the peak. Series 2 '"Shopify"' in teal blue #3E9BB8 line, about 4 px thick: starts at the bottom near 2009, rises slowly through 2009 and 2010 staying low, climbs gradually during 2011 and 2012, accelerates sharply from about mid-2013, reaches about the middle in mid-2014, then rises steeply to a peak at the top just after 2015 begins (about 2015.0 to 2015.1). Values are not printed; estimates only: Shopify peak about top gridline, Ecommerce peak about upper gridline in 2009. No highlighted points. Legend below chart centred: green square #8DC152 with label '“Ecommerce”' and teal square #3E9BB8 with label '“Shopify”', grey text. No photographs, logos or icons.
Slide 17
Shopify’s Unique Recipe / Great Technology / Multi-tenant, scalable, / high availability architecture / Beautiful Design / Simple, limitless customization / of gorgeous themes / Robust Ecosystem / Hundreds of Apps, / Themes, and Experts / 17
Visuals: Three screenshots in three columns. (1) Left: a code editor window (dark theme) showing a Ruby file named notify_hipchat.rb with line numbers 1 to 25, a line-numbered code listing with syntax colouring (keywords in orange and pink, strings in green, comments in grey), a file tree in the left pane, and a white window frame with a thin grey border. (2) Centre: a screenshot of Adobe Photoshop on a dark grey interface, showing a Shopify-style web theme mockup. The mockup has a 'Saturdays' logo in script lettering on a white background, the headline 'COLLEGE FOOTBALL NEVER LOOKED SO GOOD.' in bold black condensed caps, a dark oval badge with small white text, a photo of two smiling women in red dresses in a sunlit outdoor setting, and a row of three dress product images on mannequins below. The Photoshop Layers and History panels are visible on the right. (3) Right: an Apple-style aluminium iMac monitor with a black bezel and silver stand, its screen filled with a grid of square app and company icons in rows, each on a coloured tile (blues, oranges, greens, reds, and white). Visible icons row by row: row 1: a cartoon monkey, Jilt, a green swirl, CUREBIT, fetch (digital delivery), a key icon with SA, a green cup, plugin SEO. Row 2: DirectedEdge, a white t-shirt, shipping easy, a W, beetailer, a blue bird, a person icon, POWERREVIEWS. Row 3: vend, HELLO BAR, an IMPORTER icon, Elasso, a green hexagon, a purple plus, a circular icon, a blue C. Row 4: Madify, an orange plus, a blue chevron, MERCHANT, satisfaction, a calculator, LessAccounting, HubSpot, eComm Hub. Row 5 is partly cut off by the bottom edge and shows a WordPress logo, a partly visible icon, and text reading 'zihaba' with other partly visible tiles. No images are cropped other than the monitor screen which is shown whole. Lighting is flat and even; the screenshots have soft drop shadows and no tint.
Slide 18
THE NUMBERS
shopify
18
Visuals: Full-bleed photograph of a bright open-plan office seen from a low vantage point at the bottom left, with a tufted dark sofa and armrest in the foreground left, a white rectangular coffee table, and a cream curved chair. Behind are rows of desks with monitors and black mesh task chairs, and a person seated at a desk on the right side facing a monitor. An ornate crystal chandelier hangs from the exposed ceiling at upper left, with exposed ducts and pipes across the ceiling. The photo is cropped to fill the full slide, lit by soft diffuse daylight, with dominant colours of grey, charcoal and muted white. A dark grey translucent overlay tints the entire photo, darkening it. One logo: the Shopify logo, a green shopping bag with a white 'S' centred at about x 43 y 85, plus the white lowercase wordmark 'shopify' in italic bold sans-serif to its right.
Slide 19
Financial Highlights
I
GROWTH
Strong, consistent growth in Revenue,
MRR and GMV
II
POWERFUL BUSINESS MODEL
Success-based revenue stream built on a
large recurring subscription (SaaS) base
III
LONG-TERM FOCUS
Strong track record of cash management
and investing for the long term
19
Visuals: Three filled grey circles, each about 5.2% of slide width and 9.2% of slide height, with white Roman numerals I, II and III centred inside them (vertical bar glyphs). No photographs, charts or logos. Two thin horizontal divider lines spanning about 9.5% to 89% of slide width.
Slide 20
Strong Consistent Revenue Growth
+86%
$195.0M
+109%
$105.0M
+112%
$50.3M
$23.7M
2012
2013
2014
2015e*
Merchant solutions
Subscription solutions
*Midpoint of management forecast range at November 4, 2015
+ 93%
$135.1M
$69.8M
9 MO
2014
9 MO
2015
DRIVERS
Growing merchant base
Expanding GMV
Introduction and adoption of merchant offerings
Robust partner ecosystem
20
Visuals: Chart: stacked column chart, two series. Series 1 Merchant solutions (blue #3F9BB7) on top of Series 2 Subscription solutions (green #8CC06E) for 2012, 2013 and 2014; the 2015e bar is a single solid gold #E9B93F bar with no split. Bar labels (total revenue): 2012 $23.7M, 2013 $50.3M, 2014 $105.0M, 2015e $195.0M (forecast midpoint). Growth bubbles (grey #7A8E9A teardrop shapes pointing at the bars): +112% (2012 to 2013), +109% (2013 to 2014), +86% (2014 to 2015e). X axis years 2012, 2013, 2014, 2015e* with the 2015e label in gold. No y axis or gridlines are shown. Legend: blue swatch Merchant solutions, green swatch Subscription solutions, inside a light grey outlined rectangle. Approximate segment values are not printed; bar split for 2012 is about 1 part blue and 6 parts green, for 2013 about 4 parts blue and 12 parts green, for 2014 about 12 parts blue and 21 parts green (estimates). Right panel: small stacked column chart, 9 MO 2014 $69.8M (about 3 parts blue over 6 parts green) and 9 MO 2015 $135.1M (about 8 parts blue over 11 parts green), labelled with a +93% grey teardrop bubble pointing at the 2015 total. A pale grey outlined circle encloses this comparison. No highlighted points beyond the gold 2015e bar.
Slide 21
Strong Consistent MRR Growth
$9.8M
$1.1M
85% CAGR
Q1 2012
Q1 2013
Q1 2014
Q1 2015
Monthly Recurring Revenue, or MRR, is calculated at the end of each period by multiplying the number of merchants who have subscription plans with us at the period end date by the average monthly subscription plan fee revenue in effect on the last day of that period, assuming they maintain their subscription plans the following month.
21
Visuals: Column chart of rising MRR, shown as 16 vertical green bars of increasing height, left to right, with no gridlines or y-axis. Start label $1.1M at the first bar's lower-left area and end label $9.8M above the tallest final bar. A pale blue-grey curved arrow (#AFC0D6) runs from near the $1.1M label up over the bars to an arrowhead pointing up-right near $9.8M, with the label 85% CAGR in dark slate grey (#5A6070) sitting on the arc. X-axis labels Q1 2012, Q1 2013, Q1 2014, Q1 2015 appear in green under every fourth bar. Bars are flat-topped rectangles in light green (#8BC06A), no shadows. Values for intermediate bars are not printed; the bars are about evenly spaced, increasing in height roughly from about $1.1M to about $9.8M.
Slide 22
Strong Consistent GMV Growth
+128%
$1.6B
$0.7B
+133%
$3.8B
2012
2013
2014
+102%
$4.9B
$2.4B
9 MO '14
9 MO '15
DRIVERS
• More merchants
• Higher avg. GMV per merchant
• Introduction of POS
22
Visuals: Chart 1 (left): vertical bar chart of GMV in billions of US dollars, no axes or gridlines, with value labels above each bar. Bars are solid green, same width, bottom-aligned at about 88% of slide height. 2012 bar $0.7B (about 16% of the tallest bar's height), 2013 bar $1.6B, 2014 bar $3.8B (tallest). Year labels 2012, 2013, 2014 sit below the baseline. Growth callouts: teardrop-shaped slate-grey pointers, tip aimed at the right-hand value label, showing +128% (between 2012 and 2013, above the 2013 bar) and +133% (between 2013 and 2014, above the 2014 bar). Chart 2 (right, inside a thin pale grey circle): two bars, 9 MO '14 at $2.4B and 9 MO '15 at $4.9B, both green, bottom-aligned, with value labels above and period labels below in green. A teardrop callout reads +102%, tip aimed at the $4.9B label. Bar heights are proportional to the printed values. No legend, no axes, no highlighted points beyond the callouts. Non-text elements are flat graphics with no photographs, logos or icons.
Slide 23
Powerful Business Model / GROSS PROFIT / $18.9M / +94% / $36.9M / +68% / $62.1M / 2012 / 2013 / 2014 / $42.3M / +80% / $75.8M / 9 MO '14 / 9 MO '15 / Excludes SBC expense / 23
Visuals: Vertical bar chart with five green bars and no visible y-axis or gridlines. Series: Gross profit, labelled values: 2012 $18.9M; 2013 $36.9M; 2014 $62.1M; 9 MO '14 $42.3M; 9 MO '15 $75.8M. Growth callouts as grey teardrop pointers: +94% pointing at the 2013 bar, +68% pointing at the 2014 bar, +80% pointing at the 9 MO '15 bar. Bars are sized proportionally to values, with the 2012 bar about 30% of the 2014 bar height. A thin light-grey vertical divider separates the annual group from the nine-month group. No legend. No highlighted points beyond the callouts.
Slide 24
Operating Leverage
84%
79%
73%
60%
7%
8%
8%
8%
26%
25%
22%
17%
51%
46%
43%
35%
2012
2013
2014
YTD 2015
AS A PERCENTAGE OF REVENUE
S&M
R&D
G&A
Excludes SBC and Sales Tax expense
24
Visuals: Stacked column chart of operating expense as a percentage of revenue, four columns labelled 2012, 2013, 2014 and YTD 2015, bottom to top: S&M (green), R&D (teal), G&A (yellow). Column values: 2012 S&M 51%, R&D 26%, G&A 7%; 2013 S&M 46%, R&D 25%, G&A 8%; 2014 S&M 43%, R&D 22%, G&A 8%; YTD 2015 S&M 35%, R&D 17%, G&A 8%. Columns are equal width, flat-topped, no axes or gridlines shown. Above the columns a grey arrow line runs left to right, descending in a gentle curve, from 84% above 2012 through 79% above 2013 and 73% above 2014 to a arrowhead pointing at 60% above YTD 2015. Legend box: label 'AS A PERCENTAGE OF REVENUE' followed by green square S&M, blue square R&D, yellow square G&A. No highlighted points.
Slide 25
Growth Vectors
More International Penetration
More Partners
More Channels
More Solutions
More Merchants & More GMV
25
Visuals: Five ascending column-like stepped shapes, each topped by a pentagon-style peak and a circular icon badge. Column 1 (left): a circular outline with a person silhouette and a plus sign, labelled 'More Merchants & More GMV'. Column 2: a circle containing a pen-and-scissors/tools icon, a delivery truck icon, a dollar-sign money icon and a bar-chart with line icon arranged in a ring, labelled 'More Solutions'. Column 3: a circle containing the Amazon 'a' with arrow, a Facebook 'f' circle icon and a Pinterest 'P' circle icon arranged in a ring, labelled 'More Channels'. Column 4: a circle containing a mobile phone icon and a magnifying glass icon arranged in a ring, labelled 'More Partners'. Column 5 (right): a circle containing a plus sign and a map of Africa and surrounding globe, labelled 'More International Penetration'. Icons are thin grey line drawings. Column bars rise in height from left to right, each made of three horizontal tonal bands of green darkening toward the top.
Slide 26
Investment Highlights
Enormous Opportunity – Multichannel commerce platform targeted at SMB market.
Powerful Business Model – Rapidly growing SaaS and success-based business model.
World-class Product – Well-crafted for simplicity and scalability.
Vast Ecosystem – Engaged and expanding partner ecosystem that is difficult to replicate.
Vision – Product-driven team with a long-term focus.
26
Slide 27
Make commerce better / for everyone.
Visuals: Overhead photograph of a dark wooden desk. Left: a potted green plant (zamioculcas-like leaves) in a white ceramic pot, top-left, about x 2% to 17%, y 18% to 40%. Below it a wooden-sided portable speaker with dark grey edges and three round black buttons, about x 9% to 29%, y 40% to 61%. Centre: a silver MacBook Air-style laptop open, screen showing a web dashboard (dark navy sidebar, white main panel with four stat figures, blue bar chart 'Visitors', green bar chart 'Total Sales', a 'Top Referrals' list), about x 32% to 67%, y 39% to 100%. Lower-left-centre: a black smartphone (about x 21% to 28%, y 67% to 88%) showing a white product list screen with items such as 'Enamel Books' and 'Enamel Dish Set' and small red and blue thumbnails. Right: a tablet with a gold metal frame in landscape-to-portrait tilt, about x 69% to 98%, y 40% to 86%, showing a point-of-sale 'Register' screen with a large '$549.35' total, a list of March sales amounts, and buttons 'Modify' and 'Close'. Bottom-right of the tablet area: a brown wooden pencil lying diagonally, about x 75% to 87%, y 83% to 89%. Lighting is soft overhead daylight with a slight vignette darkening the corners. Dominant colours: dark brown wood, silver, white, black, and the blue and green of the chart screens. The photograph is full-bleed, not boxed or tinted, with no overlay other than the vignette.
Slide 28
APPENDIX
shopify
28
Visuals: Photograph of an office interior seen down a long corridor on the left, with glass partitions, a potted plant at left, and a wooden or grey floor. On the right, through an open doorway, a person with long dark hair sits with their back to the camera in a dark mesh office chair at a desk with a monitor and keyboard; a large pendant lamp hangs from the ceiling above and a round white-and-teal stool sits at the right. The composition is wide and shows the corridor receding toward the vanishing point at upper left-centre. Lighting is low and diffuse with cool ambient tones. Dominant colours are dark slate blue-grey, muted teal and brown-grey. The photo is full-bleed and covered by a uniform dark slate overlay at roughly 70 to 75% opacity. Shopify logo in white wordmark and green bag icon is centred near the bottom.
Slide 29
Reconciliation to GAAP Figures
2012 / 2013 / 2014 / 9 mo ended Sept 30, 2014 / 9 mo ended Sept 30, 2015
GAAP Gross profit / 18,937 / 36,739 / 61,795 / 42,182 / 75,561
add: cost of revenues SBC / 11 / 113 / 259 / 159 / 198
Non-GAAP Gross Profit / 18,948 / 36,852 / 62,054 / 42,341 / 75,759
% of Revenue / 80% / 73% / 59% / 61% / 56%
GAAP Sales and marketing / 12,262 / 23,351 / 45,929 / 33,720 / 47,847
less: Sales and marketing SBC / 66 / 354 / 696 / 451 / 681
Non-GAAP Sales and Marketing / 12,196 / 22,997 / 45,233 / 33,269 / 47,166
% of Revenue / 51% / 46% / 43% / 48% / 35%
GAAP Research and development / 6,452 / 13,682 / 25,915 / 19,296 / 26,181
less: Research and development SBC / 282 / 1,152 / 2,776 / 2,010 / 2,853
Non-GAAP Research and development / 6,170 / 12,530 / 23,139 / 17,286 / 23,328
% of Revenue / 26% / 25% / 22% / 25% / 17%
GAAP General and administrative / 1,737 / 3,975 / 11,566 / 6,286 / 12,770
less: General and administrative SBC / 49 / 147 / 712 / 347 / 1,547
less: Non-recurring sales and use tax expense / - / - / 2,182 / - / 566
Non-GAAP General and administrative / 1,688 / 3,828 / 8,672 / 5,939 / 10,657
% of Revenue / 7% / 8% / 8% / 9% / 8%
GAAP Operating Expense / 20,451 / 41,008 / 83,410 / 59,302 / 86,798
less: Operating SBC / 397 / 1,653 / 4,184 / 2,808 / 5,081
less: Non-recurring sales and use tax expense / - / - / 2,182 / - / 566
Non-GAAP Operating Expense / 20,054 / 39,355 / 77,044 / 56,494 / 81,185
% of Revenue / 84% / 79% / 73% / 81% / 60%
29
Visuals: A single table with 6 columns and 26 rows, arranged in five blocks separated by thin grey-blue shaded divider bands. Header row: blank label cell, then 2012, 2013, 2014, 9 mo ended Sept 30, 2014, 9 mo ended Sept 30, 2015. Block 1 rows: GAAP Gross profit 18,937 / 36,739 / 61,795 / 42,182 / 75,561; add: cost of revenues SBC 11 / 113 / 259 / 159 / 198; Non-GAAP Gross Profit 18,948 / 36,852 / 62,054 / 42,341 / 75,759; % of Revenue 80% / 73% / 59% / 61% / 56%. Divider band. Block 2 rows: GAAP Sales and marketing 12,262 / 23,351 / 45,929 / 33,720 / 47,847; less: Sales and marketing SBC 66 / 354 / 696 / 451 / 681; Non-GAAP Sales and Marketing 12,196 / 22,997 / 45,233 / 33,269 / 47,166; % of Revenue 51% / 46% / 43% / 48% / 35%. Divider band. Block 3 rows: GAAP Research and development 6,452 / 13,682 / 25,915 / 19,296 / 26,181; less: Research and development SBC 282 / 1,152 / 2,776 / 2,010 / 2,853; Non-GAAP Research and development 6,170 / 12,530 / 23,139 / 17,286 / 23,328; % of Revenue 26% / 25% / 22% / 25% / 17%. Divider band. Block 4 rows: GAAP General and administrative 1,737 / 3,975 / 11,566 / 6,286 / 12,770; less: General and administrative SBC 49 / 147 / 712 / 347 / 1,547; less: Non-recurring sales and use tax expense - / - / 2,182 / - / 566; Non-GAAP General and administrative 1,688 / 3,828 / 8,672 / 5,939 / 10,657; % of Revenue 7% / 8% / 8% / 9% / 8%. Divider band. Block 5 rows: GAAP Operating Expense 20,451 / 41,008 / 83,410 / 59,302 / 86,798; less: Operating SBC 397 / 1,653 / 4,184 / 2,808 / 5,081; less: Non-recurring sales and use tax expense - / - / 2,182 / - / 566; Non-GAAP Operating Expense 20,054 / 39,355 / 77,044 / 56,494 / 81,185; % of Revenue 84% / 79% / 73% / 81% / 60%. No chart, logo or photograph. Dash cells show a hyphen for zero.
Download this deck
The hosted PDF of every library deck is free for readers of the SlideDeck Co newsletter. Join with your email and the viewer and download appear here.
Preparing a results presentation or business update of your own? The SlideDeck Co Standard Deck is a slide library for business reviews, updates and plans.







