
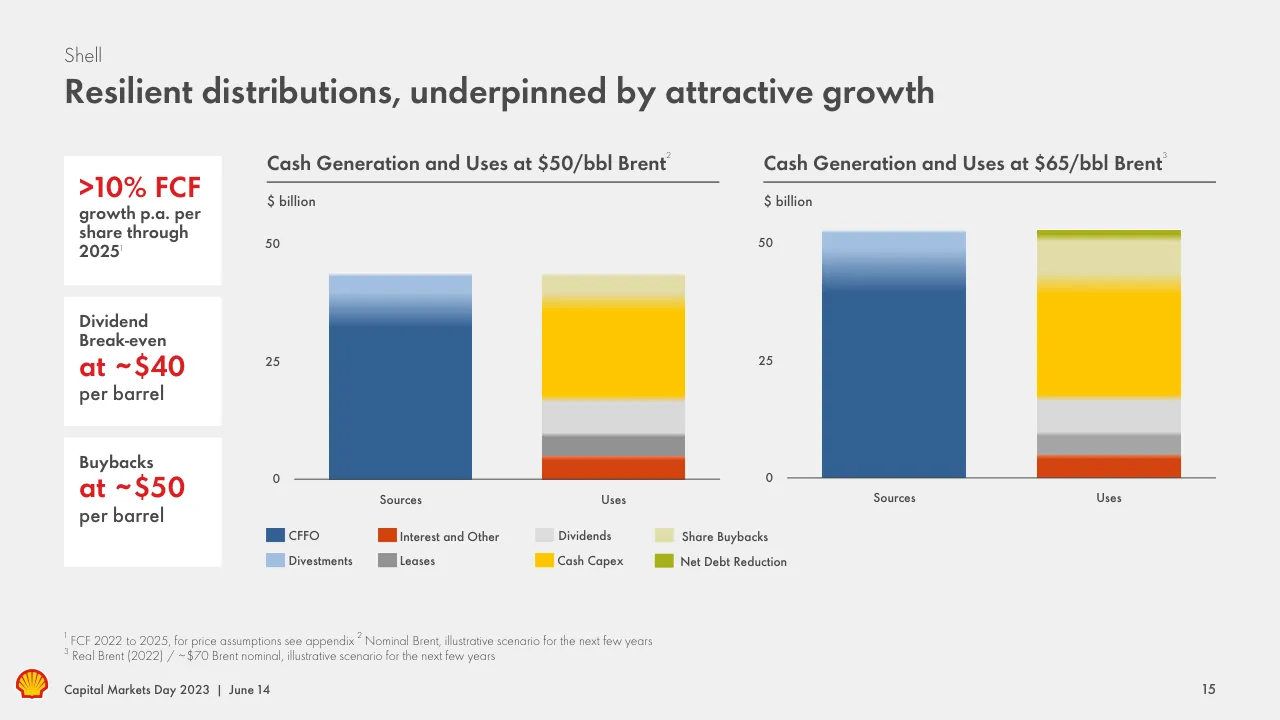
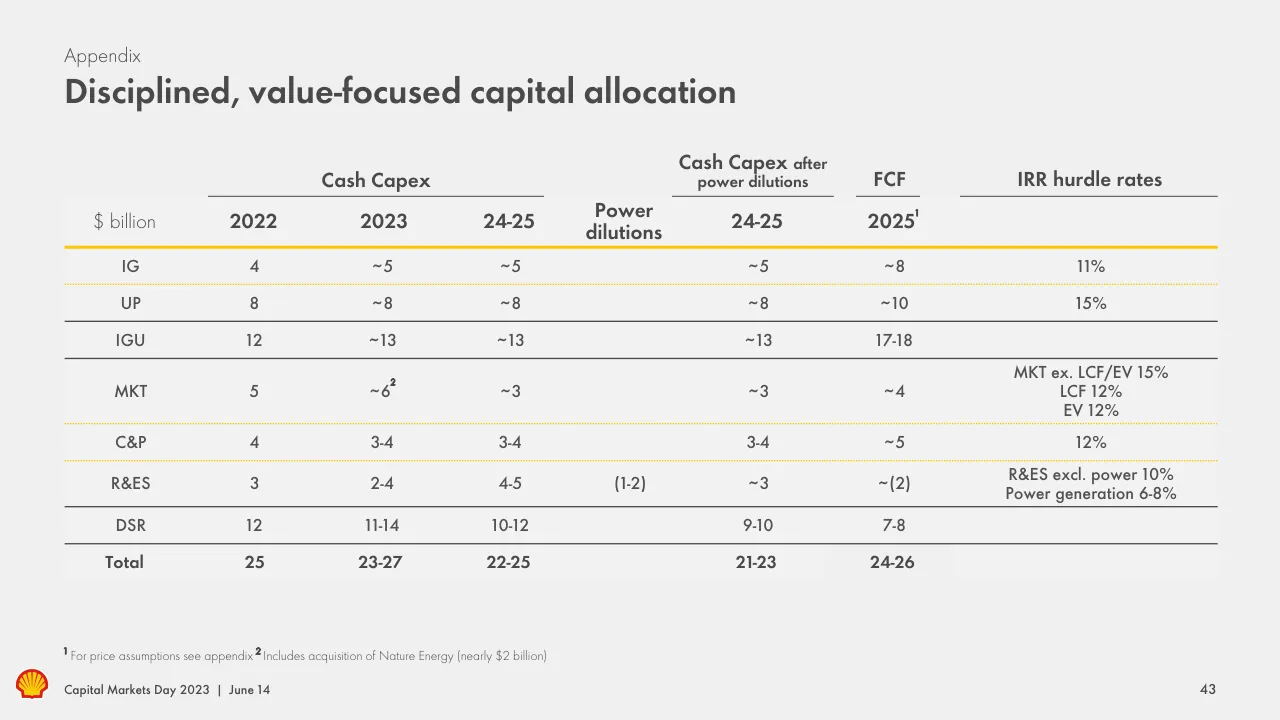
The deck opens with the title 'Performance, Discipline, Simplification' and a purpose statement about delivering more value with less emissions, followed by an agenda for the June 2023 Capital Markets Day and introductions of the speakers. It then sets out the energy transition context, showing an evolving global energy mix and where growth lies in hard-to-abate sectors. A central investment case slide is repeated at the start of each business section and again near the close, which gives the talk a clear through-line. Sections follow for shareholder returns and capital allocation, then Integrated Gas and Upstream, then Downstream and Renewables and Energy Solutions, with each segment covered through its growth targets, capital spend and returns hurdles. The deck closes with key takeaways and Q&A, followed by an appendix of targets, price assumptions, project pipeline, definitions and abbreviations. Slides worth studying include the repeated investment case, the cash generation chart at two Brent prices, the capital allocation table by business, and the project pipeline map.
Slides worth studying
Questions about this deck
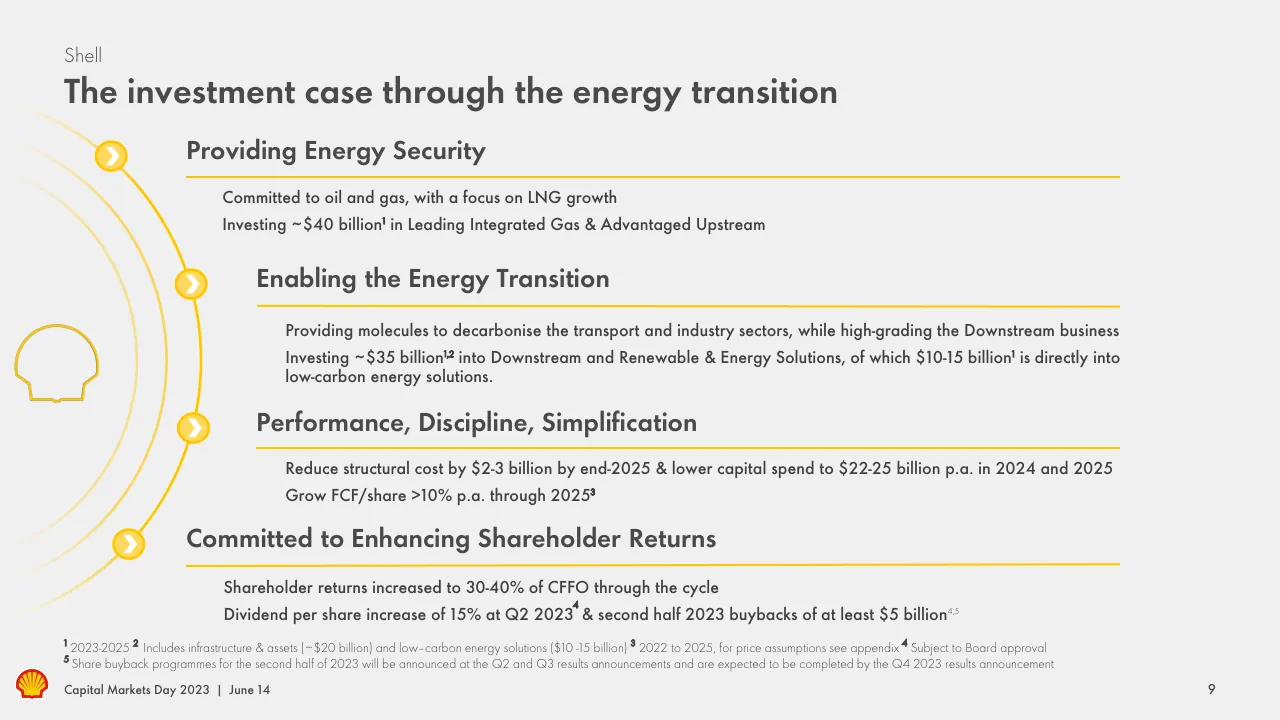
What does the Shell Capital Markets Day 2023 deck say about its investment case through the energy transition?
Slide 9 says Shell is investing ~$40 billion in Leading Integrated Gas & Advantaged Upstream and ~$35 billion into Downstream and Renewable & Energy Solutions, of which $10-15 billion is directly into low-carbon energy solutions. The footnotes give the spend period as 2023-2025.
How many slides does the Shell Capital Markets Day 2023 presentation have?
The deck has 48 pages in total. Slide 1 is the title slide and slide 2 is the agenda for the June 2023 Capital Markets Day.
What does the Shell Capital Markets Day 2023 deck say about shareholder returns?
Slide 16 says Shell aims for enhanced shareholder distributions of 30-40% of CFFO through the cycle and a ~4% progressive dividend annually, subject to Board approval. Slide 13 adds a DPS increase of 15% at Q2 2023 results and a minimum of $5 billion in buybacks for H2 2023.
How is the Shell Capital Markets Day 2023 deck structured?
The deck opens with the agenda on slide 2 and the energy transition context on slides 7 and 8. Sections then cover shareholder returns and capital allocation, Integrated Gas and Upstream (which begins with a section slide at slide 21), and Downstream and Renewables and Energy Solutions, followed by key takeaways and an appendix.
Details
Review score: 7 out of 10, Effective
Presentation quality, judged with the SlideDeck Co review heuristic. Ask, evidence and idea merit are not rated here.
The deck has a clear route: context on the energy transition (7-8), the investment case on slide 9, then a section divider and a repeat of that case at each business section (20, 40), which gives a listener a reliable through-line. The identity is consistent, with the yellow and red palette, a steady title and footer system, and section dividers (4, 21, 30, 39). Execution is competent but uneven. Many business slides (23-28, 32-36) pack three or four small charts, maps and footnotes onto one page, with labels and axes that are tiny and will be hard to read from a room, and slide 3 is a wall of legal text. The charts on slide 15 and the table on slide 43 are clear in structure, but slide 15's blurred gradients on the bars and the dense table weaken precision.
Worth keeping: Keep the repeated investment case with the section dividers, the consistent title and footer system, and the large red KPI call-outs such as those on slide 15.
Most useful repair: Cut or split the crowded multi-chart pages (23, 24, 25, 28, 32) and enlarge axis labels, legends and footnotes so each chart is readable at presentation distance.
What would change the score: I would drop the blurry gradient fills on the bars on slide 15, and replace generic action titles such as 'Leading Integrated Gas and Advanced Upstream' (22, 29) with titles that state the takeaway.
Confidence medium. 48 of 48 pages inspected on contact sheets, 4 at readable size. Reviewed 2026-11-08. Model-assisted review (claude-sonnet-5-5).
Full text of the slides (48 slides)
Every slide's words and a description of its charts and images, so the deck can be searched and rebuilt. Also available as Markdown.
Slide 1
Delivering more value,
with less emissions
Performance, Discipline, Simplification
Capital Markets Day
2023
Visuals: Shell logo (red and yellow shell emblem) centred above the title, at about x 46.3%, y 28.8%, w 7.5%, h 12.4%; the emblem is a red outline shell with yellow radiating fan lines and a small red base point. Decorative 3D illustration of gold/yellow and red geometric shapes: a large gold faceted block and red hexagon with small outlined hexagons at the left edge; a gold and cream stacked dish/bowl with red and yellow circles and small outlined rings at the top right; a gold faceted block with red and outlined diamonds at the right edge; gold pyramids with a glossy sphere, red and yellow triangles at the bottom left; a red triangle at bottom right of centre. Shapes have soft shadows and metallic gradient shading. A large soft white arched/shield-like shape with a lighter grey halo is behind the central text.
Slide 2
Capital Markets Day 2023
Agenda
In person and virtual (ET)
8:30 – 8:35
AM
Welcome – Tjerk Huysinga – EVP Investor Relations
8:35 – 9:30
AM
Wael Sawan – Chief Executive Officer
Sinead Gorman – Chief Financial Officer
9:30 – 9:45 AM
Break
9:45 – 10:15
AM
Zoë Yujnovich – Integrated Gas and Upstream Director 1
10:15 – 10:45 AM
Huibert Vigeveno – Downstream and Renewables & Energy Solutions Director 1
10:45 – 11:00 AM
Break
11:00 – 11:45 AM
Wael Sawan & Team – Key takeaways & General Q&A
In person only
12:00 – 1:30
PM
Lunch
1:30 – 2:30
PM
Break-out sessions
2:30 – 3:30
PM
Reception
1 Effective July 1, 2023
Capital Markets Day 2023 | June 14
2
Visuals: none. Only table-style rules and light grey row bands are present; they are described under design and elements. The Shell logo in the footer is the only graphic.
Slide 3
Cautionary note The companies in which Shell plc directly and indirectly owns investments are separate legal entities. In this presentation “Shell”, “Shell Group” and “Group” are sometimes used for convenience where references are made to Shell plc and its subsidiaries in general. Likewise, the words “we”, “us” and “our” are also used to refer to Shell plc and its subsidiaries in general or to those who work for them. These terms are also used where no useful purpose is served by identifying the particular entity or entities. “Subsidiaries“ ,“Shell subsidiaries” and “Shell companies” as used in this presentation refer to entities over which Shell plc either directly or indirectly has control. Entities and unincorporated arrangements over which Shell has joint control are generally referred to as “joint ventures” and “joint operations”, respectively. “Joint ventures” and “joint operations” are collectively referred to as “joint arrangements”. Entities over which Shell has significant influence but neither control nor joint control are referred to as “associates”. The term “Shell interest” is used for convenience to indicate the direct and/or indirect ownership interest held by Shell in an entity or unincorporated joint arrangement, after exclusion of all third-party interest. This presentation contains forward-looking statements (within the meaning of the U.S. Private Securities Litigation Reform Act of 1995) concerning the financial condition, results of operations and businesses of Shell. All statements other than statements of historical fact are, or may be deemed to be, forward-looking statements. Forward-looking statements are statements of future expectations that are based on management’s current expectations and assumptions and involve known and unknown risks and uncertainties that could cause actual results, performance or events to differ materially from those expressed or implied in these statements. Forward-looking statements include, among other things, statements concerning the potential exposure of Shell to market risks and statements expressing management’s expectations, beliefs, estimates, forecasts, projections and assumptions. These forward-looking statements are identified by their use of terms and phrases such as “aim”, “ambition”, “anticipate“, “believe“, “could“, “estimate“, “expect“, “goals“, “intend“, “may“, “milestones”, “objectives“, “outlook“, “plan“, “probably“, “project“, “risks“, “schedule”, “seek“, “should“, “target“, “will“ and similar terms and phrases. There are a number of factors that could affect the future operations of Shell and could cause those results to differ materially from those expressed in the forward-looking statements included in this presentation, including (without limitation): (a) price fluctuations in crude oil and natural gas; (b) changes in demand for Shell’s products; (c) currency fluctuations; (d) drilling and production results; (e) reserves estimates; (f) loss of market share and industry competition; (g) environmental and physical risks; (h) risks associated with the identification of suitable potential acquisition properties and targets, and successful negotiation and completion of such transactions; (i) the risk of doing business in developing countries and countries subject to international sanctions; (j) legislative, judicial, fiscal and regulatory developments including regulatory measures addressing climate change; (k) economic and financial market conditions in various countries and regions; (l) political risks, including the risks of expropriation and renegotiation of the terms of contracts with governmental entities, delays or advancements in the approval of projects and delays in the reimbursement for shared costs; (m) risks associated with the impact of pandemics, such as the COVID-19 (coronavirus) outbreak; and (n) changes in trading conditions. No assurance is provided that future dividend payments will match or exceed previous dividend payments. All forward-looking statements contained in this presentation are expressly qualified in their entirety by the cautionary statements contained or referred to in this section. Readers should not place undue reliance on forward-looking statements. Additional risk factors that may affect future results are contained in Shell plc’s Form 20-F for the year ended December 31, 2022 (available at www.shell.com/investor and www.sec.gov). These risk factors also expressly qualify all forward-looking statements contained in this presentation and should be considered by the reader. Each forward-looking statement speaks only as of the date of this presentation, June 14, 2023. Neither Shell plc nor any of its subsidiaries undertake any obligation to publicly update or revise any forward-looking statement as a result of new information, future events or other information. In light of these risks, results could differ materially from those stated, implied or inferred from the forward-looking statements contained in this presentation. Also, in this presentation we may refer to Shell’s “Net Carbon Intensity”, which includes Shell’s carbon emissions from the production of our energy products, our suppliers’ carbon emissions in supplying energy for that production and our customers’ carbon emissions associated with their use of the energy products we sell. Shell only controls its own emissions. The use of the term Shell’s “Net Carbon Intensity” is for convenience only and not intended to suggest these emissions are those of Shell plc or its subsidiaries. Shell’s operating plan, outlook and budgets are forecasted for a ten-year period and are updated every year. They reflect the current economic environment and what we can reasonably expect to see over the next ten years. Accordingly, they reflect our Scope 1, Scope 2 and Net Carbon Intensity (NCI) targets over the next ten years. However, Shell’s operating plans cannot reflect our 2050 net-zero emissions target and 2035 NCI target, as these targets are currently outside our planning period. In the future, as society moves towards net-zero emissions, we expect Shell’s operating plans to reflect this movement. However, if society is not net zero in 2050, as of today, there would be significant risk that Shell may not meet this target. This presentation may contain certain forward-looking non-GAAP measures such as cash capital expenditure and divestments. We are unable to provide a reconciliation of these forward-looking non-GAAP measures to the most comparable GAAP financial measures because certain information needed to reconcile those non-GAAP measures to the most comparable GAAP financial measures is dependent on future events some of which are outside the control of Shell, such as oil and gas prices, interest rates and exchange rates. Moreover, estimating such GAAP measures with the required precision necessary to provide a meaningful reconciliation is extremely difficult and could not be accomplished without unreasonable effort. Non-GAAP measures in respect of future periods which cannot be reconciled to the most comparable GAAP financial measure are calculated in a manner which is consistent with the accounting policies applied in Shell plc’s consolidated financial statements. The contents of websites referred to in this presentation do not form part of this presentation. We may have used certain terms, such as resources, in this presentation that the United States Securities and Exchange Commission (SEC) strictly prohibits us from including in our filings with the SEC. Investors are urged to consider closely the disclosure in our Form 20-F, File No 1-32575, available on the SEC website www.sec.gov. Contacts Media: International +44 207 934 5550; USA +1 832 337 4355 3 Capital Markets Day 2023 | June 14
Visuals: Only one non-text element: the Shell pecten logo (red and yellow shell emblem) at the bottom-left corner, next to the footer text. No charts, photographs or illustrations. The hyperlink www.sec.gov is shown in dark brown-red text.
Slide 4
Operationalising
Powering
Progress
Wael Sawan, Chief Executive Officer
Sinead Gorman, Chief Financial Officer
Capital Markets Day 2023 | June 14
4
Visuals: Photograph of a city skyline behind a solar panel array. The skyline includes a tall spire resembling the Chrysler Building, with many glass and stone high-rise towers, shown in the middle and right of the frame. The sky is a clear deep blue that darkens toward the top of the slide. Solar panels fill the foreground across the full width, in dark grey-black tones with silver grid lines. The photo covers the whole slide, is not cropped inside a box, and has a dark navy tint over it that lowers its brightness. A thin yellow (#FFD500) light-bulb outline is drawn over the right half, with a rounded dome from about x 50.8% to 92% and y 15.6% to 83.6%, a narrowed neck and a base with a small semicircular notch at the bottom. The outline is about 0.4% of slide height in stroke width and has no fill. A Shell pecten logo sits at bottom left, red (#DD1D21) with a yellow (#FFD500) top half.
Slide 5
Today’s Speakers
Experienced leadership team
Wael Sawan
-Chief Executive Officer
-With Shell since 1997
Sinead Gorman
-Chief Financial Officer
-With Shell since 1999
Zoë Yujnovich
-Integrated Gas and Upstream Director¹
-With Shell since 2014
Huibert Vigeveno
-Downstream and Renewables & Energy Solutions Director¹
-With Shell since 1995
¹Effective July 1, 2023
Capital Markets Day 2023 | June 14
5
Visuals: Four head-and-shoulders portrait photographs, each boxed with a thin white border, not cropped into circles and not full-bleed. (1) Upper left, Wael Sawan: man with dark slicked-back hair, wire-rimmed glasses, navy suit, light blue shirt and blue tie, closed-mouth slight smile, centred, bottom of frame cut at the jacket. (2) Upper right, Sinead Gorman: woman with long auburn hair, dark rectangular-framed glasses, red top, neutral expression, centred. (3) Lower left, Zoë Yujnovich: woman with long brown hair, beige blazer, smiling with teeth showing, centred. (4) Lower right, Huibert Vigeveno: man with short light brown swept hair, navy suit, white shirt, blue tie, broad smile, centred. All portraits are lit evenly by soft studio light against a pale grey backdrop; dominant colours are grey, navy and skin tones. Behind the content is a decorative pale grey illustration of white 3D tiles and panels with soft grey shadows at top centre, bottom left and bottom right, plus a partial yellow disc cut off at the right edge around mid-height and a pale white dome at lower right. No overlays or tints on the photos. Shell pecten logo at bottom left: red and yellow shield-shaped shell mark.
Slide 6
Shell / Performing with purpose / Our purpose is to / power progress together / by providing more and / cleaner energy solutions / Generating / shareholder value / Respecting / nature / Powering / Powering / Progress / lives / Underpinned by our / core values and / our focus on safety / Achieving / net-zero / emissions / 6 / Capital Markets Day 2023 | June 14
Visuals: Four 3D-style yellow icons, each centred inside a rotated square (diamond) tile, connected by four thin yellow straight lines that form a diamond around the central text. Top icon: a stylised yellow 3D hand over stacked blocks/bars, labelled 'Generating shareholder value'. Left icon: a yellow 3D hexagonal leaf or wheat-like emblem, labelled 'Respecting nature'. Right icon: a yellow triangle containing a light-yellow person silhouette, labelled 'Powering lives'. Bottom icon: concentric yellow circles (pale cream outer disc, yellow middle ring, small yellow inner circle), labelled 'Achieving net-zero emissions'. The top label 'Generating shareholder value' is enclosed in a thin yellow rectangular outline (#FFC600). The icons are lit from above with soft grey shadows, full colour yellow and cream, no photographs. Decorative pale grey 3D blocks at top centre and bottom left, a partial white dome bottom right and a cropped yellow curved shape at right edge.
Slide 7
Shell / Evolving global demand requires a balanced multi-energy transition / World Primary Energy Mix / 100% / 90% / 80% / 70% / 60% / 50% / 40% / 30% / 20% / 10% / 0% / 2020 / 2025 / 2030 / 2035 / 2040 / 2045 / 2050 / Coal / Oil / Natural Gas & LNG / Low Carbon 1 / Hydrocarbons will be critical for energy security for the foreseeable future / LNG will continue to grow and displace coal while low-carbon solutions mature / Low-carbon molecules and electrons will underpin the future energy system / Source: Shell internal analysis of the IPCC Sixth Assessment Report C2 scenarios database hosted by IIASA / 1 Includes renewable electricity, nuclear and biomass / Shell logo / Capital Markets Day 2023 | June 14 / 7
Visuals: Chart: 100% stacked area chart, untitled inside the chart (the heading 'World Primary Energy Mix' sits above it). Y axis: 0% to 100% in 10% steps, unit percent of world primary energy mix. X axis: years 2020, 2025, 2030, 2035, 2040, 2045, 2050 (5-year steps). Series, bottom to top: Coal (grey) about 26% in 2020, about 21% in 2025, about 16% in 2030, about 10% in 2035, about 6% in 2040, about 4% in 2045, about 4% in 2050; Oil (yellow) top edge about 59% in 2020, about 54% in 2025, about 48% in 2030, about 40% in 2035, about 33% in 2040, about 27% in 2045, about 21% in 2050; Natural Gas & LNG (pale yellow) top edge about 83% in 2020, about 79% in 2025, about 74% in 2030, about 65% in 2035, about 57% in 2040, about 46% in 2045, about 40% in 2050; Low Carbon (green) fills from that edge to 100% in every year. Values are estimates read from the chart; none are printed. Legend: horizontal row below the x axis with square swatches: Coal grey, Oil yellow, Natural Gas & LNG pale yellow, Low Carbon green; 'Low Carbon' carries superscript 1 keyed to the footnote. No highlighted points. Callout box: text only, no graphic. Logo: red and yellow Shell shell emblem in the bottom-left corner.
Slide 8
Shell
Prioritise hard-to-abate sectors to capitalise on growth opportunities
Global Energy Demand Mix Today
Others
Residential
Commercial
Industry¹
Transport²
Focus on ~70% of
global energy
demand & majority
of energy emissions
Growth in Shell Addressable Energy Market
$10-12 trillion
Bio
EV
Hydrogen³
CCS
$5-7 trillion
2023
2050
Source: Shell internal analysis of the IPCC Sixth Assessment Report C2 scenarios database hosted by IIASA and IEA World Energy Investment 2022 Report
¹ Industry and feedstock use; ² Aviation, marine, rail & road; ³ Hydrogen plus derivatives
Capital Markets Day 2023 | June 14
8
Visuals: Left: a pie chart titled 'Global Energy Demand Mix Today' with five slices, no printed values and no legend; labels placed around the pie. Industry (about 40% of the pie, from 12 o'clock clockwise to about 4 o'clock) is filled #FFC600 and is the largest slice; Transport (about 24%, lower-right) is filled #FDE26A; Commercial (about 13%, left-lower) is filled #929292; Residential (about 15%, upper-left) is filled #B7B7B7; Others (about 8%, top sliver just left of 12 o'clock) is filled #D9D9D9. Values are estimates, shown as 'about'. Industry is the highlighted slice, with its label in bold. Right: a stacked bar chart titled 'Growth in Shell Addressable Energy Market' with two bars, 2023 and 2050, on a shared horizontal baseline (dark grey #4A4A4A, about 0.1% high, spanning about 55.6% to 79.9% width). There is no y-axis, no tick marks and no gridlines. The 2023 bar (about 57.0% to 62.4% width, top at about 55.4% height, base at 78.3%) is labelled '$5-7 trillion' above it; its lower segment (#FBCE07, about 65.7% to 78.3% height) is darker and its upper segment (#FDE26A) is lighter. The 2050 bar (about 73.2% to 78.6% width, top at about 37.4% height) is labelled '$10-12 trillion' above it; its lower segment (#FBCE07, from about 53.4% height) is darker and its upper segment (#FDE26A) is lighter. Segment values are not printed; estimates are about the bar heights only. A bold yellow arrow (#FFC600, about 3 px stroke, solid head) rises from the top of the 2023 bar's label area to just above the 2050 bar, indicating growth. Beside the 2050 bar is a vertical icon legend with four rows: Bio (a yellow fuel pump with a leaf emblem, #FFC600 with grey outline, about 81.4% x, 37.8% y, about 3.3% wide and 6.3% tall), EV (a yellow-outlined charging post with plug and lightning bolt, about 81.4% x, 47.2% y, 3.3% by 6.0%), Hydrogen (a grey pressure tank with a yellow 'H2' label, about 81.1% x, 60.1% y, 4.5% by 4.4%), and CCS (a grey and yellow industrial plant icon with stacks and a yellow base, about 81.4% x, 68.2% y, 4.1% by 7.2%). Icons are flat, outlined, with no shadows and no photographs.
Slide 9
Shell
The investment case through the energy transition
Providing Energy Security
Committed to oil and gas, with a focus on LNG growth
Investing ~$40 billion1 in Leading Integrated Gas & Advantaged Upstream
Enabling the Energy Transition
Providing molecules to decarbonise the transport and industry sectors, while high-grading the Downstream business
Investing ~$35 billion1,2 into Downstream and Renewable & Energy Solutions, of which $10-15 billion1 is directly into low-carbon energy solutions.
Performance, Discipline, Simplification
Reduce structural cost by $2-3 billion by end-2025 & lower capital spend to $22-25 billion p.a. in 2024 and 2025
Grow FCF/share >10% p.a. through 20253
Committed to Enhancing Shareholder Returns
Shareholder returns increased to 30-40% of CFFO through the cycle
Dividend per share increase of 15% at Q2 20234 & second half 2023 buybacks of at least $5 billion4,5
1 2023-2025 2 Includes infrastructure & assets (~$20 billion) and low-carbon energy solutions ($10-15 billion) 3 2022 to 2025, for price assumptions see appendix 4 Subject to Board approval
5 Share buyback programmes for the second half of 2023 will be announced at the Q2 and Q3 results announcements and are expected to be completed by the Q4 2023 results announcement
Capital Markets Day 2023 | June 14
9
Visuals: Decorative and structural elements only, no chart or photograph. Three concentric pale yellow arcs run down the left edge, fading in opacity from the outermost to the innermost. A yellow outline of the Shell shell emblem sits at about 1 to 8 percent x and 44 to 57 percent y, drawn as a line icon with no fill. A continuous yellow curved line connects four round yellow markers, each about 2.5 percent wide, containing a white right-pointing chevron; the markers sit beside the headings at approximately y 21, 39, 59 and 76 percent. Four full-width yellow horizontal rules sit beneath the first, second, third and fourth headings. A small full-colour red Shell shell logo sits at bottom-left above the footer.
Slide 10
Shell
Our guiding principles
Performance
Discipline
Simplification
Competitive and
consistent execution,
driving returns
Deliver on
commitments and focus
on value creation
Faster decision
making and a high-graded
portfolio
Capital Markets Day 2023 | June 14
10
Visuals: Non-photographic. A thin yellow (#FFCC00) outlined rectangle frames three equal white cards, each with a thin yellow outline. Above each card is a bold dark grey heading with a short yellow horizontal underline, centred over the card. Within the cards, key words are set in bold red (#DD1D21). Footer: the red and yellow Shell shell emblem, bottom-left. No charts, tables, or photographs.
Slide 11
Shell
Well positioned through our world-leading portfolio
Leading
Integrated Gas
Grow leading portfolio position
Focus on operational performance
Advantaged
Upstream
Ensure cash flow longevity
Value over volume approach
Differentiated
Downstream/R&ES
Grow low-carbon molecule sales to transport and industry sectors
High-grade Mobility and Energy & Chemicals parks footprint
Unparalleled trading & optimisation capabilities
~2–4% ROACE uplift p.a. expected
Capital Markets Day 2023 | June 14
11
Visuals: Three small yellow-and-grey line icons above the column headings. Left: an LNG storage tank icon, a tall yellow cylinder with a white droplet and the letters LNG, beside a smaller grey tank outline with white hatching. Centre: an offshore drilling platform icon, a yellow lattice derrick on a grey deck with yellow legs standing in grey wavy sea lines. Right: a fuel pump icon, a yellow pump body with a white display window and a white leaf symbol, with a grey hose curling to the left and a grey base. A yellow bracket outline below the boxes: vertical yellow ends rising from the box bottoms at the outer edges, horizontal yellow lines joining at the baseline, broken around the centred red headline. Shell logo bottom-left: red and yellow shell emblem.
Slide 12
Shell
Delivering more value, with less emissions
Enhanced Distributions
30–40% of CFFO through the cycle
Strong Financial Performance
>10% p.a. FCF per share growth¹
Less Emissions
$10–15 billion² of investment in low-carbon / energy solutions
¹ FCF 2022 – 2025, for price assumptions see appendix ² 2023-2025
Capital Markets Day 2023 | June 14
12
Visuals: Non-text elements: a three-row two-column comparison table drawn as boxes, a vertical divider line and a Shell logo. Rows: (1) left cell 'Enhanced Distributions', right cell '30–40% of CFFO through the cycle' with '30–40%' in red. (2) left cell 'Strong Financial Performance', right cell '>10% p.a. FCF per share growth¹' with '>10% p.a. FCF' in red. (3) left cell 'Less Emissions', right cell '$10–15 billion² of investment in low-carbon energy solutions' with '$10–15 billion²' in red. Left cells are white filled, right cells take the grey slide background. Each cell has a yellow outline. A single yellow vertical line runs from y 23.1% to y 81.0% at x 49.9%, behind the cell borders. Shell logo: red and yellow shell emblem at bottom left, x 1.2% to 3.8%, y 92.9% to 97.1%. No photographs or charts.
Slide 13
Shell
Enhancing distributions through disciplined delivery
Lower Capex
Lower Cost
Higher Shareholder / Distributions
DPS increase of 15% / at Q2 2023 results'
a minimum of $5 billion / buybacks for H2 2023¹²
Cash capex: / $22–25 billion p.a. / for 2024 and 2025
Structural cost reduction: / $2-3 billion by end-2025
Distributing 30–40% of CFFO through the cycle
¹ Subject to Board approval
² Share buyback programmes for the second half of 2023 will be announced at the Q2 and Q3 results announcements and are expected to be completed by the Q4 2023 results announcement
Capital Markets Day 2023 | June 14
13
Visuals: Three equal white rectangles with thin yellow outlines, each holding a text statement, read left to right: Box 1 'Cash capex: $22–25 billion p.a. for 2024 and 2025'; Box 2 'Structural cost reduction: $2-3 billion by end-2025'; Box 3 'DPS increase of 15% at Q2 2023 results' above a blank line and 'a minimum of $5 billion buybacks for H2 2023' with superscript 1,2. A yellow plus sign (#FFC600, solid, about 3.7% wide by 6.5% tall, centred between Box 1 and Box 2 and above the column headings) joins 'Lower Capex' and 'Lower Cost'. A solid yellow block arrow (#FFC600, about 5.3% wide by 7.6% tall, with three thin vertical bars at its tail) points from 'Lower Cost' to 'Higher Shareholder Distributions'. A yellow rectangular frame (#FFC600, thin stroke about 0.3% of width, no fill) surrounds the content, with its bottom edge interrupted behind the caption. Shell logo (red and yellow scallop shell, about 2.5% wide, bottom-left) is the only logo.
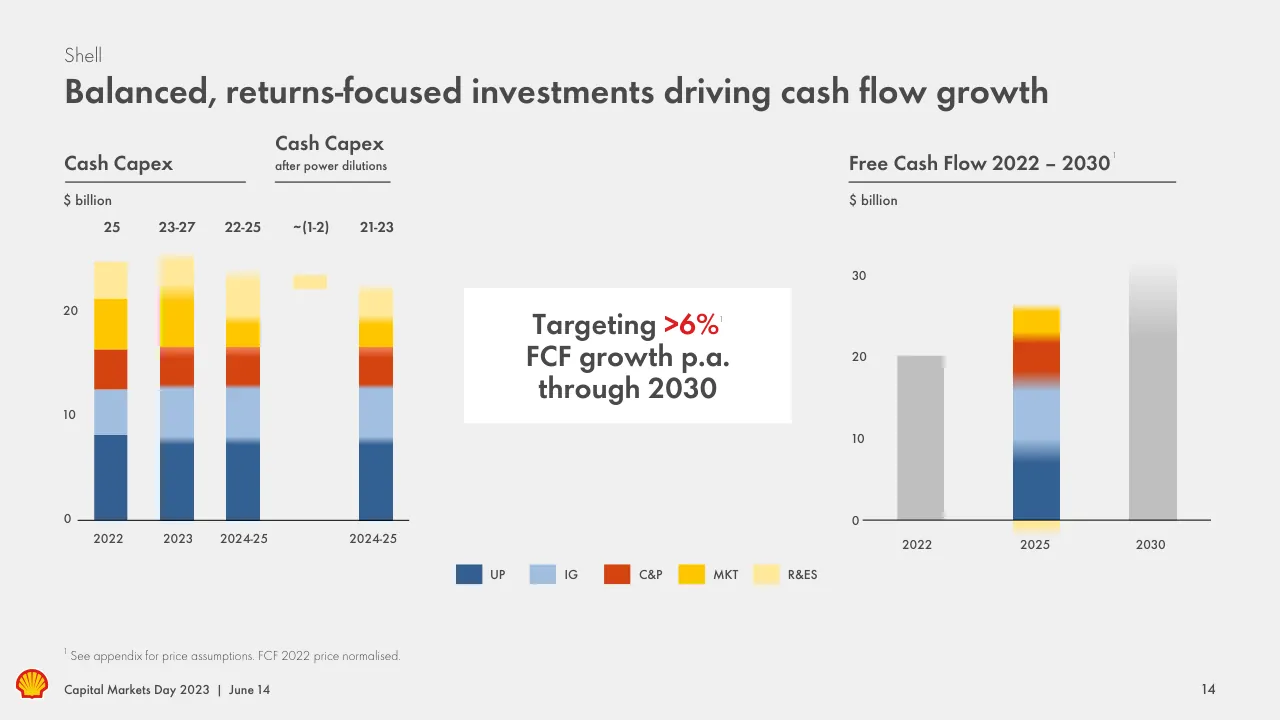
Slide 14
Shell
Balanced, returns-focused investments driving cash flow growth
Cash Capex
Cash Capex
after power dilutions
$ billion
25 / 23-27 / 22-25 / ~(1-2) / 21-23
20
10
0
2022 / 2023 / 2024-25 / 2024-25
Targeting >6%
FCF growth p.a.
through 2030
Free Cash Flow 2022 – 2030 1
$ billion
30
20
10
0
2022 / 2025 / 2030
UP / IG / C&P / MKT / R&ES
1 See appendix for price assumptions. FCF 2022 price normalised.
Capital Markets Day 2023 | June 14
14
Visuals: Two bar charts and one callout. (1) Left chart titled Cash Capex, with a sub-section Cash Capex after power dilutions; y-axis labelled $ billion, ticks 0, 10, 20 (about 0 to 25 range, 0 at baseline y 72.4%). Five stacked columns with category labels above them: 25 (about 24 total, not a printed value), 23-27 (about 25 total), 22-25 (about 24 total), ~(1-2) (a single small pale R&ES segment of about 1 to 2 billion), 21-23 (about 22.5 total); the axis tick labels under the columns are 2022, 2023, 2024-25, a blank slot, and 2024-25. Stacks from bottom: UP dark blue (about 8 for 2022, 2023 and 2024-25 columns, about 7.5 for 2021-23), IG light blue (about 4.5 segments), C&P red-orange (about 3.5 to 4 segments), MKT yellow (about 4.5 to 5 segments on 2023 and 2022, about 2.5 on 2024-25), R&ES pale yellow on top (about 2 to 3). The labelled values are the category labels only; segment values are estimates marked about. Legend: UP, IG, C&P, MKT, R&ES swatches in a row at y 78-81%. (2) Right chart titled Free Cash Flow 2022 – 2030 with superscript 1; y-axis $ billion, ticks 0, 10, 20, 30 (range about -2 to 32; baseline at 0). Three columns: 2022 is a single solid grey column of about 20.3 (about, not printed); 2025 is a stacked column with a small negative R&ES sliver below zero, UP about 7.5, IG about 8.5 more, C&P about 5.5, MKT about 4 on top to about 26.5; 2030 is a tall grey gradient column reaching about 31.5 that fades toward the top. No legend on this chart; the 2022 and 2030 columns are grey (no colour categories), no highlighted points. (3) Callout: a white box reading Targeting >6% with a superscript 1, FCF growth p.a. through 2030, the >6% in red; no chart highlight.
Slide 15
Shell / Resilient distributions, underpinned by attractive growth / >10% FCF / growth p.a. per / share through / 2025 / Dividend / Break-even / at ~$40 / per barrel / Buybacks / at ~$50 / per barrel / Cash Generation and Uses at $50/bbl Brent 2 / $ billion / 50 / 25 / 0 / Sources / Uses / CFFO / Interest and Other / Dividends / Share Buybacks / Divestments / Leases / Cash Capex / Net Debt Reduction / Cash Generation and Uses at $65/bbl Brent 3 / $ billion / 50 / 25 / 0 / Sources / Uses / 1 FCF 2022 to 2025, for price assumptions see appendix 2 Nominal Brent, illustrative scenario for the next few years / 3 Real Brent (2022) / ~$70 Brent nominal, illustrative scenario for the next few years / Capital Markets Day 2023 | June 14 / 15
Visuals: Two stacked-bar column charts, each titled in the heading above it, both with a y axis labelled '$ billion' running 0 to 50 with tick labels at 0, 25 and 50, and two categories on the x axis, Sources and Uses. Left chart, Cash Generation and Uses at $50/bbl Brent (nominal Brent, illustrative scenario): Sources is one stacked bar of CFFO about 0 to 33 and Divestments about 33 to 43.5 in blue tones with a gradient blend at the boundary; Uses stacks from the bottom Interest and Other about 0 to 4.5 (red-orange), Leases about 4.5 to 9.5 (grey), Dividends about 9.5 to 17.5 (light grey), Cash Capex about 17.5 to 36 (yellow), and Share Buybacks about 36 to 43.5 (pale olive); values are estimates, none printed. Right chart, Cash Generation and Uses at $65/bbl Brent (real Brent 2022, about $70 nominal): Sources is CFFO about 0 to 40.5 and Divestments about 40.5 to 53; Uses is Interest and Other about 0 to 5, Leases about 5 to 10, Dividends about 10 to 17.5, Cash Capex about 17.5 to 40.5, Share Buybacks about 40.5 to 51.5 and Net Debt Reduction about 51.5 to 53 (values are estimates, none printed). Both charts have no gridlines and a thin dark baseline. Legend below the left chart in two rows with coloured squares: CFFO dark blue, Interest and Other red-orange, Dividends light grey, Share Buybacks pale olive; Divestments light blue, Leases grey, Cash Capex yellow, Net Debt Reduction olive green. No highlighted points. Three white callout cards on the left: '>10% FCF growth p.a. per share through 2025' with a superscript 1, 'Dividend Break-even at ~$40 per barrel', 'Buybacks at ~$50 per barrel'. Shell logo (red and yellow shell emblem) bottom-left.
Slide 16
Shell
A pragmatic approach to capital allocation
Enhanced
Shareholder Distributions
Balanced Capital Allocation
Disciplined
Investment
30–40% of CFFO
through the cycle
~4% progressive dividend annually¹
Cash Capex:
$22–25 billion p.a.
for 2024 and 2025
Strong
Balance Sheet
AA credit metrics
through the cycle
¹Subject to Board approval
Capital Markets Day 2023 | June 14
16
Visuals: Diagram with one central icon and three outgoing arrows. Shapes: (1) a yellow filled circle (#FFC600, about 5.7% wide) with a white outline line-art balance scale icon centred in it, placed above the central heading. (2) Three curved yellow (#FFC600) arrows with arrowheads, drawn as thick strokes of about 2 to 3 px, starting just below 'Balanced Capital Allocation' and ending at the left box's right side, at the bottom centre (pointing down to the document icon), and at the right box's left side. (3) Left line icon: a grey outlined open hand (#D9D9D9 fill, #4A4A4A outline) holding up a small yellow coin with a dollar sign and a sprouting green-less leaf line, with a yellow block at the hand's right end; placed between the left arrow and the left box area. (4) Centre-bottom line icon: a grey document with folded top-right corner (#D9D9D9 fill, #4A4A4A outline) showing a bold dark dollar sign and three yellow bar-chart bars at the bottom-left. (5) Right line icon: a grey outlined hand holding a yellow coin with a dollar sign above a stack of three yellow coins (#FFC600), placed beside the right arrow. No chart axes, photographs or logos apart from the footer Shell mark.
Slide 17
Shell
On track with planned operational emissions reductions
Net Scope 1 & 2 Emissions
(mtpa CO₂e)
83
-30%
-50%
e.g. CCS / Electrification / Portfolio action
58
41
0
2016
2022
2030
2050
Halving Scope 1 & 2 emissions by 2030¹
Achieving near-zero methane emissions by 2030
Eliminating routine flaring from Upstream operations by 2025²
Carbon budget allocation based on value and impact
¹ Reduction from 2016 baseline for assets under our operational control
² Provided previously announced intention to exit from onshore Nigeria is realised
Capital Markets Day 2023 | June 14
17
Visuals: Vertical bar chart titled 'Net Scope 1 & 2 Emissions', y-axis unit '(mtpa CO₂e)' (million tonnes per annum of CO₂ equivalent). No value axis or gridlines are printed, so bar heights are approximate. Four category positions on a horizontal baseline at about y 80.9 percent: 2016 bar labelled 83, about 83 units high, grey #BFBFBF; 2022 bar labelled 58, about 30 percent shorter than 2016, grey #BFBFBF; 2030 bar labelled 41, yellow #FFC600 and highlighted; 2050 has no bar, only the value label 0 sitting on the baseline. Annotations: a yellow bracket line (#FFC600) joins the tops of the 2016, 2022 and 2030 columns, with a short yellow vertical from the bracket to the 2016 bar top and vertical leaders down to two red-outlined boxes. The '-30%' box (red #DD1D21 bold text, white fill, yellow #FFC600 outline) has a yellow arrow pointing down to the 2022 bar. The '-50%' box has a yellow line running down through the label 'e.g. CCS / Electrification / Portfolio action' to a yellow arrow pointing at the 2030 bar value. No legend. Highlighted point: the 2030 bar. Dominant colours: light grey, mid grey, yellow and red accents on white and dark grey text.
Slide 18
Shell / Supporting customer decarbonisation to achieve net-zero / Investing $10–15 billion 1 / in low-carbon energy / solutions / Focusing on the hard- / to-abate Transport and / Industry sectors / Advocating for policies / supporting and enabling / the energy transition / 2022: 40%+ of R&D spend / on proving and scaling / innovative technologies / [four photographs] / Committed to Net-Zero by 2050 / 1 2023-2025 / Capital Markets Day 2023 | June 14 / 18
Visuals: Four square-cornered rectangular photographs of equal height (about 32% of slide height) arranged in a row, each about 20.4% of slide width, with gaps of about 2.8% between them. Photo 1 (x 5.0): white cylindrical LNG storage tank with red-and-yellow Shell pecten logo and green 'Shell BioLNG Blend' lettering, against a pale blue sky, with silver cylindrical vessels at lower left; shot from a low upward angle, daylight, mostly white and blue with silver accents. Photo 2 (x 28.2): aerial top-down view of a container ship with multicoloured stacked containers on dark teal sea, its white wake curving at upper left, and a large white airliner wing and fuselage crossing the lower foreground with its shadow on the water; dominant colours teal, white and red. Photo 3 (x 51.3): three business people in dark suits in a bright office by a window; a grey-haired man seen from behind at left shakes hands with a smiling woman with curly hair, while another smiling woman with auburn hair stands beside them; warm, soft daylight with a light haze, dominant colours dark grey, black and cream. Photo 4 (x 74.5): close view of a light grey-and-blue industrial flow meter with a round display window and small control buttons, mounted on a steel pipe above a yellow label reading 'waterstof', against a dark grey pipework background; dominant colours grey, blue and yellow. Also a small full-colour Shell pecten logo (red and yellow) at bottom left, about x 2.5 y 93 w 2.5 h 3.
Slide 19
Shell
Leveraging technical capabilities and an empowered workforce
Technology and Innovation Leadership
Exceptional People
19
Capital Markets Day 2023 | June 14
Visuals: Two photographs and one logo. (1) Left photograph, boxed rectangle with square corners, 44.1% by 46.6% of the slide: a close-up, over-the-shoulder view of a person with short dark hair and a pink collared shirt in the lower-left foreground, looking at a large dark monitor. The screen shows a 3D seismic or geological reservoir model: a bright green gridded surface with stepped layers in orange, red, blue, yellow and dark blue at the edges, dark red fault planes, and thin orange-red vertical well lines ending in small blue dots. A second monitor edge is visible at the right, and cables run along a light desk at the bottom. Lighting is warm, ambient and soft, with the monitor glow providing the brightest areas. Dominant colours are black, green, dark red, orange and skin tones. Framing is a medium close-up, cropped at the left and bottom edges, not full-bleed, no overlay or tint. (2) Right photograph, boxed rectangle with square corners, 44.1% by 46.6% of the slide: a mosaic of about 30 small candid photographs in roughly 5 rows and 5 to 6 uneven columns, butted edge to edge with no gaps. Subjects are workers and staff: men and women in hard hats (yellow, white, blue, green), red, orange and hi-vis coveralls, safety vests, a woman in a yellow hard hat smiling, a man in a blue hard hat, men in business shirts at a desk, and offshore and industrial settings with rigs, pipework and a sea horizon. Images are individually cropped to head-and-shoulder or waist-up framing, with natural daylight, and the dominant colours are orange, red, white, grey and blue. A faint darkening is applied to the mosaic. (3) Shell logo, bottom-left: the red and yellow Shell pecten (scallop shell) emblem, approximately 2.5% by 4.2% of the slide, colours red #DD1D21 and yellow #FFD500.
Slide 20
Shell / The investment case through the energy transition / Providing Energy Security / Committed to oil and gas, with a focus on LNG growth / Investing ~$40 billion¹ in Leading Integrated Gas & Advantaged Upstream / Enabling the Energy Transition / Providing molecules to decarbonise the transport and industry sectors, while high-grading the Downstream business / Investing ~$35 billion¹² into Downstream and Renewable & Energy Solutions, of which $10-15 billion¹ is directly into low-carbon energy solutions. / Performance, Discipline, Simplification / Reduce structural cost by $2-3 billion by end-2025 & lower capital spend to $22-25 billion p.a. in 2024 and 2025 / Grow FCF/share >10% p.a. through 2025³ / Committed to Enhancing Shareholder Returns / Shareholder returns increased to 30-40% of CFFO through the cycle / Dividend per share increase of 15% at Q2 2023⁴ & second half 2023 buybacks of at least $5 billion⁴˒⁵ / ¹ 2023-2025 ² Includes infrastructure & assets (~$20 billion) and low–carbon energy solutions ($10 -15 billion) ³ 2022 to 2025, for price assumptions see appendix ⁴ Subject to Board approval / ⁵ Share buyback programmes for the second half of 2023 will be announced at the Q2 and Q3 results announcements and are expected to be completed by the Q4 2023 results announcement / Capital Markets Day 2023 | June 14 / 20
Visuals: Decorative and structural visuals only, no chart, table or photograph. (1) Three concentric yellow arc strokes at the far left edge, drawn as thin lines that fade from saturated yellow near the inner arc to pale yellow and transparency at the outer edge, forming a fan opening to the left. (2) A yellow outline of the Shell scallop shape at the left, stroke only with no fill, roughly 7.6% wide by 13.5% high. (3) Four yellow circular markers, each containing a white right-pointing chevron, sitting on a single yellow curved connector line that runs from the top marker down to the bottom marker and bulges slightly right; the markers sit beside the headings of sections 1 to 4. (4) Four yellow horizontal rules, one under each heading, spanning the text column. (5) A small full-colour Shell pecten logo in red and yellow at bottom-left.
Slide 21
Integrated Gas and Upstream / Zoë Yujnovich / Capital Markets Day 2023 | June 14 / 21
Visuals: Full-bleed photograph of a city skyline (Manhattan-style towers, including a pale Chrysler-style spire and a Empire State-style spire at left) seen across a foreground row of dark solar panels. Daylight with a clear deep-blue sky, a dark navy tint laid over the whole photograph to darken it. Dominant colours: navy blue sky, grey-beige and tan towers, near-black solar panels. A second photograph, the same skyline, is cropped into a light-bulb silhouette on the right (about 48% to 95% across, 15% to 85% down), with a bright yellow (#FBCE07) outline stroke of about 0.4% of slide height around the bulb outline, including a narrow notched base and a small curved bottom bump. The bulb outline overlaps the solar panels at its base. Shell logo (red and yellow shell emblem) at bottom left.
Slide 22
Integrated Gas and Upstream / Leading Integrated Gas and Advantaged Upstream / Global leader in LNG and GTL with / strong cash generation through the cycle / Best-in-class Deepwater complemented / by resilient Conventional Oil & Gas / Production longevity underpinned by / stable liquids and growth in gas / Shell total production (mboe/d) / 4 / 3 / 2 / 1 / 0 / 2019 / 2022 / 2025 / 2030 / #1 / in global LNG sales / & GTL product sales / 11 Mtpa / LNG capacity / additions by 2030 1 / $30 per bbl / Average / Break-even price / >500 kboe/d / New production / by 2025 / ~$13 billion p.a. / Cash capex in IG & UP / through 2030 / >20 years / Commercial / resource life / 1 Includes North Field South project in Qatar. Transaction is subject to completion. / Capital Markets Day 2023 | June 14 / 22
Visuals: Photograph 1 (left column, boxed, rectangular, no rounding): dusk view of an LNG facility with large white spherical LNG storage tanks, long cream pipe racks and a walkway running diagonally, lit by warm amber lights against a dark blue sky and sea horizon; dominant colours cream, white, navy and amber; full-frame, not cropped. Photograph 2 (centre column, boxed): offshore deepwater platform with four yellow column legs and a grey topside module with a red crane, standing on blue-grey sea with three small tugboats around it, under a pink and violet dusk sky; full-frame, not cropped. Chart (right column): vertical bar chart titled 'Shell total production (mboe/d)'; y-axis 0 to 4 in steps of 1 (no unit label beyond the title); x-axis years 2019, 2022, 2025, 2030; four yellow #FFC600 bars: 2019 about 3.7, 2022 about 2.9, 2025 about 2.6, 2030 about 2.8 (the 2030 bar top is faded by a gradient overlay so its value is approximate); no legend, no data labels, no highlighted points; grey baseline. KPI cards: six white boxes each with a large red figure and grey label; no icons. Footer logo: Shell pecten logo, red with yellow outline, bottom-left.
Slide 23
Integrated Gas and Upstream / Value over volume driving significant / and resilient cash delivery / Consistently delivering highest unit CFFO excluding working capital amongst peers / Integrated Gas and Upstream CFFO excluding working capital per boe ($) / 60 / 50 / 40 / 30 / 20 / 10 / 0 / 2019 / 2020 / 2021 / 2022 / Peer range / Shell / Global leader in LNG: continued growth until the 2030s / LNG sales (Liquefaction + Purchased Volumes) (mtpa) / +20-30% / 80 / 60 / 40 / 20 / 0 / 2019 / 2022 / 2025 / 2030 / Liquefaction volumes / Purchased Volumes / Simplified portfolio: foundation for stable liquids production / Shell liquids outlook (mboe/d) / Stable at ~1.4 mboe/d / 2.0 / 1.5 / 1.0 / 0.5 / 0.0 / 2019 / 2022 / 2025 / 2030 / Liquids production / Divestments / 1 Peer range comprises BP, TotalEnergies, ExxonMobil, Chevron. Based on external reporting and Shell internal analysis including peer working capital assumptions. Excludes spot purchases and Russia sourced volumes. / 2 Purchased volumes outlook for 2030 includes uncontracted volumes and volumes subject to project FID. / 3 Includes total Shell liquids (Oil and NGLs) production (Upstream, Integrated Gas, and Oil Sands). / 4 Includes production from completed and intended divestments: Baram Delta (Malaysia), Malampaya (Philippines), Aera (USA), Salym (Russia), SPDC (Nigeria) / Capital Markets Day 2023 | June 14 / 23
Visuals: Four charts and one line. (1) Left: line-and-band chart titled Integrated Gas and Upstream CFFO excluding working capital per boe ($). Y axis 0 to 60 in $ per boe, gridlines none, tick labels 0,10,20,30,40,50,60. X axis 2019, 2020, 2021, 2022 with a dark baseline. Series Peer range shown as a grey band (#B7B7B7) with about 22 top and 18 bottom in 2019, about 12 top and 9 bottom in 2020, about 26 top and 18 bottom in 2021, and about 39 top and 37 bottom in 2022 (estimates; no values printed). Series Shell shown as a red-orange line (#E03C1F, about 3 px) with about 27 in 2019, about 17 in 2020 (minimum), about 32 in 2021 and about 58 in 2022 (estimates; no values printed). Legend below: grey square labelled Peer range with superscript 1, and red line labelled Shell. No highlighted points. (2) Upper right: stacked column chart titled LNG sales (Liquefaction + Purchased Volumes) (mtpa), Y axis 0 to 80 mtpa, tick labels 0,20,40,60,80, no gridlines. X categories 2019, 2022, 2025, 2030. Series Liquefaction volumes (yellow #FFC000, bottom segment) about 33 in 2019, about 29 in 2022, about 30 in 2025, about 38 in 2030. Series Purchased Volumes (grey #B7B7B7, top segment) about 27 in 2019, about 29 in 2022, about 26 in 2025, about 35 in 2030. Totals about 60, 58, 56, 73 (estimates; no values printed). The 2030 column tops have a faded light gradient overlay (small raster image). A dark arrow (#4A4A4A, about 2 px, arrowhead at right) runs from about x 70, y 20 up to about x 90, y 15, labelled +20-30%. Legend below: yellow square Liquefaction volumes, grey square Purchased Volumes. (3) Lower right: column chart titled Shell liquids outlook (mboe/d) with superscript 3, Y axis 0.0 to 2.0 mboe/d, tick labels 0.0,0.5,1.0,1.5,2.0, no gridlines. X categories 2019, 2022, 2025, 2030. Series Liquids production (blue #336094): about 1.85 in 2019, about 1.4 in 2022, about 1.42 in 2025, about 1.3 in 2030 (estimates). Series Divestments shown as blue diagonal hatch stacked above: about 0.1 in 2022 (top about 1.5) and about 0.15 in 2030 (top about 1.45, fading). Annotation Stable at ~1.4 mboe/d printed above the bars. Legend below: solid blue square Liquids production, hatched blue square Divestments with superscript 4. (4) Shell logo icon at bottom-left: a yellow shell (pecten) mark with red outline.
Slide 24
Integrated Gas and Upstream / Longevity underpinned by strong / resource base in high-margin / Deepwater and LNG / Most resources in high-margin LNG and Deepwater / Commercial resources (2P+2C) in billion boe 1 / 40 / 30 / 20 / 10 / 0 / ExxonMobil / Chevron / Shell / TotalEnergies / BP / LNG + GTL / Deepwater / Conventional/Oil Sands / Shales / Exploring where we have differentiated capabilities / Focused on heartlands with no frontier exploration entries after 2025 / De-risking / Namibia / at pace / New projects will deliver >500 kboe/d by 2025 / Peak production of projects start-ups (Shell Share kboe/d) / Conventional Oil & Gas / Deep water / Integrated Gas / Whale / Vito / Mero 2, 3, 4 / Oman Block 10 / Timi / Penguins / Arrow / Jerun / Pierce / Other Projects / Total / >500 kboe/d / 1 Peer Source: Wood Mackenzie; Shell based on internal analysis using Wood Mackenzie segmentation / Capital Markets Day 2023 | June 14 / 24
Visuals: 1) Stacked column chart titled 'Commercial resources (2P+2C) in billion boe' with a superscript 1. Y axis 0 to 40 in steps of 10, unit billion boe; X axis categories ExxonMobil, Chevron, Shell, TotalEnergies, BP; no data labels printed. Segment values are estimates marked about: ExxonMobil about 6 (LNG+GTL), 4.5 (Deepwater), 13 (Conventional/Oil Sands), 11.5 (Shales), total about 35; Chevron about 5, 3.5, 6, 12, total about 26.5; Shell about 8 (LNG+GTL, bright yellow #FFC600 and the only fully saturated bar), 4.5 (Deepwater), 8 (Conventional/Oil Sands), 3.2 (Shales), total about 23.5; TotalEnergies about 3.8, 3.7, 12, 1.8, total about 21; BP about 2.5, 3, 5.5, 3.5, total about 14.5. Legend below the x-axis, left to right: LNG + GTL (dark #444444 square with yellow diagonal), Deepwater (mid grey #929292 square with yellow diagonal), Conventional/Oil Sands (light grey #B8B8B8 square with pale yellow diagonal), Shales (pale grey #DBDBDB square with cream diagonal). 2) Gantt-style chart titled 'Peak production of projects start-ups (Shell Share kboe/d)' with no value axis and no printed values; rows top to bottom: Whale, Vito, Mero 2, 3, 4, Oman Block 10, Timi, Penguins, Arrow, Jerun, Pierce, Other Projects, Total. Each row has one bar stepping diagonally down and right: Whale deep water (mid blue) from about x 57.0 to 60.6; Vito deep water to about 63.9; Mero 2, 3, 4 deep water to about 67.5; Oman Block 10 integrated gas (dark blue #336094) to about 70.4; Timi conventional (pale blue) to about 72.2; Penguins conventional to about 73.7; Arrow integrated gas to about 74.9; Jerun conventional to about 76.1; Pierce conventional to about 77.2; Other Projects conventional from about 77.1 to 83.8, deep water to 86.2, integrated gas to 89.5; Total conventional from 57.0 to 69.2, deep water from 69.2 to 82.0, integrated gas from 82.0 to 89.5, with the label '>500 kboe/d' to its right. Legend at top right: Conventional Oil & Gas (pale blue #D1DFEF), Deep water (#749ECF), Integrated Gas (#336094). Vertical axis line dark grey at x about 57. 3) Schematic world map in flat light grey (#B8B8B8) with countries highlighted in yellow #FFC600 (the United States, Brazil, the UK and Norway area, Turkey and Caspian region, Nigeria, and small areas in Africa, Oman, and Asia). A red dot (#D52B1E) sits on southwest Africa at about x 63.8, y 33.2. A dotted dark grey line runs from the red dot right to about x 76.7 and then diagonally up to a dark grey dot at about x 79.8, y 27.2 on the photo. 4) Photograph at about x 79.6 y 15.3 w 15.5 h 22.2 (boxed, not full bleed, square corners): an offshore drilling rig and vessels on dark water under a sunset sky of orange, gold and grey clouds; the rig is at left-centre, silhouetted, with warm backlighting; composition is landscape with the sea in the lower third. A pale translucent panel (#F5F4EE at 62% opacity) covers the right part of the photo from about x 86.7 and carries the text 'De-risking Namibia at pace'. 5) Shell logo (red and yellow shell emblem) at bottom left.
Slide 25
Integrated Gas and Upstream / Integrated Gas value chain generates significant value / Optimising portfolio for demand in / Northern Hemisphere winter / Net term volumes1 / IG Adjusted Earnings trending with / LNG price markers / $ billion / $/boe / 8 / 6 / 4 / 2 / 0 / 100 / 80 / 60 / 40 / 20 / 0 / Q1 2021 / Q2 2021 / Q3 2021 / Q4 2021 / Q1 2022 / Q2 2022 / Q3 2022 / Q4 2022 / Q1 2023 / Managing cross-commodity / exposure for value / LNG sales in 2022 (mtpa) / 80 / 60 / 40 / 20 / 0 / Sources / Deliveries / Adj. Earnings / Adj. Earnings, Avg 4Q rolling / 70% JCC-3/30% JKM (RHS) / Short-term 'spot' / Gas hubs (e.g. NBP, HH) / Oil-linked / Cost-based2 / ~2–4% IG ROACE uplift per annum expected through LNG Trading & Optimisation / 1 (Term Purchases - Term Sales), excludes JV marketed volumes / 2 Cost based volumes are exposed to LNG JV costs, typically a mix of operational cost and cost to purchase natural gas / Capital Markets Day 2023 | June 14 / 25
Visuals: Three charts. (1) Left: smooth blue (#336094) line chart titled 'Net term volumes' with footnote 1; x-axis categories Q1 2021 to Q1 2023 (9 points, labels rotated about 45 degrees); no y-axis labels or values printed; line rises from about the middle at Q1 2021, dips to a trough at Q3 2021, peaks at Q1 2022, dips to a second trough at Q3 2022, then rises to its highest end point at Q1 2023; values are not printed, so levels are estimates only. (2) Middle: combo chart titled 'IG Adjusted Earnings trending with LNG price markers'. Left axis '$ billion' 0 to 8 in steps of 2; right axis '$/boe' 0 to 100 in steps of 20 (RHS). Series: grey (#B7B7B7) bars 'Adj. Earnings', about values Q1 2021 1.6, Q2 2021 1.7, Q3 2021 1.9, Q4 2021 4.1, Q1 2022 4.2, Q2 2022 3.8, Q3 2022 2.4, Q4 2022 6.0, Q1 2023 4.9; blue (#336094) line 'Adj. Earnings, Avg 4Q rolling', about rising from 1.0 at Q1 2021 to about 4.3 at Q1 2023; red (#E31E24) line '70% JCC-3/30% JKM (RHS)' about rising from about 35 at Q1 2021 to a peak of about 82 at Q4 2022 and about 74 at Q1 2023. No data labels printed. Legend below chart, three rows with line or bar swatches. (3) Right: 100% not used; stacked bar chart titled 'LNG sales in 2022 (mtpa)', y-axis 0 to 80 in steps of 20, no axis title. Two stacked columns: 'Sources' with segments bottom to top: Cost-based (#336094) about 30, Oil-linked (#FFC600) about 10, Gas hubs (light yellow #FFE699) about 20, Short-term 'spot' (#B7B7B7) about 6, total about 66; 'Deliveries' with segments bottom to top: Oil-linked (#FFC600) about 38, Gas hubs about 13, Short-term 'spot' about 16, total about 67 (no Cost-based segment). Columns are about 10% of the slide wide and sit on a dark baseline axis. Legend below in a two-by-two grid: Short-term 'spot', Gas hubs (e.g. NBP, HH), Oil-linked, Cost-based2. No highlighted points.
Slide 26
Integrated Gas and Upstream
Integrated Gas volumes will grow through end of decade
Growing equity volumes through selective investment
Liquefaction volumes (mtpa)
+25-30%
40
30
20
10
0
2022
2025
2030
Projects under construction
Country
Shell share %
LNG capacity
100%, mtpa
LNG Canada Train 1-2
Canada
40
14
NLNG Train 7
Nigeria
26
7.6
North Field East Expansion
Qatar
25
8
North Field South Expansion
Qatar
9.4
16
Contracting for reliable and competitive offtake
Purchased volumes¹ (mtpa)
+15-25%
40
30
20
10
0
2022
2025
2030
Producing facilities
Planned or under construction facilities
3rd party offtake agreements
Country
Project status
LNG offtake
mtpa
Venture Global – Calcasieu Pass
USA
Producing
2.0
Mozambique LNG
Mozambique
Under construction
2.0
Venture Global – Plaquemines LNG phase 1
USA
Under construction
1.9
Mexico Pacific – Train 1+2
Mexico
Pre-FID
2.6
Mexico Pacific – Train 3
Mexico
Pre-FID
1.1
Energy Transfer – Lake Charles
USA
Pre-FID
2.1
Next Decade – Rio Grande LNG
USA
Pre-FID
2.0
Volumes exclude spot purchases and Russia sourced volumes.
¹ Includes 3rd party purchases and purchases from JV’s in addition to liquefaction volumes. Outlook for 2030 includes uncontracted volumes and volumes subject to project FID
² Subject to transaction completion
Capital Markets Day 2023 | June 14
26
Visuals: Left: vertical bar chart titled Liquefaction volumes (mtpa), y-axis 0 to 40 in steps of 10 (mtpa), x-axis categories 2022, 2025, 2030; single series in dark blue #336094 with no printed data labels: 2022 about 29 mtpa, 2025 about 29 mtpa, 2030 about 37 mtpa (the 2030 bar has a thin light-blue gradient cap at its top, about 2 mtpa); a black arrow with open arrowhead runs from lower-left above the 2022 bar to upper-right above the 2030 bar, labelled +25-30%. Right: stacked vertical bar chart titled Purchased volumes (mtpa) with superscript 1, y-axis 0 to 40 in steps of 10, x-axis 2022, 2025, 2030; series Producing facilities in mid grey #B7B7B7 and Planned or under construction facilities in light grey #D9D9D9 stacked on top; about values: 2022 producing about 28 and total about 29; 2025 producing about 22 and total about 26; 2030 producing about 17 and total about 37; a light gradient fade at the top of the 2030 bar; legend below the x-axis with grey square swatches; arrow from lower-left to upper-right labelled +15-25%. Tables: left table with columns Projects under construction, Country, Shell share %, LNG capacity 100%, mtpa; the LNG capacity column has a light grey #D9D9D9 fill; four rows as listed in text. Right table with columns 3rd party offtake agreements, Country, Project status, LNG offtake mtpa; the LNG offtake column has light grey fill; seven rows as listed in text. Logo: Shell pecten logo in bottom-left, red #DD1D21 with yellow #FFD500 shell shape.
Slides 27 to 48 continue in the full text file.
Download this deck
The hosted PDF of every library deck is free for readers of the SlideDeck Co newsletter. Join with your email and the viewer and download appear here.
Preparing a results presentation or business update of your own? The SlideDeck Co Standard Deck is a slide library for business reviews, updates and plans.







