
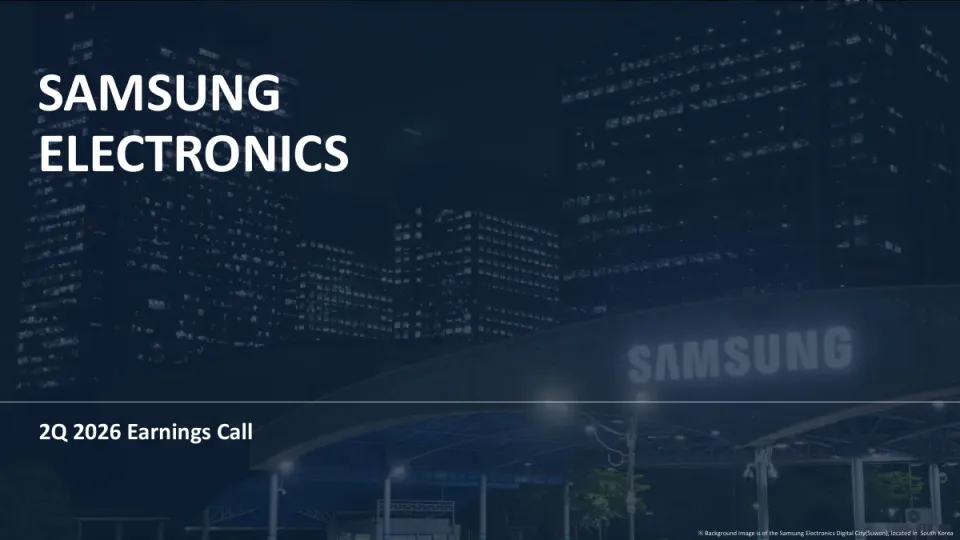
The deck opens with a title slide for the 2Q 2026 earnings call, followed by a standard investor disclaimer on forward-looking statements and an index. The index lists the presenters, the quarter's financial results, results and outlook by business segment, and appendices. A speaker slide groups the presenters under Device Solutions and Device eXperience, with the investor relations head as moderator. The results section presents consolidated headline figures for revenue, operating profit and R&D investment, with quarter-on-quarter and year-on-year changes. A breakdown of sales and operating profit by business segment follows. Each segment then gets a paired slide showing quarterly results on the left and a second-half outlook on the right, with a small bar chart for the quarterly trend. Segments covered include Memory, System LSI and Foundry, the display business, mobile and networks, and visual display, home appliances and Harman. The appendices provide the full income statement, segment tables, a summary financial position and a cash flow summary. The deck closes with a thank-you slide that repeats the title imagery.
Slides worth studying
- Slide 5: Three large headline figures across the top, each with quarter-on-quarter and year-on-year changes beneath, give the audience the key results before any detail.
- Slide 7: The Memory slide pairs a compact bar chart of segment sales and operating profit with a results and outlook column, a repeatable template used across the business pages.
- Slide 6: A segment table with a doughnut chart of sales mix and short bullet updates per unit packs a lot of comparison into one page while keeping it scannable.
Details
- Company: Samsung Electronics
- Year: 2026
- Type: Investor presentation
- Industry: Electronics
- Pages: 16
The hosted copy of this deck is being prepared. Newsletter readers will find the download here.
Review score: 7 out of 10, Effective
Presentation quality, judged with the SlideDeck Co review heuristic. Ask, evidence and idea merit are not rated here.
The deck has a clear, repeatable route (disclaimer, index, speakers, headline results, segment overview, paired results and outlook per segment, appendices), and slides 5 and 6 make the headline numbers easy to find with large figures and color-coded changes. The segment slides (7 to 11) are consistent and readable, but they pack dense bullet text beside small bar charts, and the charts use mixed series (stacked sales plus a line for operating profit) without clear labeling, so the trend takes effort to read. Slide 6 has a heavy donut with a black slice that clashes with the blue palette, and the appendix tables (12 to 15) are tiny and dense for a live call, though they work as reference. The disclaimer and index slides (2, 3) rely on small or low-contrast text over photo backgrounds.
Worth keeping: Keep the large headline KPI layout on slide 5, the consistent Results/Outlook split with a bar chart on each segment slide, and the highlighted 2Q 26 column in the appendix tables.
Most useful repair: Raise contrast and size of the disclaimer and index text on slides 2 and 3, and recolor the black donut slice on slide 6 to fit the blue palette.
What would change the score: I would add one takeaway headline per segment slide and label the chart series directly, so the audience reads the message before the bullets.
Confidence high. 16 of 16 pages inspected on contact sheets, 4 at readable size. Reviewed 2026-11-10. Model-assisted review (claude-sonnet-5-5).
Full text of the slides (16 slides)
Every slide's words and a description of its charts and images, so the deck can be searched and rebuilt. Also available as Markdown.
Slide 1
SAMSUNG
ELECTRONICS
2Q 2026 Earnings Call
※ Background image is of the Samsung Electronics Digital City(Suwon), located in South Korea
Visuals: Full-bleed night photograph of the Samsung Electronics Digital City (Suwon): tall office towers with many lit windows on the left and centre, a curved roofed canopy with the illuminated SAMSUNG sign on its face at lower right, blue-lit structure and light poles along the bottom, trees at lower left and right. The photo is covered by a navy tint (#10253F at about 75% opacity), giving a dark, desaturated blue look with the lit windows still visible. Composition is wide, horizon-level at about two-thirds height, not cropped. A thin white horizontal line runs across the full width at about 74.5% height.
Slide 2
Disclaimer
The financial information in this document are consolidated earnings results based on K-IFRS.
This document is provided for the convenience of investors before the external review on our 2Q 2026 financial results is completed.
The review outcomes may cause some parts of this document to change.
This document contains "forward-looking statements" - that is statements related to future, not past events.
In this context, "forward-looking statements" often address our expected future business and financial performance
and often contain words such as "expects" "anticipates" "intends" "plans" "believes" "seeks" or "will".
"Forward-looking statements" by their nature address matters that are to different degrees uncertain.
For us, particular uncertainties which could adversely or positively affect our future results include:
· The behavior of financial markets, including fluctuations in exchange rates, interest rates, and commodity prices
· Strategic actions including dispositions and acquisitions
· Unanticipated dramatic developments in our major businesses including DX (Digital eXperience) and DS (Device Solutions)
· Numerous other matters at the national and international levels which could affect our future results
These uncertainties may cause our actual results to be materially different from those expressed in this document.
※ Background image is of a Semiconductor Fab in South Korea
SAMSUNG
Visuals: A dimmed, blurred-looking photograph of a semiconductor fabrication facility fills the whole slide behind all content. It shows rows of tall grey and white production equipment and machinery across the upper half, with overhead structures and pipework, and at the bottom centre a worker in a blue cleanroom suit and hood is partly visible, cropped at the bottom edge. Lighting is flat and even; dominant colours are slate blue and grey, with small red, green and yellow indicator accents on equipment. The photo is full-bleed, not boxed, and is overlaid by a solid dark navy tint #10253F at 80% opacity, which strongly darkens it. The SAMSUNG wordmark is a white logo at top-right, about 10.9% wide, with no other icons or charts.
Slide 3
Index
PRESENTERS
2Q 2026 FINANCIAL
RESULTS
RESULTS & OUTLOOK
BY BUSINESS SEGMENT
APPENDICES
※ Background image is of DSR (Device Solutions Research) Tower of Samsung's Hwaseong Campus in South Korea
Visuals: Background photograph: a daytime view of several tall glass-curtain-wall office towers (the Samsung DSR Tower, Hwaseong Campus, South Korea) rising from the lower left and centre to a clear blue sky, with low hills and a dense city of mid-rise buildings and roads on the right. The towers fill the frame, with the tallest tower on the right and a roofline cut off at the top of the frame, so it is full-bleed and not boxed. Lighting is flat daylight, the glass reads as blue-grey. Dominant colours are navy #10253F and steel blue. The photo has a navy overlay (fill #10253F at 75% opacity) that darkens and mutes it. Four white vertical divider lines, one before each index item. One SAMSUNG wordmark logo in white at top right.
Slide 4
Earnings Call
Speakers
Moderator
Sooncheol Park
Jaejune Kim
Jason Shin
Sukchae Kang
Charles Hur
Daniel Araujo
Hun Lee
Daniel Oh
EVP
EVP
EVP
EVP
EVP
VP
EVP
EVP
Chief Financial Officer
Memory
System LSI
Foundry
SDC
Mobile eXperience
Visual Display (VD)
Investor Relations
Device Solutions (DS)
Device eXperience (DX)
Visuals: Eight head-and-shoulders portraits of men in business attire, cut out from their backgrounds and placed on the navy background with no frames or borders. Left to right: Sooncheol Park (grey suit, cream open-neck shirt, black-rimmed glasses, neutral expression, cropped at the waist); Jaejune Kim (navy suit, white shirt, black-rimmed glasses, neutral expression); Jason Shin (grey houndstooth jacket, white shirt, smiling, no glasses); Sukchae Kang (navy checked jacket, white shirt, round wire-rim glasses, smiling, grey hair); Charles Hur (black suit, light blue shirt, thin wire-rim glasses, neutral expression); Daniel Araujo (black suit, white shirt, no glasses, neutral expression); Hun Lee (beige checked jacket, cream shirt, neutral expression, no glasses); Daniel Oh (navy suit, white shirt, round wire-rim glasses, neutral expression). Lighting is soft and even, the framing is consistent, and the portraits are cropped at the chest or waist. Two bracket-shaped lines: one under Jaejune Kim through Sukchae Kang, one under Daniel Araujo and Hun Lee, each with short vertical ends pointing up. Horizontal white rules sit under Speakers and Moderator and a thin white rule runs across the top. A SAMSUNG wordmark in white bold capitals sits top right. Background is a dark navy photographic texture with soft blue light streaks.
Slide 5
2Q 2026 Results
Based on consolidated financial statements
Revenue
Operating Profit
R&D Investment
KRW
171.5T
KRW
89.5T
KRW
16.0T
QoQ
+28%
YoY
+130%
QoQ
+56%
YoY
+1,814%
QoQ
+41%
YoY
+78%
EPS KRW10,849 (QoQ KRW3,726↑, YoY KRW10,112↑) *Common
Achieved another record-high performance through technology leadership and swift
response to market changes
Despite ongoing global economic volatility and geopolitical uncertainties, our differentiated technological
competitiveness, built over years in our core businesses, was clearly reflected in our strong performance
Secured future growth engines through continuous technology innovation while further
solidifying our global leadership
5
Visuals: Three KPI cards, no charts. Card 1 Revenue: label Revenue, figure KRW 171.5T, QoQ +28% and YoY +130% shown as green pill badges. Card 2 Operating Profit: label Operating Profit, figure KRW 89.5T, QoQ +56% and YoY +1,814% in green pill badges. Card 3 R&D Investment: label R&D Investment, figure KRW 16.0T, QoQ +41% and YoY +78% in green pill badges. Each card has a solid dark blue #003399 rounded bar along its top edge, about 0.8% of slide height thick and about 26% of slide width wide. Green badges are pale mint #ECFDF5 rectangles with rounded corners behind dark green #047857 bold figures. The EPS line sits centred beneath the cards. A small blue 3D cube or grid icon sits to the left of the headline in the bottom panel. A blue bold arrow glyph (Wingdings arrow) sits to the left of the closing statement. No photographs.
Slide 6
Results by Business Segment
SAMSUNG
2Q 2026 Sales by Business Segment
KRW Trillion
Total
171.5
Trillion
127.5
48.0
7.5
4.6
Total Operating Profit (OP)
89.5 T
QoQ + 56%
OP Margin
52.2%
QoQ + 9.4%p
Earnings Per Share
*Highest level among global tech companies
KRW 10,849 (Common), KRW 10,849 (Preferred)
Business Unit
Sales (QoQ)
Op. Profit (% of revenue)
Key Updates
DS
Semiconductor
127.5 T
+56%
89.2 T
70%
• Another record-breaking memory earnings by proactively addressing AI Server demand
• Achieved all-time high bit sales for both DRAM and NAND
• S.LSI: Record-high first-half revenue despite soft mobile market
• Foundry: Higher utilization, stronger advanced node demand
DX
Mobile / TV /
Home Appliances
48.0 T
-9%
-0.8 T
-2%
• Grew revenues YoY based on sales of premium AI products
• Operating results declined due to rising component costs
• Strengthened the portfolio of high value-added products, optimized processes, and improved operational efficiency to minimize decline in profits
SDC
Display
7.5 T
+12%
0.7 T
9%
• QoQ performance improved driven by strong sales of smartphone OLED panels
• Revenue increased as large-size Gaming monitor market expanded
Harman
Automotive /
Lifestyle
4.6 T
+19%
0.4 T
9%
• Earnings improved based on expanded auto segment and consumer audio sales
* DS: Device Solutions, DX: Device eXperience, SDC: Samsung Display Corporation
* Harman’s sales and operating profit figures are based on Samsung Electronics’ fiscal year and acquisition related expenses are reflected.
* Sales and operating profit of each business stated above reflect the organizational structure as of December 2021 and the sales of business units include intersegment sales.
6
Visuals: Donut chart titled 2Q 2026 Sales by Business Segment, unit KRW Trillion, centre label Total 171.5 Trillion. Four segments, clockwise from 12 o'clock: black segment labelled 127.5 (DS, about 68% of the ring), dark steel-blue segment labelled 48.0 (DX), mid-blue segment labelled 7.5 (SDC), pale blue-grey segment labelled 4.6 (Harman). Values are printed on the segments; no axes, no legend, no highlighted points. Printed segment values sum to 187.6 while the centre total reads 171.5; both recorded as printed. Icons: a semiconductor chip icon beside DS, a smartphone outline icon beside DX, a laptop outline icon beside SDC, and a car outline icon with a sensor/antenna motif beside Harman, all drawn in thin dark grey or blue line work. Two pale green rounded badges with QoQ text sit in the left card. Table: columns Business Unit, Sales (QoQ), Op. Profit (% of revenue); rows DS (127.5 T, +56%, 89.2 T, 70%), DX (48.0 T, -9%, -0.8 T, -2%), SDC (7.5 T, +12%, 0.7 T, 9%), Harman (4.6 T, +19%, 0.4 T, 9%). Key Updates bullets are listed in the elements.
Slide 7
Memory
Results
2Q 2026 Results
Achieved another record-breaking quarterly earnings
Proactively addressed AI demand with primary focus on server despite limited capacity
Continued industry-wide upward price trend
Solidified market competitiveness via industry-leading products
Achieved record-high server revenue mix
Scaled up HBM4 sales with industry-leading performance
Shipped industry’s 1st HBM4E samples to major customers
DS Results
Unit: KRW trillion
127.5
Sales (DS)
120.8
Sales (Mem)
89.2
OP (DS)
81.7
74.8
53.7
27.9
21.2
0.4
2Q 25
1Q 26
2Q 26
~~
Outlook
H2 2026
Expect robust demand centered on server backed by continued AI Infrastructure CapEx
Strong server demand driven by broader adoption of agentic AI
Accelerating growth in demand for server DRAM, Enterprise SSD and HBM expected to keep the market undersupplied despite partial demand moderation in mobile and PC
Continue leading the market via technology leadership
Seek to optimize portfolio based on demand trends by application and customer feedback; supply constraints to continue in spite of efforts to increase production
Plan to lead the market by addressing strong demand with a focus on high-value-added products, such as HBM4, DDR5, SOCAMM2, etc.
Extend the leadership into next-generation AI platforms, following the industry’s 1st HBM4E sample shipment as well as the Gen6 and UFS 5.0 market penetration in H1.
SAMSUNG PM1763
SAMSUNG HBM4
SAMSUNG HBM4E
SAMSUNG LPDDR5X
※ Image : Samsung HBM4/E, DDR5 RDIMM, SOCAMM2, V9 eSSD
7
SAMSUNG
Visuals: Chart: stacked bar chart titled DS Results with the unit label Unit: KRW trillion (top-right of chart, grey). Three categories on the x-axis: 2Q 25, 1Q 26, 2Q 26. No y-axis or numeric axis range is printed. Bars: 2Q 25 segments labelled 0.4 (bottom, dark blue), 21.2 (middle, dark blue), total 27.9 above; 1Q 26 segments labelled 53.7 (bottom, dark), 74.8 (middle, dark), total 81.7 above; 2Q 26 segments labelled 89.2 (bottom, dark), 120.8 (middle, dark), total 127.5 above. Top segment of each bar is lighter blue. Right-side series labels for 2Q 26: Sales (DS) at top, Sales (Mem) middle, OP (DS) lower. Overlaid line series in grey connects OP values 0.4, 53.7 and 89.2 with white circular markers with grey outlines. Axis break symbol (two wavy marks, light grey) sits between 2Q 25 and 1Q 26 on the baseline. No legend box; series identified by the right-side labels. No highlighted points beyond the markers. Photographs: a DDR5 RDIMM memory module stack in green PCB with black DRAM chips, angled, upper-centre-left; a black PM1763 SSD drive with label SAMSUNG PM1763, left-centre; two black square HBM chips, labelled SAMSUNG HBM4 and SAMSUNG HBM4E, boxed side by side below the SSD; a green SOCAMM2 module with SAMSUNG LPDDR5X labels, bottom centre. Studio product photography on white, neutral lighting, objects cut out (no boxes or backgrounds), not cropped. Blue header tab bars under Results and Outlook are rule-like graphic elements.
Slide 8
S.LSI / Foundry
Results
Outlook
2Q 2026 Results
DS Results
H2 2026
S.LSI
S.LSI
Record-high first-half revenue driven by / SoC/image sensor sales expansion in high-volume / mobile segment
Secured a next-generation flagship SoC and new / design awards
Drive next-generation flagship SoC sales and / develop more new business in Custom SoC
Expand into high-value segments, including / diversified image sensor applications and Power / IC business
Foundry
Foundry
Revenue growth on HBM B-Die demand and / strong U.S. customer orders
Continued design win expansion with major / customers, including 2nm HPC engagements
2nm Gen 2 mobile ramp-up; 4nm LPU ramp and / Base-Die sales expansion
Target double-digit revenue growth on rising / demand across U.S. and China
Deliver mid-to-long-term growth via advanced / node and AI/HPC design win expansion
Unit: KRW trillion
127.5
Sales(DS)
81.7
27.9
2Q 25
1Q 26
2Q 26
~
~
※ Image : Samsung Exynos SOC, image sensor, silicon wafer
8
SAMSUNG
Visuals: Left panel: a photo cluster at lower left of four or five objects, all photographs on white or grey background with soft shadows. (1) A black Samsung Exynos SoC package, square, with a small blue 5G badge at top-left and a blue cross-shaped logo at top-right, the word SAMSUNG and Exynos printed in white at bottom-left; it is front-lit, dominant colours black and blue. (2) A tilted rectangular CMOS image sensor with a magenta-to-blue-to-teal gradient surface, slightly rotated, lit from above. (3) A small grey-silver HBM-style memory package, tilted, with a dark teal substrate edge, at bottom-left of the cluster. (4) A circular silicon wafer, tilted, showing a multicoloured diffraction pattern of pink, green, yellow, blue and orange die, overlapping the bottom-right of the other objects; the wafer is not cropped. Right of the photos, a bar chart in the DS Results column: title DS Results; unit label Unit: KRW trillion at top-right of the plot; no visible axis lines or scale, values printed on bars. Three stacked columns with a light blue #558ED5 upper segment and dark blue #2F5597 lower segment, sitting on a thin grey baseline #BFBFBF: 2Q 25 total 27.9 (about 25% of the tallest column height, lower segment about 15% of the total), 1Q 26 total 81.7 (lower segment about 9% of total), 2Q 26 total 127.5 (tallest, lower segment about 6% of total). A small grey axis-break mark (two tilde-like wave symbols) sits on the baseline between 2Q 25 and 1Q 26. No legend; the Sales(DS) label in grey sits to the right of the 2Q 26 total. No highlighted points beyond the tallest bar. Right panel: no images, only text and bullets. Blue rounded header bars under Results and Outlook; thin navy underlines under 2Q 2026 Results, DS Results and H2 2026.
Slide 9
SAMSUNG | SDC | Results | Outlook | 2Q 2026 Results | SDC Results | Unit: KRW trillion | H2 2026 | ➢ Small & Medium | • Earnings improved on solid demand / for high-end mobile products | ➢ Large | • Expanded sales volume and revenue driven / by growth of the gaming monitor market | 7.5 | Sales | 6.4 | 6.7 | 0.5 | 0.4 | 0.7 | OP | 2Q 25 | 1Q 26 | 2Q 26 | ➢ Expect continued market uncertainty including / memory supply-demand conditions | ➢ Small & Medium | • Focus on addressing new model demand centering / on premium products based on technological / competitiveness such as low-power offerings and / diversified form factors | • Pursue revenue growth by timely mass production / of 8.6G IT OLED line | • Expand supply of differentiated products to the / Tablet/Game/Automotive segments | ➢ Large | • Drive sales growth with expanded gaming monitor / customer base and strengthened product lineup | ※ Image : Flexible OLED display | 9
Visuals: Chart: vertical clustered-style bar chart titled SDC Results, unit KRW trillion (printed as 'Unit: KRW trillion' top-right of the chart area). Categories on the horizontal axis: 2Q 25, 1Q 26, 2Q 26. Sales series as blue bars (fill #558ED5) with printed values 6.4, 6.7 and 7.5 labelled above each bar; no value axis or gridlines are printed, and bar heights are roughly proportional to the printed values. OP series shown as a dark-grey (#595959) line with white circular markers with grey outline at each category, labelled 0.5, 0.4 and 0.7 printed on the bars (white text) and marked as OP; the 0.7 point is the highest. Legend: 'Sales' label at the top-right of the bars, 'OP' label at the right of the marker line. A small break symbol (two grey tilde-like marks, #A6A6A6) sits on the baseline between the first and second bars. Photograph: a flexible OLED display panel bent into a curl, seen against a white background with clear transparent glass edges at the left and right ends; the screen shows a night sky with teal, deep blue and violet aurora bands and stars, and at lower left a glowing orange tent on a dark hillside. Lighting is low-key with warm orange light from the tent. The image is not cropped, sits unboxed on the panel, with no overlay or tint. Logo: SAMSUNG wordmark in dark blue, top-right. Two thin dark-blue header bars under Results and Outlook.
Slide 10
MX / NW
Results
Outlook
2Q 2026 Results
MX/NW Results
H2 2026
➢ MX
• Revenue increased YoY, driven by solid
flagship sales and A series expansion
• Earnings declined due to elevated component
cost pressures across the industry
➢ NW
• Earnings improved QoQ/YoY supported by
overseas sales expansion
Unit: KRW trillion
29.2
28.5
3.1
38.1
37.5
2.8
33.2 Sales
32.3 Sales (MX)
-0.7 OP
2Q 25
1Q 26
2Q 26
➢ MX
• Strengthen AI leadership through personalized
and intuitive experiences
• Drive smartphone M/S growth through
flagship-centric sales acceleration
✓ Expand flagship-led sales, centered on new
Galaxy Z Fold8 and S26 series
✓ Enhance premium mix across Galaxy ecosystem
and deliver AI-driven experiences in new form
factors with the launch of 'Intelligent Eyewear'
• Pursue efficiency initiatives to mitigate impact
of rising costs and protect profitability
➢ NW
• Secure profitability through new orders and
structural cost discipline amid telco investment
headwinds
※ Image : Galaxy Z Flip8, Galaxy Z Fold8 Ultra, Galaxy Z Fold8
10
Visuals: Chart: stacked bar and line combination titled MX/NW Results, unit KRW trillion, shown top right of the chart area. Three categories on the horizontal axis: 2Q 25, 1Q 26, 2Q 26, with a grey break symbol (two wavy marks) on the baseline between 2Q 25 and 1Q 26. No vertical axis or gridlines are printed; bar heights are relative. Series 1, bar total, labelled above each bar: 29.2 (2Q 25), 38.1 (1Q 26), 33.2 Sales (2Q 26). Series 2, dark bar segment (MX sales) labelled inside: 28.5 (2Q 25), 37.5 (1Q 26), 32.3 Sales (MX) (2Q 26). Thin light-blue cap segment on top of each dark segment, unlabelled; estimated to be about 0.7, 0.6 and 0.9 by subtraction of printed values. Series 3, OP line in grey (#7F7F7F) with white-filled circle markers joining the OP values, labelled inside or beside the bars: 3.1 (2Q 25), 2.8 (1Q 26), -0.7 OP (2Q 26). The 2Q 26 marker sits below the baseline; its bar is drawn from the baseline upward. Highlighted point: the 2Q 26 category label and bar are drawn in larger bold type than the other two. Legend: no separate legend box; series identified by inline labels Sales and Sales (MX) and OP. Photograph: three Samsung Galaxy phones in hands on a plain light grey-white background. Left, a Galaxy Z Flip8 folded, held in a hand, showing a pink and orange gradient cover screen with a large figure 8 and two rear lenses. Centre, a Galaxy Z Fold8 Ultra closed, dark plum-purple body, held upright by a hand, with a triple rear camera module. Right, a lavender-silver Galaxy Z Fold8 partly open and held by a hand with pale blue nails, dual rear camera. Soft even studio lighting from the front; dominant colours are dark plum, lavender, pale pink and skin tones on white. The photo is boxed, not full-bleed, with a hard rectangular edge at its bottom and sides, not cropped. Samsung logo: blue SAMSUNG wordmark top right.
Slide 11
SAMSUNG
VD / DA / Harman
Results
Outlook
2Q 2026 Results
VD
Earnings declined QoQ due to increased costs,
while revenue and earnings increased YoY
driven by demand capture from sports event
DA
Revenue growth from air conditioner demand,
yet cost pressures weighed on earnings
Harman
Earnings improved on expanded auto seg. sales,
and strong audio sales led by portable products
VD/DA Results
Unit: KRW trillion
14.1
14.3
14.5 Sales
Sales (VD)
7.0
0.2
7.7
0.2
7.7
-0.01
OP
2Q 25
1Q 26
2Q 26
Harman Results
Unit: KRW trillion
4.6 Sales
3.8
3.8
0.5
0.2
0.4
OP
2Q 25
1Q 26
2Q 26
H2 2026
VD
Lead the AI TV market with differentiated customer
experience based on 'Vision AI' and capture seasonal
demand through strengthened channel partnerships
Enhance TV market leadership and profitability by
growing service business with TV Plus contents
diversification and advertising business expansion
DA
Strengthen market leadership by expanding sales of
AI-products
Pursue profitability-driven operations through channel
diversification and enhanced product competitiveness
Harman
Address demand in high-growth auto segments including
central compute unit and expand audio sales based on
enhanced brand awareness and lineup
Maintain stable growth momentum through revenue
expansion across auto and audio business
※ Image : 85-inch Micro RGB TV, Bespoke AI Laundry Combo
11
Visuals: Three visual groups. (1) Photograph, cropped to nothing and not boxed, on white background at the lower-left of the Results panel: a flat-screen TV (about x5.4 y70.1 w14.8 h26.2 region) showing a vivid multicolour abstract Micro RGB pattern of blue, green, red, magenta and yellow swirls on a dark screen with a dark stand, angled toward the viewer; beside it, overlapping slightly to the right, a dark charcoal-grey front-loading washer-dryer combo (about x17.8 y69.4 w10 h25.2) with a small rectangular digital display on its top-left panel and a large round glass door with a dark interior. Lighting is even studio light; the composition is a side-by-side product shot with the TV in front-left and the appliance behind-right. (2) Bar chart VD/DA Results, combined column and line chart, box about x34.5 y32.5 w31 h23.5. Unit: KRW trillion, no visible numeric axis or axis range. Columns are light blue #558ED5 for total Sales with printed labels 2Q 25 14.1, 1Q 26 14.3, 2Q 26 14.5 (Sales, top of stack); dark navy #315683 lower segment is Sales (VD) with printed values 7.0 in 2Q 25, 7.7 in 1Q 26, 7.7 in 2Q 26, in white. Below, OP line series with grey #7F7F7F connector and open white circle markers at each column base with printed values 0.2 (2Q 25), 0.2 (1Q 26), -0.01 (2Q 26, highlighted in larger bold). Legend-style labels to the right: Sales, Sales (VD), OP. A grey wavy axis-break symbol (~) sits between 2Q 25 and 1Q 26 on the baseline. X-axis categories 2Q 25, 1Q 26, 2Q 26, with 2Q 26 in larger bold type. The 2Q 26 column is the highlighted point. (3) Bar chart Harman Results, box about x34.4 y69 w31 h22.5. Unit: KRW trillion. Light blue #558ED5 columns: Sales 2Q 25 3.8, 1Q 26 3.8, 2Q 26 4.6 (labelled above, 4.6 larger). OP line in dark grey #404040 with white circle markers at column base: 0.5 (2Q 25), 0.2 (1Q 26), 0.4 (2Q 26, larger). Legend labels Sales and OP to the right. Wavy axis-break symbol between 2Q 25 and 1Q 26. Categories 2Q 25, 1Q 26, 2Q 26 with 2Q 26 bold. Column heights are approximately proportional to values; no axis range printed. Blue underline bars: two images of a blue #003399 rounded header bar under Results and under Outlook, spanning the panel widths.
Slide 12
SAMSUNG
Appendix 1: 2Q 2026 Results & Financial Data
Based on consolidated financial statements
KRW trillion
2Q 25
% of sales
1Q 26
% of sales
2Q 26
% of sales
Sales
74.6
100.0%
133.9
100.0%
171.5
100.0%
Cost of sales
49.1
65.8%
52.0
38.8%
52.2
30.4%
Gross profit
25.5
34.2%
81.9
61.2%
119.3
69.6%
SG&A expenses
20.8
27.9%
24.7
18.4%
29.8
17.4%
R&D expenses
9.0
12.1%
11.3
8.5%
16.0
9.3%
Operating profit
4.7
6.3%
57.2
42.8%
89.5
52.2%
Other non-operating income/expenses
0.02
-
0.1
-
(0.01)
-
Equity method gain/loss
0.2
-
0.2
-
0.2
-
Finance income/expenses
0.9
-
1.3
-
4.7
-
Profit before income tax
5.8
7.7%
58.8
43.9%
94.4
55.1%
Income tax
0.6
-
11.6
-
22.8
-
Net profit
5.1
6.9%
47.2
35.3%
71.6
41.8%
Profit attributable to owners of the parent
4.9
6.6%
47.1
35.2%
71.3
41.6%
EPS (KRW) ※ Common stock
737
7,123
10,849
Sales and Operating Profit
(KRW trillion)
74.6
4.7
133.9
57.2
171.5
89.5
130% YoY
Sales
Operating profit
2Q 25
1Q 26
2Q 26
Key Profitability Indicators
2Q 25
1Q 26
2Q 26
ROE
5%
41%
56%
Profitability (net profit/sales)
0.07
0.35
0.42
Asset turnover (sales/asset)
0.59
0.89
1.03
Leverage (asset/equity)
1.27
1.30
1.31
EBITDA margin
20%
51%
59%
Visuals: 1) Financial table, left column. Columns: row label, 2Q 25, % of sales, 1Q 26, % of sales, 2Q 26, % of sales. Header row is bold black for period labels, with % of sales in blue #0028A8. Rows: Sales 74.6 / 100.0% / 133.9 / 100.0% / 171.5 / 100.0%; Cost of sales 49.1 / 65.8% / 52.0 / 38.8% / 52.2 / 30.4%; Gross profit 25.5 / 34.2% / 81.9 / 61.2% / 119.3 / 69.6%; SG&A expenses 20.8 / 27.9% / 24.7 / 18.4% / 29.8 / 17.4%; R&D expenses (indented) 9.0 / 12.1% / 11.3 / 8.5% / 16.0 / 9.3%; Operating profit 4.7 / 6.3% / 57.2 / 42.8% / 89.5 / 52.2%; Other non-operating income/expenses 0.02 / - / 0.1 / - / (0.01) / -; Equity method gain/loss 0.2 / - / 0.2 / - / 0.2 / -; Finance income/expenses 0.9 / - / 1.3 / - / 4.7 / -; Profit before income tax 5.8 / 7.7% / 58.8 / 43.9% / 94.4 / 55.1%; Income tax 0.6 / - / 11.6 / - / 22.8 / -; Net profit 5.1 / 6.9% / 47.2 / 35.3% / 71.6 / 41.8%; Profit attributable to owners of the parent 4.9 / 6.6% / 47.1 / 35.2% / 71.3 / 41.6%; EPS (KRW) 737 / blank / 7,123 / blank / 10,849 / blank. Sales, Gross profit, Operating profit, Profit before income tax, Net profit and EPS are bold and underlined; shaded rows are light blue #BDD7EE. Thin dotted vertical dividers separate 2Q 25, 1Q 26 and 2Q 26 blocks. The 2Q 26 column (x about 41.3% to 54.2%) is enclosed by a dark blue #0028A8 rectangle with about 0.3% stroke. 2) Combined column and line chart, upper right, titled Sales and Operating Profit with unit (KRW trillion). Type: vertical bar series (Sales) with a line series (Operating profit with circle markers). Bars are dark slate blue #315683, no visible y-axis or gridlines; x-axis categories 2Q 25, 1Q 26, 2Q 26 with a thin grey baseline. Sales bars labelled above: 74.6 (2Q 25), 133.9 (1Q 26), 171.5 (2Q 26); bar heights rise in proportion to these values (about 75 : 134 : 172, no scale printed). Operating profit line is grey #595959 with white-filled circle markers, labelled 4.7 (2Q 25), 57.2 (1Q 26), 89.5 (2Q 26) (labels white on bars, 4.7 and 57.2 inside bars). A grey wavy break mark sits on the baseline between 2Q 25 and 1Q 26. An outlined dark blue arrow (#315683) runs diagonally from about (63%, 40%) up to about (86%, 32%) above the bars, with a blue-outlined white oval labelled 130% YoY (bold black) placed over its left portion. Legend at top right: a dark slate block labelled Sales, and a grey line with two white circle ends labelled Operating profit. 3) Key Profitability Indicators table, lower right. Columns: row label, 2Q 25, 1Q 26, 2Q 26 (2Q 26 boxed in dark blue). Rows: ROE 5% / 41% / 56% (light blue row); Profitability (net profit/sales) 0.07 / 0.35 / 0.42; Asset turnover (sales/asset) 0.59 / 0.89 / 1.03; Leverage (asset/equity) 1.27 / 1.30 / 1.31; EBITDA margin 20% / 51% / 59% (light blue row with black rule above and below). A thin dark dotted vertical divider sits between 1Q 26 and 2Q 26 columns and between 2Q 25 and 1Q 26. 4) Decorative: two thick dark blue #0028A8 bars with rounded ends sit under the chart heading and the KPI heading. The SAMSUNG logo (wordmark, dark blue #0028A8, bold sans-serif uppercase, letter-spaced) sits top right.
Slide 13
Appendix 2: Results by Business Segment
SAMSUNG
Sales
Operating Profit
Sales
KRW trillion
2Q 25
1Q 26
2Q 26
QoQ
YoY
Total
74.6
133.9
171.5
28%↑
130%↑
DX
43.6
52.7
48.0
9%↓
10%↑
MX / NW
29.2
38.1
33.2
13%↓
14%↑
MX
28.5
37.5
32.3
14%↓
14%↑
VD / DA
14.1
14.3
14.5
2%↑
3%↑
VD
7.0
7.7
7.7
0.1%↓
10%↑
DS
27.9
81.7
127.5
56%↑
357%↑
Memory
21.2
74.8
120.8
62%↑
471%↑
SDC
6.4
6.7
7.5
12%↑
17%↑
Harman
3.8
3.8
4.6
19%↑
19%↑
Operating Profit
KRW trillion
2Q 25
1Q 26
2Q 26
QoQ
YoY
Total
4.7
57.2
89.5
32.3↑
84.8↑
DX
3.3
3.0
(0.8)
3.8↓
4.1↓
MX / NW
3.1
2.8
(0.7)
3.6↓
3.8↓
VD / DA
0.2
0.2
(0.01)
0.2↓
0.2↓
DS
0.4
53.7
89.2
35.5↑
88.8↑
SDC
0.5
0.4
0.7
0.3↑
0.2↑
Harman
0.5
0.2
0.4
0.2↑
0.1↓
* Sales and operating profit of each business stated above reflect the organizational structure as of December 2021 and
the sales of business units include intersegment sales.
* The DX Division provides earnings call materials based on the business structure before the reorganization to prevent confusion and
to improve understanding among investors.
* DX: Device eXperience MX: Mobile eXperience DS: Device Solutions
* Sales and operating profit of VD/DA include the results of Health & Medical Equipment business.
* Harman’s sales and operating profit figures are based on Samsung Electronics’ fiscal year and acquisition related expenses are reflected.
Visuals: Two data tables, no charts. Left table Sales in KRW trillion with columns 2Q 25, 1Q 26, 2Q 26, QoQ, YoY and rows Total 74.6, 133.9, 171.5, 28%↑, 130%↑; DX 43.6, 52.7, 48.0, 9%↓, 10%↑ (indented, bold labels, underlined); MX / NW 29.2, 38.1, 33.2, 13%↓, 14%↑; MX 28.5, 37.5, 32.3, 14%↓, 14%↑; VD / DA 14.1, 14.3, 14.5, 2%↑, 3%↑; VD 7.0, 7.7, 7.7, 0.1%↓, 10%↑; DS 27.9, 81.7, 127.5, 56%↑, 357%↑; Memory 21.2, 74.8, 120.8, 62%↑, 471%↑; SDC 6.4, 6.7, 7.5, 12%↑, 17%↑; Harman 3.8, 3.8, 4.6, 19%↑, 19%↑. Right table Operating Profit in KRW trillion with the same columns and rows Total 4.7, 57.2, 89.5, 32.3↑, 84.8↑; DX 3.3, 3.0, (0.8), 3.8↓, 4.1↓; MX / NW 3.1, 2.8, (0.7), 3.6↓, 3.8↓; VD / DA 0.2, 0.2, (0.01), 0.2↓, 0.2↓; DS 0.4, 53.7, 89.2, 35.5↑, 88.8↑; SDC 0.5, 0.4, 0.7, 0.3↑, 0.2↑; Harman 0.5, 0.2, 0.4, 0.2↑, 0.1↓. Bold blue box outlines the 2Q 26 column in each table. Total row fill is a medium blue band, DX and DS sub-bands light blue, and other rows white or light blue. Arrows in QoQ and YoY cells show direction; values are blue. Line rules: thin black rule under the header row and dotted vertical separators between 2Q 25 and 1Q 26. No photographs, icons or illustrations.
Slide 14
SAMSUNG / Appendix 3: Financial Position (Summary) / KRW billion / 30.Jun.25 / 31.Mar.26 / 30.Jun.26 / Assets / Cash* / A/R / Inventories / Investments / PP&E / Intangible assets / Other assets / Total assets / Liabilities / Debts / Trade accounts and N/P / Other accounts and N/P & accrued expenses / Current income tax liabilities / Unearned revenue & other advances / Other liabilities / Shareholder equity / Capital stock / Total liabilities & shareholder equity / Current ratio* / Liability/equity / Debt/equity / Net debt/equity / 30.Jun.25 / 31.Mar.26 / 30.Jun.26 / 251% / 254% / 283% / 26% / 30% / 31% / 4% / 6% / 4% / (22%) / (25%) / (29%) / * Current ratio = current assets/current liabilities / * Cash = Cash and Cash equivalents Short-term financial instruments Short-term financial assets at amortized cost, etc.
Visuals: Two tables, no charts or photographs. Left table: a financial position table in KRW billion with columns for the row label, 30.Jun.25, 31.Mar.26 and 30.Jun.26. Rows and values: Assets 504,875.2 / 633,339.6 / 759,480.5 (shaded band); Cash* 100,728.2 / 147,378.1 / 189,999.0; A/R 43,550.5 / 82,285.0 / 96,409.0; Inventories 51,037.4 / 58,278.4 / 71,389.1; Investments 33,240.3 / 54,619.6 / 104,824.5; PP&E 205,025.6 / 217,814.9 / 224,372.0; Intangible assets 25,997.7 / 29,643.7 / 29,386.5; Other assets 45,295.5 / 43,319.9 / 43,100.4; Total assets 504,875.2 / 633,339.6 / 759,480.5 (centred label, lighter band); Liabilities 105,313.2 / 146,703.6 / 180,170.8 (shaded band, values bold); Debts 14,029.7 / 28,138.8 / 22,408.7; Trade accounts and N/P 12,675.8 / 15,821.0 / 17,204.7; Other accounts and N/P and accrued expenses 42,922.0 / 52,003.8 / 53,642.2; Current income tax liabilities 7,643.1 / 15,229.1 / 30,303.1; Unearned revenue and other advances 2,620.2 / 3,853.4 / 4,466.5; Other liabilities 25,422.4 / 31,657.5 / 52,145.6; Shareholder equity 399,562.0 / 486,636.0 / 579,309.7 (shaded band, bold); Capital stock 897.5 / 897.5 / 897.5; Total liabilities and shareholder equity 504,875.2 / 633,339.6 / 759,480.5 (centred label, lighter band). The 30.Jun.26 column is outlined by a thick blue rectangle running the full table height, and the Total liabilities and shareholder equity cell sits at its base. Right table: columns for the row label, 30.Jun.25, 31.Mar.26 and 30.Jun.26; rows Current ratio* 251% / 254% / 283%; Liability/equity 26% / 30% / 31%; Debt/equity 4% / 6% / 4%; Net debt/equity (22%) / (25%) / (29%). The 30.Jun.26 column is outlined by a thick blue rectangle. Samsung wordmark logo in the top-right corner, dark blue.
Slide 15
SAMSUNG / Appendix 4: Cash Flow (Summary) / KRW trillion / 2Q 25 / 1Q 26 / 2Q 26 / Cash (beginning of period)* / 105.13 / 125.85 / 147.38 / Cash flows from operating activities / 17.31 / 40.27 / 105.08 / Net profit / 5.12 / 47.23 / 71.62 / Depreciation / 10.56 / 11.48 / 12.11 / Cash flows from investing activities / (13.35) / (17.23) / (47.31) / Purchase of PP&E / (13.04) / (17.13) / (14.11) / Cash flows from financing activities / (3.41) / (5.46) / (17.89) / Increase in debts / 2.82 / 2.17 / (6.06) / Acquisition of treasury stock / (1.32) / (7.61) / (5.63) / Payment of dividends / (4.90) / (0.01) / (6.21) / Increase in cash / (4.41) / 21.53 / 42.62 / Cash (end of period)* / 100.73 / 147.38 / 190.00 / * Cash = Cash and cash equivalents short-term financial instruments short-term financial assets at amortized cost, etc. / Current State of Net Cash (Net Cash = Cash* - Debts) / KRW trillion / 30.Jun.25 / 31.Mar.26 / 30.Jun.26 / Net Cash / 86.70 / 119.24 / 167.59 / * Cash = Cash and cash equivalents short-term financial instruments short-term financial assets at amortized cost, etc.
Visuals: Two tables, no charts, photographs or icons. Left table: a financial cash flow summary with columns KRW trillion (row label column), 2Q 25, 1Q 26 and 2Q 26. Rows in order: Cash (beginning of period)* 105.13 / 125.85 / 147.38 (bold, centred label, light blue band); Cash flows from operating activities 17.31 / 40.27 / 105.08 (bold, pale lavender band); Net profit 5.12 / 47.23 / 71.62 (indented regular); Depreciation 10.56 / 11.48 / 12.11 (indented regular); Cash flows from investing activities (13.35) / (17.23) / (47.31) (bold, pale lavender band); Purchase of PP&E (13.04) / (17.13) / (14.11) (indented regular); Cash flows from financing activities (3.41) / (5.46) / (17.89) (bold, pale lavender band); Increase in debts 2.82 / 2.17 / (6.06); Acquisition of treasury stock (1.32) / (7.61) / (5.63); Payment of dividends (4.90) / (0.01) / (6.21); Increase in cash (4.41) / 21.53 / 42.62 (bold, no band); Cash (end of period)* 100.73 / 147.38 / 190.00 (bold, centred label, light blue band). Values are in parentheses for negatives. The 2Q 26 column is outlined by a thick dark blue rectangle running from the header to the bottom row. Columns are separated by thin black vertical rules, with dotted vertical rules between the 2Q 25, 1Q 26 and 2Q 26 columns. Horizontal thin grey rules separate the groups. Right table: columns KRW trillion (row label), 30.Jun.25, 31.Mar.26 and 30.Jun.26. One data row, Net Cash, with values 86.70 / 119.24 / 167.59 on a light blue band. A thick dark blue rectangle outlines the 30.Jun.26 column cell including its header. No estimated values; all values are printed.
Slide 16
Thank you
SAMSUNG
※ Background image is of the Samsung Electronics Digital City(Suwon), located in South Korea
Visuals: Photograph: a low-angle view looking up at tall glass-curtain-wall office towers at the Samsung Electronics Digital City in Suwon, South Korea. The tallest tower rises centre-right with a bright sun flare at its upper-right edge. Pine trees fill the left foreground, a white street lamp stands on the left, a few small figures and a white car are at the bottom, and a covered walkway runs along the lower right. Composition is full-frame, not cropped to a box. Lighting is daytime with a bright sun flare; the image is heavily darkened. Dominant colours are deep navy blue and slate grey. Overlay: a #10253F fill at 75% opacity covers the entire slide. Logo: the white SAMSUNG wordmark, which is the only logo. A thin white horizontal rule divides the slide.
Download this deck
The hosted PDF of every library deck is free for readers of the SlideDeck Co newsletter. Join with your email and the viewer and download appear here.
Preparing a results presentation or business update of your own? The SlideDeck Co Standard Deck is a slide library for business reviews, updates and plans.







