
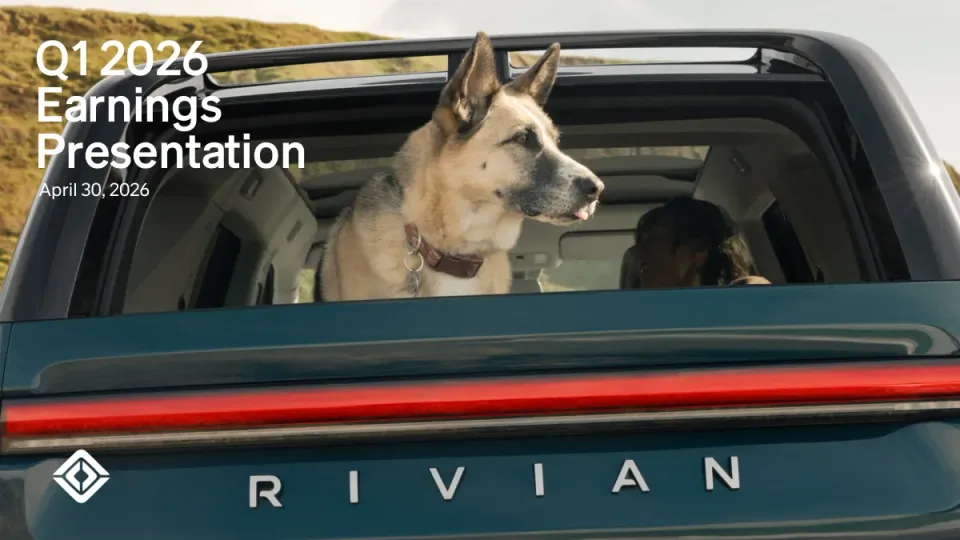
The deck opens with a title slide dated April 30, 2026, followed by a forward-looking statements and non-GAAP disclosure page and a table of contents. The business summary comes next, covering the start of saleable R2 production in Normal, Illinois, the Georgia plant capacity increase and Department of Energy loan, and the Uber and Volkswagen partnerships. Strategic priorities, R2 trims and pricing, and cost-reduction plans for the R2 platform follow, along with Georgia capacity, partnership and spin-out investment updates. Segment results for automotive and software and services are then shown with charts and short commentary, followed by balance sheet and liquidity, and 2026 guidance. The closing section is an appendix of quarterly financials, balance sheets, operations and cash flows, with non-GAAP reconciliations. Slides worth studying include the R2 cost-reduction slide, which uses a grid of component photos with savings figures, and the summary financial slide, which packs a compact metrics table alongside imagery. The segment slides pair bar charts with short commentary.
Slides worth studying
- Slide 7: A grid of component photos, each paired with a single savings figure, makes a dense cost argument easy to scan.
- Slide 11: A stacked layout of photo panels and compact metric tables summarises the quarter in one view without crowding.
- Slide 12: Paired bar charts with a short commentary column show the segment story clearly, using highlighted quarter labels.
Details
- Company: Rivian
- Year: 2026
- Type: Investor presentation
- Industry: Automotive
- Pages: 28
The hosted copy of this deck is being prepared. Newsletter readers will find the download here.
Review score: 7 out of 10, Effective
Presentation quality, judged with the SlideDeck Co review heuristic. Ask, evidence and idea merit are not rated here.
The deck has a clear earnings-call route: business summary, strategy, R2 cost story, segment charts, liquidity, guidance, then appendix. The readable slides (7, 11, 12) are well organised, with strong titles, consistent footers, tidy card grids and aligned tables, and the photography is high quality and on brand. The weaknesses are consequential: slides 4, 5 and 6 are dense text with small type that few could read when projected, slide 7 shows component savings as prose beside small, uneven product images, and the 28-slide deck spends 12 slides on appendix tables with tiny type. Slides 10 and 14 also lean on small text and footnotes, and the guidance on slide 15 sits late and is easy to miss.
Worth keeping: Keep the consistent title and footer system, the 3x3 component cards on slide 7, the labelled revenue and margin bar charts with commentary on slide 12, and the photo-banded metrics table on slide 11.
Most useful repair: Cut or split the text-heavy slides 4, 5, 6 and 9 into a few headline claims at larger size, and raise the type size on the footnote-heavy slide 14 and the wide appendix tables.
What would change the score: Pull the 2026 guidance forward to the business summary, make the key savings figures on slide 7 the visual focus instead of body text, and turn the commentary on slides 12 and 13 into one takeaway each.
Confidence medium. 28 of 28 pages inspected on contact sheets, 4 at readable size. Reviewed 2026-11-10. Model-assisted review (claude-sonnet-5-5).
Full text of the slides (28 slides)
Every slide's words and a description of its charts and images, so the deck can be searched and rebuilt. Also available as Markdown.
Slide 1
Q1 2026 / Earnings / Presentation / April 30, 2026
Visuals: Full-bleed photograph of the rear of a dark teal-green Rivian electric pickup/SUV with its tailgate window open. A German Shepherd-type dog with tan and grey fur, wearing a brown leather collar with a silver tag, looks to the right out of the rear window with its tongue slightly out; a person with dark curly hair is partly visible in the cabin behind the dog. Behind the vehicle is a grassy green-gold hillside under a pale sky. A horizontal red tail light bar runs across the lower third of the vehicle. The RIVIAN wordmark in silver capital letters with wide letter-spacing sits on the teal body below the light bar, and the white diamond logo sits at the lower left. Lighting is warm natural daylight, slightly backlit with a lens flare at the right edge. Dominant colours: teal #2F4F4F-like dark green, tan/gold #B8A060-like hillside, red #C8102E-like tail light, cream sky #E8E6DC-like. The photo is not cropped, not boxed, full-bleed with no overlay or tint.
Slide 2
Public Disclosure Statement
Forward Looking Statements
This earnings presentation and statements that are made on our earnings call contain forward-looking statements within the meaning of the Private Securities Litigation Reform Act of 1995. All statements contained
in this earnings presentation and made on our earnings call that do not relate to matters of historical fact should be considered forward-looking statements, including without limitation statements regarding our future
operations, initiatives and business strategy, including our future financial results, vehicle profitability and future gross profits, our future capital expenditures, the underlying trends in our business (including customer
preferences and expectation), macroeconomic and policy conditions, including changes to the availability of government and economic incentives, including tax credits, for electric vehicles, our market opportunity,
and our potential for growth, our production ramp and manufacturing capacity expansion and anticipated production levels, the timeline for the start of production at the Georgia plant, the timeline for drawing on
our Department of Energy Loan, our expected future production and deliveries, scaling our service infrastructure, our expected future products and technology and product enhancements, including enhanced
performance features and pricing (including the timing of launches and customer deliveries), our roadmap and timeline for the release of our next-generation vehicle autonomy systems, hardware, including RAP1,
ACM3 and LiDAR, and software architecture underpinned by artificial intelligence, including LDM, Rivian Assistant, Universal Hands-Free, and RUI, future revenue opportunities, including with respect to the emerging
autonomous driving market, our joint venture with Volkswagen Group, including the expected benefits from the partnership and future Volkswagen Group investments, our partnership with Uber Technologies, Inc.,
including the expected benefits from the partnership and future Uber investments, the achievement of certain milestones and regulatory approval, the timeline, total purchase, and deployment plans for fully
autonomous R2 robotaxis by Uber and its fleet partners, the timeline and geographic location for initial commercial deployments and future scaling, and expected benefits from partnerships with other third parties.
These statements are neither promises nor guarantees and involve known and unknown risks, uncertainties, and other important factors that may cause our actual results, performance, or achievements to be
materially different from any future results, performance, or achievements expressed or implied by the forward-looking statements, including, but not limited to: our history of losses as a growth-stage company
and our limited operating history; we may underestimate or not effectively manage the cost of revenues, operating expenses, and capital expenditures associated with our business and operations; that we will require
additional financings to raise capital to support our business; our ability to attract and retain a large number of consumers and maintain strong demand for our vehicles, software and services; the highly competitive
automotive and software and services markets in which we operate; demand for and consumers’ willingness to adopt electric vehicles; that our long-term results depend upon our ability to successfully introduce,
integrate and market new products and services; that we have experienced and may in the future experience significant delays in the manufacture and delivery of our vehicles; risks associated with the development of
complex software and hardware in coordination with our joint venture with Volkswagen Group and our other vendors and suppliers; risks associated with our joint venture with Volkswagen Group; risks associated with
additional strategic alliances or acquisitions; we have experienced and could experience in the future cost increases and disruptions in supply of raw materials, components, or equipment used to produce our vehicles;
our dependence on establishing and maintaining relationships with vendors and suppliers; our ability to accurately estimate the supply and demand for our vehicles and predict our manufacturing requirements; our
ability to scale our business and manage future growth effectively; our ability to maintain our relationship with one customer that has generated a significant portion of our revenues; that we are highly dependent on the
services and reputation of our Founder and Chief Executive Officer; the unavailability, reduction or elimination of government and economic incentives and credits for electric vehicles; that we may not be able to obtain
or agree on acceptable terms and conditions for all or a significant portion of the government grants, loans, and other incentives, including regulatory credits, for which we apply or are approved for; risks associated
with breaches in data security, failure of technology systems, cyber-attacks or other security or privacy-related incidents; risk of intellectual property infringement claims; effect of trade tariffs or other trade barriers;
effects of export and import control laws; risks related to motor vehicle safety standards; delays, limitations and risks related to permits and other approvals required to build, operate or expand operations including
the construction and development of facilities to support R2; and the other factors described in our filings with the SEC. These factors could cause actual results to differ materially from those indicated by the forward-
looking statements made in this earnings presentation. Any such forward-looking statements represent management’s estimates as of the date of this earnings presentation. While we may elect to update such
forward-looking statements at some point in the future, except as may be required by law, we disclaim any obligation to do so, even if subsequent events cause our views to change.
Non-GAAP Financial Measures
In addition to our results determined in accordance with generally accepted accounting principles in the United States (“GAAP”), we review financial measures that are not calculated and presented in accordance
with GAAP (“non-GAAP financial measures”). We believe our non-GAAP financial measures are useful in evaluating our operating performance. We use the following non-GAAP financial information, collectively,
to evaluate our ongoing operations and for internal planning and forecasting purposes. We believe that non-GAAP financial information, when taken collectively, may be helpful to investors, because it focuses on
underlying operating results and trends, provides consistency and comparability with past financial performance, and assists in comparisons with other companies, some of which use similar non-GAAP financial
information to supplement their GAAP results. The non-GAAP financial information is presented for supplemental informational purposes only, should not be considered a substitute for financial information presented
in accordance with GAAP, and may be different from similarly titled non-GAAP measures used by other companies. A reconciliation of each historical non-GAAP financial measure to the most directly comparable
financial measure stated in accordance with GAAP is provided above. Reconciliations of forward- looking non-GAAP financial measures are not provided because we are unable to provide such reconciliations without
unreasonable effort due to the uncertainty regarding, and potential variability of, certain items, such as stock-based compensation expense and other costs and expenses that may be incurred in the future. Investors
are encouraged to review the related GAAP financial measures and the reconciliation of these non-GAAP financial measures to their most directly comparable GAAP financial measures.
Q1 2026 Earnings Presentation
© 2026 Rivian. All rights reserved.
2
Slide 3
Table of Contents
Highlights, Financial Results and Guidance
4
Q1 2026 Business Summary
5
Progress on Rivian's Strategic Priorities
6
R2 is Designed for Big Adventures and Everyday Use
7
Profitably Delivering R2 at an Accessible Price
8
Optimized Capacity for Georgia Plant
9
Strategic Partnerships Update
10
Strategic Investments Update
11
Summary Financial Performance and Operating Metrics
12
Automotive Segment Performance
13
Software and Services Segment Performance
14
Balance Sheet and Liquidity
15
Business Outlook
Financial Statements and Non-GAAP Reconciliations
17
Quarterly Financial Performance
18
Condensed Consolidated Balance Sheets
19
Condensed Consolidated Statements of Operations
20
Condensed Consolidated Statements of Cash Flows
21
Depreciation and Amortization & Stock-Based Compensation Expense
22
Reconciliation of Non-GAAP Financial Measures and Definitions
Q1 2026 Earnings Presentation
© 2026 Rivian. All rights reserved.
3
Visuals: One photograph, boxed (not full-bleed), on the left half: a close-up of a hand with the thumb pressing a knurled silver rotary dial set into a dark grey steering-wheel-side control panel. The background is an out-of-focus grey and dark car interior with soft blurred blue and orange light spots. Shallow depth of field, neutral natural lighting, dominant colours mid grey, charcoal black and skin tone with a small amber accent at the left edge. The photo is cropped to a rectangle with square corners and has no overlay or tint. One RIVIAN wordmark logo in the footer at bottom left, black letter-spaced capitals. No charts or tables.
Slide 4
Q1 2026 Business Summary
Continued R2 and technology execution, updated Georgia plans and Department of Energy loan
This quarter the Rivian team executed across many fronts, laying a strong foundation for the years ahead. As an American automotive technology company, we are building for a future that we believe will be fully electric, autonomous and AI-defined. With our category-defining brand, the start of production and deliveries of R2, our technology roadmap and a direct-to-customer ownership experience, we are excited about the opportunity ahead for our customers and our business.
R2 Start of Saleable Production
Last week in Normal, Illinois, our team celebrated the start of saleable R2 production. It is an exciting milestone in Rivian’s history and is the culmination of all the hard work and energy from so many people across the company. In an American automotive marketplace starved for high-quality EV choice, we believe R2 is an attractively priced option that is sized for everyday adventures. We could not be more excited to start getting this incredible vehicle in the hands of our customers this spring.
Optimized Capacity for Georgia and Department of Energy Loan
We are pleased to partner with the U.S. Department of Energy ("DOE") to grow our manufacturing footprint in Georgia. We made the strategic decision to increase the initial phase of production capacity by 50%, bringing it to 300,000 units for our mid-sized vehicle platform. This change is expected to boost cost efficiency, while still providing significant room for future expansion in later phases.The up to $4.5 billion DOE loan ($4,006 million principal and $494 million capitalized interest) to build our Georgia facility provides low cost financing that will enable Rivian to grow American jobs and establish stronger U.S. technology and manufacturing leadership while further scaling our customer base.
Strategic Partnership Updates
In March, we were excited to announce a new partnership with Uber to accelerate our shared autonomous vehicle goals, including plans for future R2 robotaxis. This partnership includes an investment of up to $1.25 billion from Uber subject to technical milestones and conditions. Additionally, the Rivian and Volkswagen Group Technologies joint venture ("RV Tech") successfully completed winter weather testing of its production-intent zonal architecture for first generation Volkswagen Group software-defined vehicles. Achieving this milestone unlocked a $1 billion investment in Rivian by Volkswagen Group which we received today.
Quarterly Financial Highlights
In the first quarter, Rivian generated approximately $1.4 billion of revenue, an 11% increase over the same quarter last year driven by a 20% year-over-year increase in delivery volumes and a strong performance from our software and services segment. Gross profit was $119 million.
RIVIAN
Q1 2026 Earnings Presentation
© 2026 Rivian. All rights reserved.
4
Visuals: One photograph, not a chart or table. Subject: a man in black long-sleeved cycling kit and a dark helmet stands at left, turned toward a woman in a black and red cycling kit with a multicoloured helmet at right. Between them is a dark green Rivian R2 SUV viewed from the front, with its illuminated front light bar and two round headlamp units lit white, and a bicycle mounted on its roof rack. A second bicycle leans in the left foreground. The setting is a forest of tall redwood trunks with green foliage behind. Composition: the vehicle is centred low in the frame and the people flank it; the image is cropped at the right edge and the bottom edge, running to the right edge of the slide and not boxed. Lighting: soft, diffuse natural daylight under forest canopy. Dominant colours: greens, dark brown trunks, deep teal-green vehicle, black clothing with red accents. No overlay or tint. The RIVIAN wordmark in black at bottom left is the only logo.
Slide 5
RIVIAN
Progress on Rivian's Strategic Priorities
Scaling R2 production and deliveries enables path to profitability
Drive Towards Profitability
• Started production of saleable R2 vehicles and made first deliveries to employees
• On April 4, began paid subscriptions for Autonomy+ priced at either a one-time fee
of $2,500 or $49.99 per month
Optimize Operational Efficiency
• With the start of R2 production in Normal, we expect to see significant fixed cost
efficiencies over the coming quarters as we drive increased production volume
• Updated the capacity for our Georgia plant allowing for a 50% increase in initial production
capacity to 300,000 units annually which is expected to significantly boost cost efficiency,
while still providing significant room for future expansion in later phases
Technology Focus
• RV Tech successfully completed winter weather testing of production-intent zonal architecture
for the first generation of software-defined vehicles, unlocking a $1 billion equity investment
into Rivian which we received today
• Rivian was recognized by Fortune Magazine on its “America's Most Innovative Companies”1
list and by Newsweek as “Technology disruptor of the year”2
Demand Generation and Enhancing the Customer Experience
• 2026 R1S awarded TOP SAFETY PICK+ designation by Insurance Institute for Highway
Safety (IIHS-HLDI), reinforcing Rivian’s commitment to safety at the core of its products3
• We opened our 100th service center in the quarter and also have over 680 mobile
service vans as we scale our infrastructure to support mass market volume with R2
1 https://fortune.com/ranking/americas-most-innovative-companies/
2 https://www.newsweek.com/2025/05/02/key-decisions-face-adversity-have-helped-rivian-turn-profit-2056421.html
3 https://www.iihs.org/ratings/top-safety-picks/2026/all/rivian?tspPlusOnly#award-winners
Q1 2026 Earnings Presentation
© 2026 Rivian. All rights reserved.
5
Visuals: One photograph in the right column: a dark charcoal-blue Rivian R1S SUV seen from three-quarter front, driving downhill toward the viewer on a pale dirt track through rocky, scrubby hillside. Low warm sunlight from the upper left creates a golden dust haze and backlight on the vegetation; the headlights are lit and a light bar glows across the front. Dominant colours: olive and sage green, tan and ochre, brown rock, deep shadowed slate. Framing is wide and landscape, with the vehicle in the lower-middle right, the photo cropped at the right slide edge, boxed at top and bottom (not full-bleed, no overlay or tint). One small raster logo: the black RIVIAN wordmark at bottom left, a plain horizontal wordmark with widely spaced capitals.
Slide 6
R2 is Designed for Big Adventures / and Everyday Use
Production of saleable R2 commenced with external customer deliveries / expected in the coming weeks
Trims, Pricing and First Deliveries from Normal
In an American automotive marketplace starved for high-quality EV choice, we believe / R2 is an attractively priced option sized for everyday adventures — from school pickups to / weekend excursions. R2 brings Rivian’s design, performance and technology to a significantly / broader audience with an array of trims to accommodate our customers' varying needs / and driving styles:
• R2 Performance debuts in the spring and is the most capable R2 on- and -off road; / it is a dual-motor AWD variant with a staggering 656 horsepower and an EPA-estimated / range of up to 330 miles
• R2 Premium is expected to be available late this year and is elevated inside and out; / it features a dual-motor AWD setup that produces 450 horsepower and an EPA-estimated / range of up to 330 miles
• R2 Standard is expected to be available in the first half of 2027 and redefines expectations / for the mid-size SUV segment; the RWD long-range configuration of R2 Standard delivers / 350 horsepower and a Rivian-estimated range of up to 345 miles
• An additional R2 Standard variant starting at around $45,000 is expected to start / deliveries in late 2027
We were excited to celebrate another key milestone with the start of saleable R2 series / production last week. This key step is the culmination of hard work from so many team / members as we gear up for expected customer deliveries to the public in the coming weeks. / We’ve already begun delivering R2 vehicles to our employees. We could not be more excited / to get this incredible vehicle in the hands of our customers this spring.
RIVIAN
Q1 2026 Earnings Presentation
© 2026 Rivian. All rights reserved.
6
Visuals: Two photographs in the right column. Top photo: a bright industrial assembly hall with white steel columns and roof trusses; three men stand in a close group in the foreground. The man on the left wears a grey t-shirt and clear safety glasses and is smiling while clasping a fist with the man in the centre, who wears a navy collared shirt and glasses and is laughing. The man on the right wears clear safety glasses, an olive-green t-shirt and a black and yellow reflective hi-vis vest, and gestures with his hand. Behind them a teal-blue Rivian R2 has its door open and several workers in olive-green shirts stand around. Lighting is soft, even daylight from overhead; dominant colours are white, grey, olive green and teal. The photo is boxed and cropped by the right slide edge. Bottom photo: an elevated aerial view of an outdoor demonstration course. A silver-grey Rivian R2 with a blue front and a panoramic roof is driving or parked on a brown dirt track edged by white concrete barriers. Tall orange RIVIAN banners on poles line the track and a grey metal gantry frame crosses above it. Green tree canopies fill the left side, and parked vehicles, buildings and a paved street fill the right side. Natural daylight; dominant colours are green, brown dirt, orange and grey. The photo is boxed and cropped by the right slide edge, with no overlay or tint. No icons or charts.
Slide 7
Profitably Delivering R2 at an Accessible Price
R2 bill of materials expected to be approximately 50% of R1 and non-BOM costs expected to / decline greater than 50% due to focus on design for manufacturing and fixed cost efficiencies 1
Key Design Changes & Sourcing Leverage
Structural cost reductions from design changes, sourcing leverage and manufacturing simplicity 2
Front Suspension
Strut architecture delivering / over 70% savings vs. / R1 double-wishbone
Low Voltage Harnesses
2.3 mile reduction in harness length / and over 60% reduction in the / number of in-line connectors
Maximus Drive Unit
~30% piece cost savings; / integrated side-mounted / inverter
Battery Pack
Floor to pack design; / 4695 Structural Pack
Power Conversion
5-to-1 module consolidation / with integrated electronics; / ~70% reduction in / high-voltage cabling
Underbody Structure
Utilizing large high pressure / die casting resulting in / over 90% fewer parts and / ~30% piece cost reduction
Front Windshield
~50% savings / predominantly from / sourcing leverage
Corner Radar and / Ultrasonic Sensors
Over 50% savings from / removing the ultrasonic / sensors and sourcing / leverage on corner radars
Rear Doors
~65% part count reduction and / ~55% savings from design / optimization
Fixed Costs
Depreciation and conversion costs absorbed over more units increasing profitability
1 Based on average vehicle cost as of the end of 2027
2 Percentage savings represent the expected decrease in cost of components for R2 vs. R1 production
RIVIAN
Q1 2026 Earnings Presentation
© 2026 Rivian. All rights reserved.
7
Visuals: Nine product images, one per card. (1) Front Suspension: grey 3D render of a front strut and double-wishbone-style suspension assembly with two coil-over struts, brake discs and subframe, angled view on white, mid-grey tones. (2) Low Voltage Harnesses: translucent grey render of a vehicle outline with wiring harness routes in blue, green and red, dense bundles through the body. (3) Maximus Drive Unit: dark grey render of an electric drive unit with a box-shaped side-mounted inverter and cables at the right, white background. (4) Battery Pack: top-down render of a floor-to-pack battery with four wheel corners at the outer edges and a central grey honeycomb-patterned pack, white background. (5) Power Conversion: translucent grey car outline with labels R1 at top-left and R2 at top-right; small coloured modules (orange, green, blue) linked by thin grey lines to a dark grey power electronics box at right. (6) Underbody Structure: three grey die-cast underbody castings, one long bar at upper right and two nodal pieces at left and lower centre, white background. (7) Front Windshield: monochrome grey photo of the front of a vehicle showing windshield, roof edge and bonnet, low-key lighting, cropped to a rectangle with no border. (8) Corner Radar and Ultrasonic Sensors: photo of the rear corner of a white vehicle with a dark grey bumper, a black sensor bracket and a radar unit, rectangular crop. (9) Rear Doors: rear passenger door in silver-grey exterior with a dark grey interior trim panel and window opening, white background, cut out. Footer: RIVIAN black letter-spaced wordmark logo.
Slide 8
Optimized Capacity for Georgia Plant
50% increase in phase one expected to boost cost efficiency
and support thousands of U.S. manufacturing jobs
We updated capacity for our Georgia plant allowing for a 50% increase in initial production capacity to 300,000 units annually for our mid-sized platform. This change is expected to boost cost efficiency, while still providing significant room for future expansion in later phases. The company remains on track for vehicle production in Georgia to begin in late 2028.
As part of this new vision for our Georgia facility, Rivian worked with the Department of Energy to make strategic changes to the company’s DOE loan. The up to $4.5 billion loan ($4,006 million principal and $494 million capitalized interest) provides low-cost financing for our Georgia plant. Rivian expects to draw on the loan by early 2027, subject to meeting certain conditions.
Expected Annual Capacity
300,000
215,000
R1, R2 and EDV
Mid-sized Platform
Normal, Illinois
Stanton Springs, Georgia (Phase 1)
Expected Late 2028
Site capacity does not equal current production rates. There may be limitations discovered as production rates approach capacity. Production rates depend on a variety of factors, including equipment uptime, component supply, downtime related to factory upgrades, regulatory considerations and other factors.
Rendering of Future Georgia Facility
Q1 2026 Earnings Presentation
© 2026 Rivian. All rights reserved.
8
Visuals: One column bar chart inside a white panel. Chart title: 'Expected Annual Capacity' (bold, top-left of the panel). Y axis: none shown, no scale or gridlines. Horizontal baseline: thin grey line across the bottom of the bars. Two bars: (1) 'Normal, Illinois' bar, value printed above as 215,000, bar labelled inside 'R1, R2 and EDV', the shorter bar; (2) 'Stanton Springs, Georgia (Phase 1)' bar, value printed above as 300,000, bar labelled inside 'Mid-sized Platform', the taller bar, with 'Expected Late 2028' beneath its category label. Both bars are a semi-transparent slate blue-grey (#7E979E at 62% opacity, rendering as about #AFBEC3 on white). No legend, no highlighted points, no units printed beyond the numbers themselves. Photograph: aerial rendering of a future manufacturing facility. Subject: a large flat-roofed white factory complex with several connected wings and a central courtyard, surrounded by rows of parked vehicles in large lots, dense forest on rolling hills, ponds, and winding access roads. Composition: high three-quarter aerial view, the factory diagonal across the centre-right, framed to the slide's right edge (cropped at right and bleeding off it), with top and bottom edges inset. Lighting: low warm golden sunlight from the upper left with glare on the white roofs, soft haze. Dominant colours: greens, golden tan, white and grey. No overlay or tint is visible beyond the white caption text. Logo: RIVIAN wordmark at bottom-left, black, widely letter-spaced capitals.
Slide 9
Strategic Partnerships Update
Highlights extensibility of our technology and vehicle programs to drive value
Robotaxi Partnership with Uber
In March, we announced a new partnership with Uber to accelerate our shared autonomous
vehicle goals, including plans for future R2 robotaxis. We believe this partnership is an
important validation of our technology roadmap and vertically integrated approach. At the
core of our platform is the Rivian Autonomy Processor (RAP1), our multi-modal perception
platform (cameras, radar and LiDAR) and our AI-based approach to building our Large
Driving Model with the data flywheel from our growing car parc.
Key elements of the partnership included an expected investment of up to $1.25 billion
in Rivian through 2031 based on the achievement of autonomous performance milestones,
a vehicle purchase commitment by Uber, or its fleet partners, for up to 50,000 fully
autonomous R2 robotaxis and certain software licensing fees in connection with its use of
Rivian’s Level 4 autonomous driving software system, subject to meeting certain conditions.
Completion of Key Winter Testing Milestones by RV Tech
In March, RV Tech successfully completed winter testing of production-intent
zonal architecture developed for the first generation of Volkswagen Group
software-defined vehicles.
Testing took place over several months in Phoenix (USA) and Arjeplog (Sweden)
by a joint team from Volkswagen, Audi, and Scout brands and RV Tech. Tests included
validating functionality and performance of the electronics and software, including OTA
functionality — an important milestone for the joint venture’s ongoing development work.
This milestone unlocked the next phase of equity investment from Volkswagen Group
to Rivian of $1 billion which we received today.
RIVIAN
Q1 2026 Earnings Presentation
© 2026 Rivian. All rights reserved.
9
Visuals: Two photographs. Left: a dark grey Rivian R2 SUV seen head-on at dusk on a rooftop parking deck, with its full-width light bar and two round headlamps glowing white; two people stand behind it at the right, and a city skyline with lit towers fills the background under a pink-orange sky; a red-brown concrete wall runs behind the car; dominant colours are dark charcoal, magenta-red and warm amber; framed as a rectangle, not cropped in a special shape. Right: a white Volkswagen-style compact hatchback driving away on a flat snow-covered plain at sunrise, kicking up a plume of snow behind it; a line of dark trees sits on the horizon under a hazy golden sky; lighting is low warm sunlight; dominant colours are amber, gold, and muted mauve-brown; rectangular frame with no overlay.
Slide 10
Strategic Investments Update / Funding momentum for Rivian spin out companies / Mind Robotics Series A Funding / Late last year, the company established Mind Robotics to address a structural gap / with current industrial automation solutions. Existing industrial robotics can perform / repeatable dimensionally stable tasks, but a large share of factory value-add work / requires human-like dexterity, adaptation and physical reasoning that current robotics / cannot address. Mind Robotics is building the AI foundation — models, hardware, / and deployment infrastructure — to close that gap. / In March, Mind Robotics announced it raised $500 million in a Series A funding co-led / by venture capital firms Accel and Andreessen Horowitz. As of March 31, 2026, Rivian’s / ownership interest was approximately 38% on a shares outstanding basis. / ALSO. Series C Funding and DoorDash Partnership / Bike lanes, shoulders and curbsides are the areas that make up the hardest part / of the last-mile delivery puzzle. They are also where traditional vehicles struggle / most and where smaller, more adaptable EVs like those being designed by ALSO / have the greatest opportunity to perform. / In March ALSO, Rivian’s micro mobility spin-off, announced a strategic investment / and multi-year commercial collaboration with DoorDash to develop and deploy small, / purpose-built EVs designed to optimize how goods move in dynamic, population-dense / environments. This collaboration comes alongside ALSO’s $200 million Series C financing / round led by Greenoaks, with participation from Prysm Capital and strategic investment / from DoorDash. In addition, Amazon has partnered with ALSO to purchase thousands of / pedal-assist electric cargo quads, known as the TM-Q. As of March 31, 2026, Rivian’s / ownership interest was approximately 35% on a shares outstanding basis. / Q1 2026 Earnings Presentation / © 2026 Rivian. All rights reserved. / 10
Visuals: Two visuals. (1) Mind Robotics logo, centred in the lower part of the left panel: a dark charcoal #2B2B2B mark of two tall rounded pill shapes joined by a solid circle between them, with the wordmark MIND ROBOTICS in charcoal sans-serif capitals beside it, stacked on two lines. No photograph, no chart, no table. (2) Product photograph of the ALSO vehicle lineup, in the lower part of the right panel, shown on a white studio background with soft even lighting and a faint floor shadow: from left, a black and grey pedal-assist cargo bicycle with a kickstand, a grey open-bed cargo trike, a white and grey scooter-style quad with purple accents, and a large grey and black enclosed cargo box vehicle with a large window on the front and the word ALSO. printed in dark letters on its side panel, with a small purple light under the side. The image is placed unboxed with no crop and no overlay.
Slide 11
Summary Financial Performance and Operating Metrics / Building for an adventurous future that is fully electric, autonomous and AI-defined / Q1 2025 | Q2 2025 | Q3 2025 | Q4 2025 | Q1 2026 | YoY / Production and Deliveries / Delivery Volumes | 8,640 | 10,661 | 13,201 | 9,745 | 10,365 | 20% / Cumulative Delivery Volumes | 131,593 | 142,254 | 155,455 | 165,200 | 175,565 | 33% / Production Volumes | 14,611 | 5,979 | 10,720 | 10,974 | 10,236 | (30)% / Consolidated Financials ($M) / Revenue | $1,240 | $1,303 | $1,558 | $1,286 | $1,381 | 11% / Gross Profit | $206 | $(206) | $24 | $120 | $119 | $(87) / Adjusted EBITDA (Non-GAAP)1 | $(329) | $(667) | $(602) | $(465) | $(472) | $(143) / Service & Sales / Rivian Spaces | 27 | 31 | 35 | 36 | 39 | 44% / Rivian Service Centers | 74 | 81 | 95 | 97 | 100 | 35% / Demo Drives2 | 36,000+ | 28,000+ | 30,000+ | 24,000+ | 36,000+ | — / Rivian Adventure Network / Rivian Adventure Network Locations | 112 | 123 | 131 | 141 | 145 | 29% / Rivian Adventure Network Chargers | 703 | 781 | 850 | 937 | 973 | 38% / 1 A reconciliation of non-GAAP financial measures to the most comparable GAAP measure is provided later in this presentation. / 2 Includes marketing events and Electric Joyrides / RIVIAN / Q1 2026 Earnings Presentation / © 2026 Rivian. All rights reserved. / 11 / Keep the world adventurous forever (text printed on store window in photo)
Visuals: Four photographs stacked in the left column, each 23.9% of slide width and 16.3% of slide height, boxed (hard rectangular edges, no rounding, no overlay, not full-bleed). Top photo: a teal-blue Rivian R1T-style electric pickup and SUV shown front three-quarter, driving toward the viewer on a paved road through tall pines, with motion blur streaking the trees; warm daylight; dominant colours teal, green, brown and amber road. Second photo: five Rivian vehicles parked in a row on a grassy hillside in front of a dark tree line, left to right a blue pickup, a black pickup, a light grey pickup, a sand-coloured vehicle and a teal-green SUV; soft overcast light; dominant dark green, olive and tan. Third photo: exterior storefront of a Rivian retail space with the black RIVIAN wordmark on a white wall above glass doors with wooden frames, a grey Rivian truck and plants visible inside, blurred pedestrians at both sides, white window text reading Keep the world adventurous forever at left; bright daylight; dominant white, wood brown and green. Fourth photo: a white curved Rivian Adventure Network charger post with a vertical green light strip on its left edge and an amber diamond logo on a dark panel, set against a blue sky with white clouds and green trees; bright daylight; dominant blue, white and green. Table of numeric values is text, no chart. Small black RIVIAN wordmark logo in the footer at bottom-left.
Slide 12
Automotive Segment Performance
Delivery growth driven by increase in sales of commercial vans
Revenue
Deliveries
8,640
10,661
13,201
9,745
10,365
($M)
$922
$927
$1,142
$1,141
$924
$839
$908
$850
$810
$764
Regulatory Credits
Automotive Revenues
Excluding Regulatory Credits
Q1 2025
Q2 2025
Q3 2025
Q4 2025
Q1 2026
Gross Profit
Gross Margin
10%
(36)%
(11)%
(7)%
(7)%
$92
($M)
$(130)
$(335)
$(59)
$(62)
Q1 2025
Q2 2025
Q3 2025
Q4 2025
Q1 2026
Q1 2026 vs. Q1 2025 Commentary
• Automotive revenue decreased (2)% year-over-year primarily due to a $100 million decrease in sales of automotive regulatory credits and a decline in automotive revenue per unit delivered due to a higher mix of commercial vans, which were partially offset by a 20% increase in vehicle deliveries
• Automotive gross profit loss was $(62) million compared to $92 million for the same quarter in 2025, primarily due to the $100 million decrease in revenue from the sales of automotive regulatory credits and lower production volumes resulting in a $42 million and $3 million increase in depreciation and stock-based compensation expenses, respectively
Q1 2026 Earnings Presentation
© 2026 Rivian. All rights reserved.
12
Visuals: Two bar charts. Chart 1, Revenue, is a stacked column chart titled Revenue with the axis label ($M) at left. It has five categories: Q1 2025, Q2 2025, Q3 2025, Q4 2025, Q1 2026, with no numeric axis or gridlines. Each column's total is printed above it: $922, $927, $1,142, $839, $908. The lower segment, Automotive Revenues Excluding Regulatory Credits, is printed inside each bar: $764, $924, $1,141, $810, $850. The upper segment, Regulatory Credits, is dark grey and unlabelled; its implied values are about $158, about $3, about $1, about $29 and about $58. Above the bars is a row of five white boxed delivery counts labelled Deliveries: 8,640; 10,661; 13,201; 9,745; 10,365. The legend sits at right of the chart: a dark grey square for Regulatory Credits and a light grey-teal square for Automotive Revenues Excluding Regulatory Credits. Chart 2, Gross Profit, is a column chart with a horizontal zero baseline and the axis label ($M) at left. Values: Q1 2025 $92 (above baseline), Q2 2025 $(335), Q3 2025 $(130), Q4 2025 $(59), Q1 2026 $(62), all below baseline except Q1 2025. Above the chart is a row of five boxed Gross Margin values: 10%, (36)%, (11)%, (7)%, (7)%. No highlighted points. Logo: RIVIAN wordmark in the footer, black, widely letterspaced capitals.
Slide 13
Software and Services Segment Performance
Robust revenue growth driven by vehicle electrical architecture and software development services for RV Tech
Revenue
($M)
$318
$376
$416
$447
$473
Q1 2025
Q2 2025
Q3 2025
Q4 2025
Q1 2026
Q1 2026 vs. Q1 2025 Commentary
• Software and services revenue saw a
49% increase year-over-year primarily due
to an increase in vehicle electrical architecture
and software development services from
RV Tech, as well as increases in vehicle repair
and maintenance services and remarketing
• Software and services gross profit was
$181 million compared to $114 million for
the same quarter in 2025, primarily due
to increased vehicle electrical architecture
and software development services from
the joint venture with Volkswagen Group
and increased vehicle repair and
maintenance services
Gross Profit
Gross Margin
36%
34%
37%
40%
38%
($M)
$114
$129
$154
$179
$181
Q1 2025
Q2 2025
Q3 2025
Q4 2025
Q1 2026
RIVIAN
Q1 2026 Earnings Presentation
© 2026 Rivian. All rights reserved.
13
Visuals: Two vertical bar charts stacked in white panels. Chart 1: vertical bar chart titled Revenue, unit ($M) shown at the left of the y-axis, no printed y-axis scale; bar values printed above each bar. Categories on x-axis: Q1 2025, Q2 2025, Q3 2025, Q4 2025, Q1 2026. Series (single series, colour #A6B5B5 grey-green): Q1 2025 $318, Q2 2025 $376, Q3 2025 $416, Q4 2025 $447, Q1 2026 $473. Bar heights are proportional to these values, with a thin grey horizontal baseline at about 46.8% of slide height. No legend. No highlighted points. Chart 2: vertical bar chart titled Gross Profit, unit ($M) at the left of the y-axis, no printed y-axis scale; values printed above each bar. Categories: Q1 2025, Q2 2025, Q3 2025, Q4 2025, Q1 2026. Series (single series, colour #71949A teal-grey): Q1 2025 $114, Q2 2025 $129, Q3 2025 $154, Q4 2025 $179, Q1 2026 $181. Thin grey baseline at about 88% of slide height. Above the bars, a row labelled Gross Margin contains five white rectangles with thin light grey outlines, each holding a percentage: 36%, 34%, 37%, 40%, 38%, aligned over Q1 2025 through Q1 2026. No legend. No highlighted points. The RIVIAN wordmark at bottom left is a logo, dark charcoal text in widely spaced capitals. No photographs or illustrations.
Slide 14
Balance Sheet and Liquidity
Liquidity profile remains strong, with $5.4B of available liquidity and $2.55B of expected capital in 2026
Debt Maturity Schedule
$4,000
$3,500
$3,000
$2,500
$2,000
$1,500
$1,000
$500
$—
($M)
$1,500
ABL
Facility
(Undrawn)
$1,725
2030
Convert
$1,500
2029
Convert
$1,250
1L Notes
2026
2027
2028
2029
2030
2031
Available Liquidity
($M)
Cash, Cash Equivalents and Short-Term Investments1
$4,830
Availability under ABL Facility2
564
Total Available Liquidity
$5,394
Expected Capital in 2026
Volkswagen Group Equity Investment3
$1,000
Signing Uber Technologies Equity Investment4
300
Volkswagen Group Non-Recourse Loan5
1,000
Milestone Based Uber Technologies Equity Investment6
250
Total Available Liquidity and Expected Capital in 2026
$7,944
Additional Expected Capital
Volkswagen Group Equity Investment7
$460
Milestone Based Uber Technologies Equity Investment8
700
Department of Energy Loan (Principal + Capitalized Interest)9
4,500
Total Available Liquidity and Expected Future Capital
$13,604
1 Based on balances as of March 31, 2026
2 As of March 31, 2026 the company had availability under the ABL Facility of $564M after giving effect to the borrowing base and outstanding letters of credit
3 Volkswagen Group equity investment of $1,000M related to the successful completion of vehicle winter testing milestones which we received today
4 Uber Technologies initial equity investment of $300M committed at signing and expected to close in the second quarter of 2026, subject to certain conditions
5 Expected loan from Volkswagen Group at Rivian’s option in October 2026
6 Uber Technologies first milestone based investment of $250M which we expect to receive by the end of 2026 subject to the achievement of certain autonomy milestones and conditions
7 An additional Volkswagen Group equity investment of $460M is anticipated at the earlier of the first Volkswagen Group vehicle with RV Tech hardware and software on the road, or January 2028
8 Additional investment of up to $700M by Uber Technologies is anticipated through 2031 subject to the achievement of certain autonomous milestones and conditions by specific dates, building towards a scaled, fully-autonomous fleet of Rivian R2 robotaxis
9 Maximum expected Department of Energy loan of $4.5B ($4,006M principal and $494M capitalized interest) which is dependent on meeting certain conditions
RIVIAN
Q1 2026 Earnings Presentation
© 2026 Rivian. All rights reserved.
14
Visuals: Stacked column chart titled Debt Maturity Schedule inside a white panel. Y-axis labelled ($M) rotated vertically, running $— to $4,000 in $500 steps with light grey gridlines at each $500 step. X-axis shows years 2026, 2027, 2028, 2029, 2030, 2031. 2026, 2027 and 2028 have no bars. 2029 has one solid grey-green column (#798579) of $1,500 labelled 2029 Convert, top at about $1,500. 2030 has a grey-green column of $1,725 labelled 2030 Convert with a light grey (#B8B7B6) dashed-outline segment above it labelled $1,500 ABL Facility (Undrawn), reaching about $3,225 total; no point is highlighted beyond these labels. 2031 has a grey-green column of $1,250 labelled 1L Notes, top about $1,250. No legend. Right side: a two-column financial table (label column left, ($M) values right) with three bold section headings and horizontal black rules under Availability under ABL Facility, under Milestone Based Uber Technologies Equity Investment (Expected Capital), and under Department of Energy Loan. Rows: Available Liquidity: Cash, Cash Equivalents and Short-Term Investments 4,830; Availability under ABL Facility 564; Total Available Liquidity 5,394. Expected Capital in 2026: Volkswagen Group Equity Investment 1,000; Signing Uber Technologies Equity Investment 300; Volkswagen Group Non-Recourse Loan 1,000; Milestone Based Uber Technologies Equity Investment 250; Total Available Liquidity and Expected Capital in 2026 7,944. Additional Expected Capital: Volkswagen Group Equity Investment 460; Milestone Based Uber Technologies Equity Investment 700; Department of Energy Loan (Principal + Capitalized Interest) 4,500; Total Available Liquidity and Expected Future Capital 13,604. Superscript footnote numbers 1 to 9 follow labels.
Slide 15
Business Outlook
Over the course of fiscal year 2026, we remain
focused on our key strategic priorities:
• Technology leadership
• Demand generation and enhancing
the customer experience
• Optimize operational efficiency
• Drive towards profitability
2026 Guidance
Vehicles Delivered
62,000 – 67,000
Adjusted EBITDA
$(2.10B) – $(1.80B)
Capital Expenditures
$1.95B – $2.05B
RIVIAN
Q1 2026 Earnings Presentation
© 2026 Rivian. All rights reserved.
15
Visuals: One photograph and one table. Photograph: two Rivian electric SUVs parked side by side on a sandy-brown paved clifftop overlooking the ocean; the left vehicle is a white/light-grey model with its front three-quarter turned toward the viewer and the right vehicle is a teal/dark-green model in front, angled toward the viewer, with black wheels and roof. Behind them is a flat grey-green sea, a distant rock outcrop with white surf, and a pale blue-grey hazy sky with thin streaked clouds. Lighting is soft overcast daylight with no hard shadows; dominant colours are pale blue-grey sky, teal-green sea, sandy brown and white. The photo is cropped by the right slide edge and not boxed, with no overlay or tint. Table: 2 columns by 4 rows including a header. Header row: first cell empty, second cell '2026 Guidance' in bold. Row 1: 'Vehicles Delivered' | '62,000 – 67,000'. Row 2: 'Adjusted EBITDA' | '$(2.10B) – $(1.80B)'. Row 3: 'Capital Expenditures' | '$1.95B – $2.05B'. Rows 1 and 3 are filled light grey #DBDBDB, row 2 and the header are the slide background colour, and the cell divider is a thin white vertical line between the columns.
Slide 16
Financial Statements and / Non-GAAP Reconciliations
RIVIAN
Q1 2026 Earnings Presentation
© 2026 Rivian. All rights reserved.
16
Visuals: Photograph, full-bleed: a dark grey/black Rivian SUV with a bicycle carried on a rear rack is driving left-to-right and slightly toward the viewer along a curving tan dirt road. A plume of pale dust trails behind its rear wheels to the left. The vehicle occupies roughly the centre-right of the frame at about x 50 to 64%, y 40 to 54%. The camera is elevated, looking down the road across rolling green-and-tan grassy hills with sagebrush. A foreground band of purple-blue lupine flowers fills the bottom third. Lighting is soft natural daylight with no harsh shadows. Dominant colours: sage and olive greens, tan/beige dirt, violet-blue flowers, and the black vehicle. The image is not cropped or boxed and has no overlay or tint. Small RIVIAN wordmark logo at bottom-left in dark ink.
Slide 17
Quarterly Financial Performance / (in millions, except production, delivery, and gross margin) / (unaudited) / Three Months Ended / March 31, 2025 / June 30, 2025 / September 30, 2025 / December 31, 2025 / March 31, 2026 / Production 14,611 5,979 10,720 10,974 10,236 / Delivery 8,640 10,661 13,201 9,745 10,365 / Revenues / Automotive $ 922 $ 927 $ 1,142 $ 839 $ 908 / Software and services 318 376 416 447 473 / Total revenues $ 1,240 $ 1,303 $ 1,558 $ 1,286 $ 1,381 / Cost of revenues / Automotive $ 830 $ 1,262 $ 1,272 $ 898 $ 970 / Software and services 204 247 262 268 292 / Total cost of revenues $ 1,034 $ 1,509 $ 1,534 $ 1,166 $ 1,262 / Gross profit $ 206 $ (206) $ 24 $ 120 $ 119 / Gross margin 17 % (16) % 2 % 9 % 9 % / Research and development $ 381 $ 410 $ 453 $ 424 $ 458 / Selling, general, and administrative 480 498 554 529 542 / Total operating expenses $ 861 $ 908 $ 1,007 $ 953 $ 1,000 / Adjusted research and development (non-GAAP)¹ $ 285 $ 316 $ 361 $ 328 $ 348 / Adjusted selling, general, and administrative (non-GAAP)¹ 345 365 422 384 392 / Total adjusted operating expenses (non-GAAP)¹ $ 630 $ 681 $ 783 $ 712 $ 740 / Adjusted EBITDA (non-GAAP)¹ $ (329) $ (667) $ (602) $ (465) $ (472) / Cash, cash equivalents, and short-term investments $ 7,178 $ 7,508 $ 7,088 $ 6,082 $ 4,830 / Net cash (used)/provided by operating activities $ (188) $ 64 $ 26 $ (681) $ (703) / Capital expenditures (338) (462) (447) (463) (372) / Free cash flow (non-GAAP)¹ $ (526) $ (398) $ (421) $ (1,144) $ (1,075) / Total depreciation and amortization expense $ 147 $ 254 $ 198 $ 187 $ 202 / Total stock-based compensation expense $ 183 $ 195 $ 175 $ 188 $ 207 / ¹A reconciliation of non-GAAP financial measures to the most comparable GAAP measure is provided later in this presentation. / RIVIAN / Q1 2026 Earnings Presentation / © 2026 Rivian. All rights reserved. / 17
Visuals: Table with 6 columns: a row-label column (x 4.1 to 26.0 percent) and five value columns headed March 31, 2025 / June 30, 2025 / September 30, 2025 / December 31, 2025 / March 31, 2026, each about 12.9 percent wide. Rows, top to bottom: Production (14,611; 5,979; 10,720; 10,974; 10,236); Delivery (8,640; 10,661; 13,201; 9,745; 10,365); section label Revenues; Automotive ($922; $927; $1,142; $839; $908); Software and services (318; 376; 416; 447; 473); Total revenues ($1,240; $1,303; $1,558; $1,286; $1,381); section label Cost of revenues; Automotive ($830; $1,262; $1,272; $898; $970); Software and services (204; 247; 262; 268; 292); Total cost of revenues ($1,034; $1,509; $1,534; $1,166; $1,262); Gross profit ($206; $(206); $24; $120; $119); Gross margin (17 %; (16)%; 2 %; 9 %; 9 %); Research and development ($381; $410; $453; $424; $458); Selling, general, and administrative (480; 498; 554; 529; 542); Total operating expenses ($861; $908; $1,007; $953; $1,000); Adjusted research and development (non-GAAP)¹ ($285; $316; $361; $328; $348); Adjusted selling, general, and administrative (non-GAAP)¹ (345; 365; 422; 384; 392); Total adjusted operating expenses (non-GAAP)¹ ($630; $681; $783; $712; $740); Adjusted EBITDA (non-GAAP)¹ ($(329); $(667); $(602); $(465); $(472)); Cash, cash equivalents, and short-term investments ($7,178; $7,508; $7,088; $6,082; $4,830); Net cash (used)/provided by operating activities ($(188); $64; $26; $(681); $(703)); Capital expenditures ((338); (462); (447); (463); (372)); Free cash flow (non-GAAP)¹ ($(526); $(398); $(421); $(1,144); $(1,075)); Total depreciation and amortization expense ($147; $254; $198; $187; $202); Total stock-based compensation expense ($183; $195; $175; $188; $207). Bold rows are totals and key lines (Production, Delivery, Total revenues, Total cost of revenues, Gross profit, Gross margin, Total operating expenses, Total adjusted operating expenses, Adjusted EBITDA, Cash, Free cash flow, Total depreciation, Total stock-based compensation). Grey #C3C7C3 filled bands sit behind the Production/Delivery rows, the total rows, the Gross profit and Gross margin rows, the Adjusted EBITDA and Cash rows, the Free cash flow row, and the depreciation and stock-based compensation rows, with thin black rules under them. No charts, photographs or icons appear on the slide apart from the RIVIAN wordmark in the footer.
Slide 18
Condensed Consolidated Balance Sheets1
(in millions, except per share amounts)
(unaudited)
Assets
December 31, 2025
March 31, 2026
Current assets:
Cash and cash equivalents $ 3,579 $ 2,845
Short-term investments 2,503 1,985
Accounts receivable, net 555 342
Inventory 1,594 1,543
Other current assets 361 330
Total current assets 8,592 7,045
Property, plant, and equipment, net 5,119 5,434
Operating lease assets, net 571 601
Strategic investments 119 669
Other non-current assets 463 484
Total assets $ 14,864 $ 14,233
Liabilities and Stockholders’ Equity
Current liabilities:
Accounts payable $ 595 $ 754
Accrued liabilities 1,438 1,045
Current portion of deferred revenues, lease liabilities, and other liabilities 1,660 1,554
Total current liabilities 3,693 3,353
Long-term debt 4,440 4,442
Non-current lease liabilities 551 580
Other non-current liabilities 1,586 1,429
Total liabilities 10,270 9,804
Commitments and contingencies
Stockholders' equity:
Preferred stock, $ 0.001 par value; 10 shares authorized and 0 shares issued and outstanding as of December 31, 2025 and March 31, 2026 — —
Common stock, $0.001 par value; 5,258 and 5,258 shares authorized and 1,240 and 1,260 shares issued and outstanding as of December 31, 2025 and March 31, 2026, respectively 1 1
Additional paid-in capital 31,508 31,767
Accumulated deficit (26,951) (27,367)
Accumulated other comprehensive income 8 2
Noncontrolling interest 28 26
Total stockholders' equity 4,594 4,429
Total liabilities and stockholders' equity $ 14,864 $ 14,233
1 The prior period has been recast to conform to current period presentation.
RIVIAN
Q1 2026 Earnings Presentation
© 2026 Rivian. All rights reserved.
18
Visuals: Table with three columns: line item label (x 4.1 to 42%), December 31, 2025 (x 43 to 52%), March 31, 2026 (x 52.8 to 62%). Section headers: Assets; Liabilities and Stockholders' Equity. Rows: Current assets: (header); Cash and cash equivalents $3,579 / $2,845; Short-term investments 2,503 / 1,985; Accounts receivable, net 555 / 342; Inventory 1,594 / 1,543; Other current assets 361 / 330; Total current assets 8,592 / 7,045; Property, plant, and equipment, net 5,119 / 5,434; Operating lease assets, net 571 / 601; Strategic investments 119 / 669; Other non-current assets 463 / 484; Total assets $14,864 / $14,233. Current liabilities: (header); Accounts payable $595 / $754; Accrued liabilities 1,438 / 1,045; Current portion of deferred revenues, lease liabilities, and other liabilities 1,660 / 1,554; Total current liabilities 3,693 / 3,353; Long-term debt 4,440 / 4,442; Non-current lease liabilities 551 / 580; Other non-current liabilities 1,586 / 1,429; Total liabilities 10,270 / 9,804; Commitments and contingencies (header); Stockholders' equity: (header); Preferred stock row with dashes / dashes; Common stock row 1 / 1; Additional paid-in capital 31,508 / 31,767; Accumulated deficit (26,951) / (27,367); Accumulated other comprehensive income 8 / 2; Noncontrolling interest 28 / 26; Total stockholders' equity 4,594 / 4,429; Total liabilities and stockholders' equity $14,864 / $14,233. Highlighted rows: subtotal and total rows (Total current assets, Total assets, Total current liabilities, Total liabilities, Total stockholders' equity, Total liabilities and stockholders' equity) carry bold text. Alternate rows of the label column and value cells have light grey bands; total rows have a darker grey band (#C3C7C3). Thin dark rules sit under the column headers, above and below the total rows.
Slides 19 to 28 continue in the full text file.
Download this deck
The hosted PDF of every library deck is free for readers of the SlideDeck Co newsletter. Join with your email and the viewer and download appear here.
Preparing a results presentation or business update of your own? The SlideDeck Co Standard Deck is a slide library for business reviews, updates and plans.







