
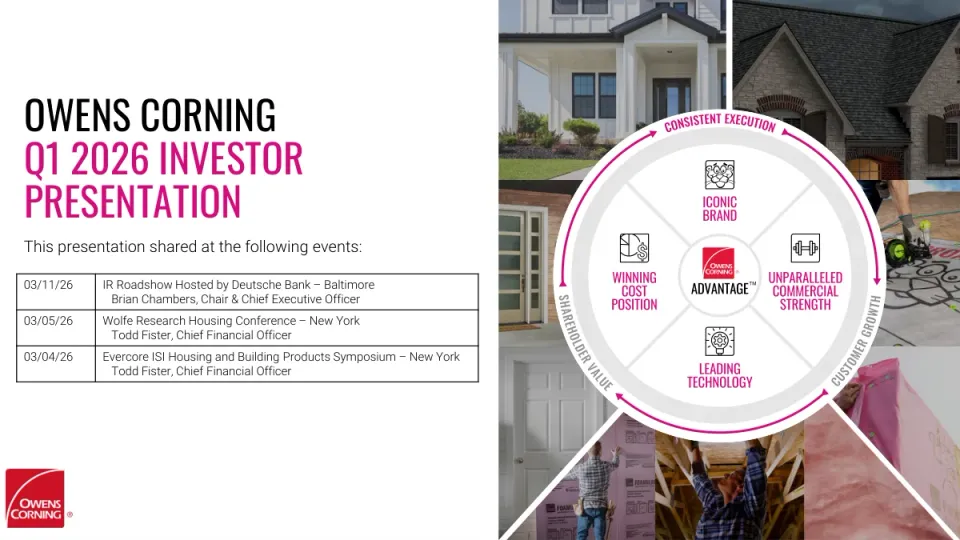
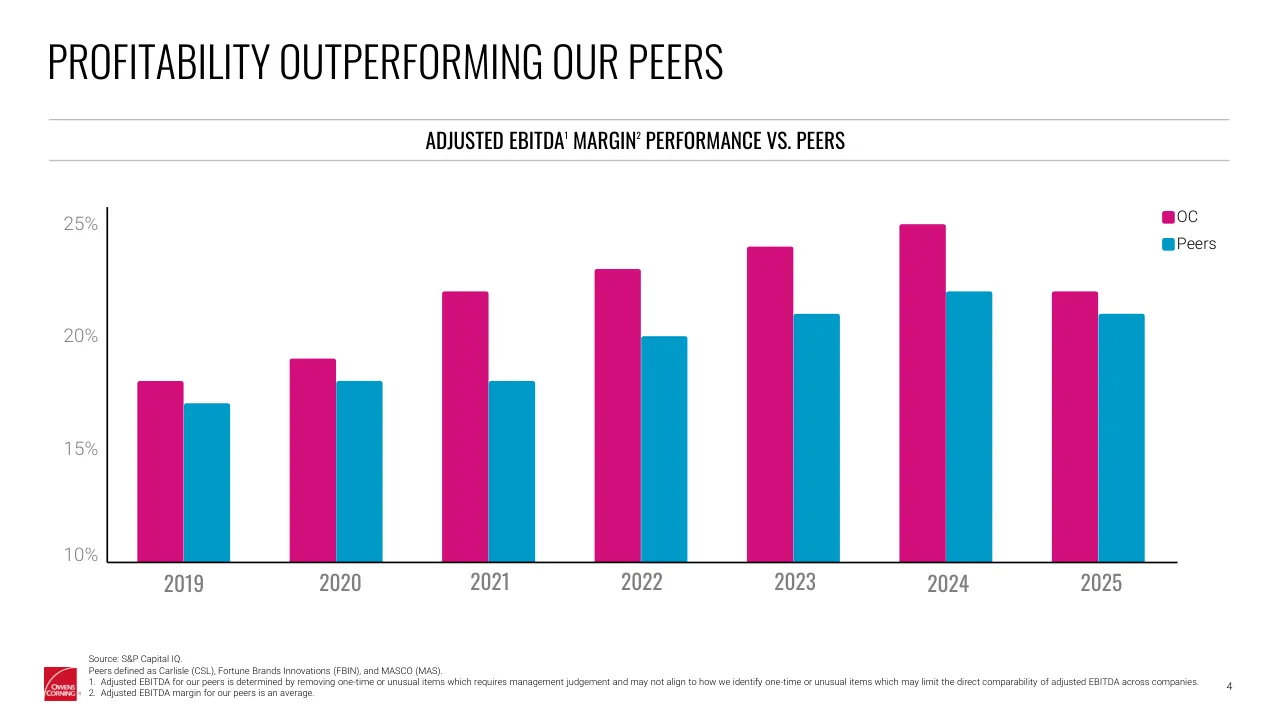
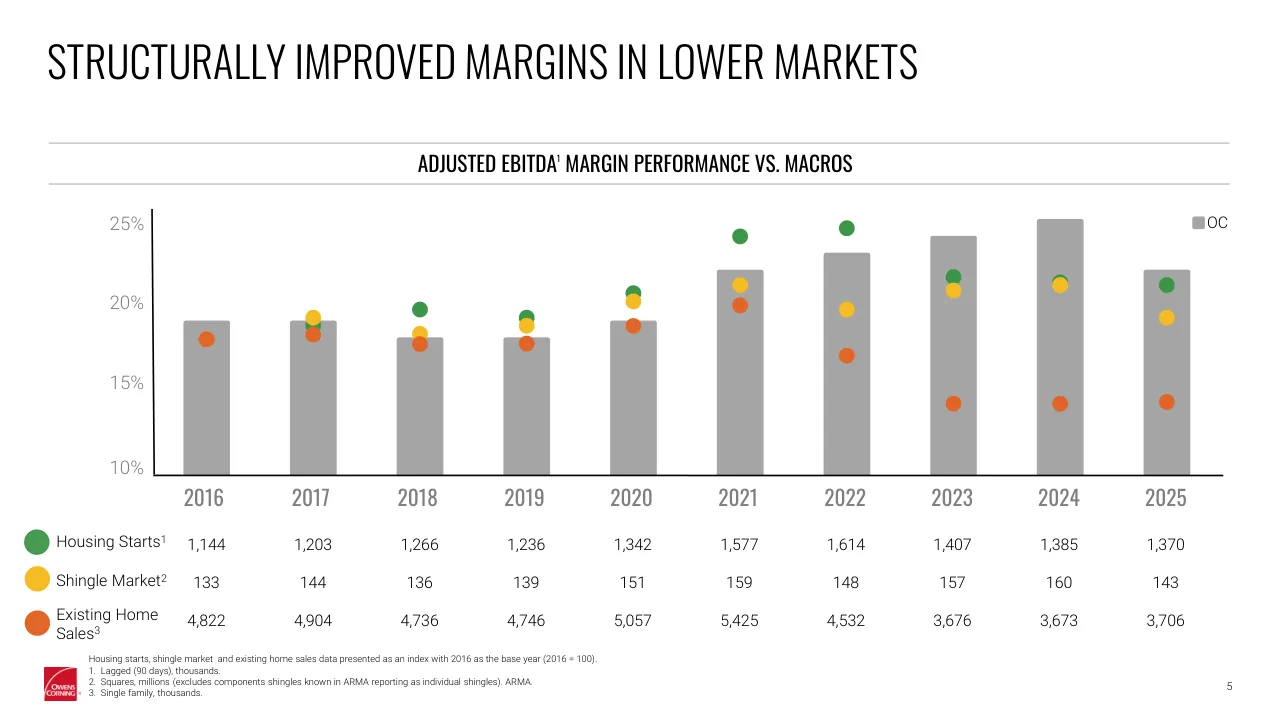
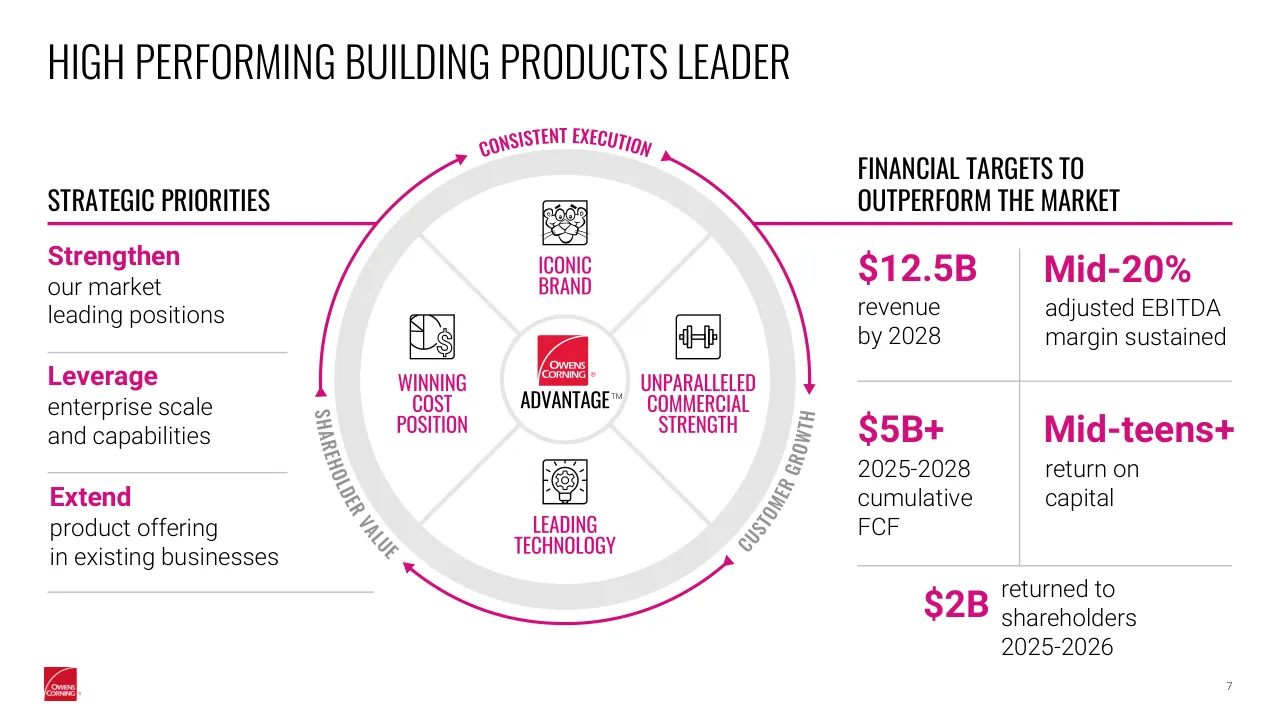
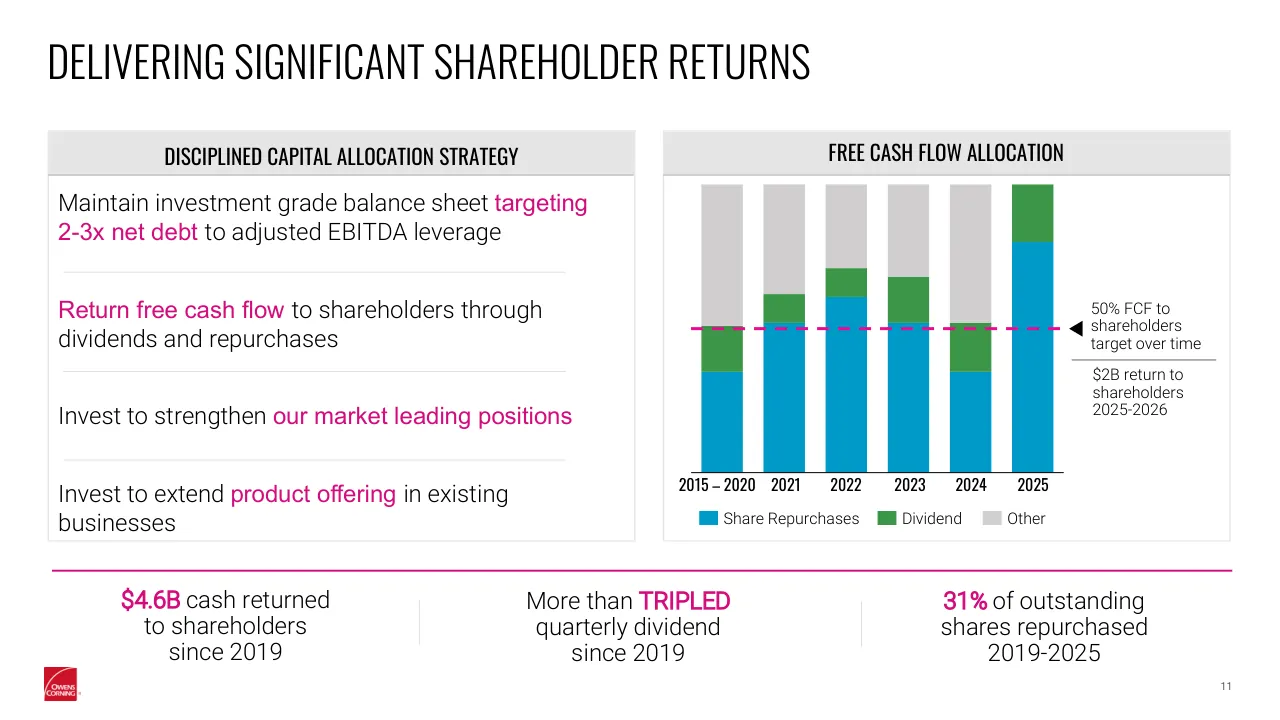
This Q1 2026 investor presentation from Owens Corning opens with a title slide listing the investor conferences where it was shared, followed by forward-looking statements and non-GAAP disclaimers. It then introduces the company as a building products leader with three businesses (Roofing, Insulation and Doors), shows revenue by end market and geography, and compares its adjusted EBITDA margin with peers and against housing and shingle market data. Next come margin assumptions by segment, strategic priorities and financial targets through 2028, and capital allocation and capex plans. Segment sections for Roofing, Insulation and Doors follow, covering market position, secular trends and cost initiatives, with appendices holding market data, key financial tables, revenue disaggregation and non-GAAP reconciliations. The deck closes with reconciliation tables rather than a call to action. Slides worth studying include the peer margin comparison on slide 4, which pairs company and peer data on one chart, the margin-versus-macro overlay on slide 5, the strategic priorities and targets layout on slide 7, and the cash flow and capital allocation charts on slides 10 and 11.
Slides worth studying
Questions about this deck
How many slides does the Owens Corning Q1 2026 investor presentation have?
The Owens Corning Q1 2026 investor presentation has 31 pages in total. Slide 1 is the title slide, which lists the investor events where the presentation was shared.
What financial targets does the Owens Corning presentation set through 2028?
Slide 7 lists financial targets to outperform the market: $12.5B revenue by 2028, a mid-20% adjusted EBITDA margin sustained, $5B+ 2025-2028 cumulative FCF, and mid-teens+ return on capital. It also lists $2B returned to shareholders 2025-2026.
What does the Owens Corning deck say about cost synergies in its Doors business?
Slide 20 states that Owens Corning identified an additional $75 million of synergies above the original $125 million enterprise commitment. Slide 20 also lists network optimization, automation and other efficiency as cost improvement priorities.
How does Owens Corning's adjusted EBITDA margin compare with peers in its deck?
Slide 4, titled Profitability Outperforming Our Peers, charts Owens Corning's adjusted EBITDA margin against peers from 2019 to 2025 on one chart. The peers are defined as Carlisle (CSL), Fortune Brands Innovations (FBIN), and MASCO (MAS), and the peer figures are averages.
Details
- Company: Owens Corning
- Year: 2026
- Type: Investor presentation
- Industry: Building Products
- Pages: 31
Review score: 7 out of 10, Effective
Presentation quality, judged with the SlideDeck Co review heuristic. Ask, evidence and idea merit are not rated here.
The deck has a clear, consistent identity and a sensible route: company overview, margin proof (slides 4 to 6), strategy and targets (7 to 9), capital allocation (10 to 12), then one section per segment, with the reconciliations tucked into appendices. Slide titles are mostly claims, charts use a restrained pink and grey palette that highlights the latest year, and slides 7, 10 and 11 are well composed and readable. The weaknesses are real, though: slide 5 overlays three indexed series on a percentage axis with a separate data table, so the reader cannot tell what the dots mean without effort; the y-axes on slides 4 and 5 start at 10%; and slides 8, 13, 14, 16 and 18 are dense, with small text. The appendix pages (25 to 31) are tiny, low-contrast tables, slide 31 uses a fraction of its page, and the deck ends on reconciliation tables with no closing summary.
Worth keeping: Keep the pink-highlighted current-year bars on slides 9 and 10, the strategy and targets layout on slide 7, and the claim-style titles that carry the argument.
Most useful repair: Redraw slide 5 so each series has a readable scale or label and the takeaway is stated, and enlarge or reflow the appendix tables on slides 27 to 31 so they are legible.
What would change the score: I would add a short closing slide restating the targets, thin the text on the segment overview slides (14, 16, 18), and replace the heavy cycle graphic repeated on slides 1 and 7 with something that carries more information.
Confidence high. 31 of 31 pages inspected on contact sheets, 4 at readable size. Reviewed 2026-11-08. Model-assisted review (claude-sonnet-5-5).
Full text of the slides (31 slides)
Every slide's words and a description of its charts and images, so the deck can be searched and rebuilt. Also available as Markdown.
Slide 1
OWENS CORNING
Q1 2026 INVESTOR
PRESENTATION
This presentation shared at the following events:
03/11/26
IR Roadshow Hosted by Deutsche Bank – Baltimore
Brian Chambers, Chair & Chief Executive Officer
03/05/26
Wolfe Research Housing Conference – New York
Todd Fister, Chief Financial Officer
03/04/26
Evercore ISI Housing and Building Products Symposium – New York
Todd Fister, Chief Financial Officer
CONSISTENT EXECUTION
SHAREHOLDER VALUE
CUSTOMER GROWTH
ICONIC BRAND
WINNING COST POSITION
UNPARALLELED COMMERCIAL STRENGTH
LEADING TECHNOLOGY
ADVANTAGE™
Visuals: Photo collage across the right 48% of the slide, all darkened with a 25% black overlay: top-left a white suburban house with porch, columns and dark windows on a lawn; top-right a stone and brick house with a dark shingle roof; middle-left a wooden-clad entry with a glass-panelled door; middle-right a worker in gloves using a green nail gun on a roof underlayment printed with a Pink Panther outline; bottom-left a white door and a worker in a plaid shirt installing pink FOAMULAR insulation board; bottom-centre a worker in plaid shirt installing pink insulation between wooden roof trusses; bottom-right close-up of pink fibreglass insulation batts. White diagonal lines divide the bottom photos in a triangular wedge. Over the collage is a large white circle with a light grey (#E6E6E6) ring, a magenta circular arrow ring with three arrowheads and curved grey/white labels around it: CONSISTENT EXECUTION on top in magenta, SHAREHOLDER VALUE on the lower left in grey, CUSTOMER GROWTH on the lower right in grey. Inside, the circle is divided by light grey diagonal lines into four quadrants, each with a black line icon above magenta condensed text: top a Pink Panther face icon with ICONIC BRAND; left a pie chart with dollar sign icon with WINNING COST POSITION; right a dumbbell icon with UNPARALLELED COMMERCIAL STRENGTH; bottom a light bulb with gear icon with LEADING TECHNOLOGY. The centre has a white circle with a red Owens Corning logo and black ADVANTAGE™ text. The left table has black 2px outlines with a narrow date column and a wider event column, 3 rows. Red Owens Corning logo with registered mark at bottom-left.
Slide 2
FORWARD-LOOKING STATEMENTS AND NON-GAAP MEASURES
This presentation and the associated remarks contain forward-looking statements. We caution you against relying on these statements as they are subject to risks, uncertainties and other factors and actual results may differ materially from those results projected in the statements. These risks, uncertainties and other factors include, without limitation: levels of residential and non-residential construction activity; demand for our products; industry and economic conditions including, but not limited to, supply chain disruptions, recessionary conditions, inflationary pressures, and interest rate and financial markets volatility; additional changes to tariff, trade or investment policies or laws by the United States, or similar actions, including reciprocal actions, by foreign governments; availability and cost of energy and raw materials; competitive and pricing factors; relationships with key customers and customer concentration in certain areas; our ability to achieve expected synergies, cost reductions and/or productivity improvements; issues related to acquisitions, divestitures and joint ventures or expansions; our ability to complete the announced divestiture of our glass reinforcements business on the expected terms and within the anticipated time period, or at all, which is dependent on the parties' ability to satisfy certain closing conditions; climate change, weather conditions and storm activity; legislation and related regulations or interpretations in the United States or elsewhere; domestic and international economic and political conditions, policies or other governmental actions, as well as war and civil disturbance; uninsured losses or major manufacturing disruptions, including those from natural disasters, catastrophes, pandemics, theft or sabotage; environmental, product-related or other legal and regulatory liabilities, proceedings or actions; research and development activities and intellectual property protection; issues involving implementation and protection of information technology systems; foreign exchange and commodity price fluctuations; our level of indebtedness; our liquidity and the availability and cost of credit; the level of fixed costs required to run our business; levels of goodwill or other indefinite-lived intangible assets; loss of key employees and labor disputes or shortages; defined benefit plan funding obligations; and factors detailed from time to time in the company’s filings with the U.S. Securities and Exchange Commission. The information in this presentation speaks as of February 25, 2026, and is subject to change. The company does not undertake any obligation to update or revise any forward-looking statements, whether as a result of new information, future events or otherwise, except as required by federal securities laws.
The term “year to date” refers to the period ended on the last calendar day of the quarter preceding the date of the investor event referenced on the first page above. Otherwise, the information in this presentation speaks as of the date of the investor event and is subject to change. The Company assumes no obligation to update or revise forward-looking statements except as required by law. Any distribution of this presentation after the investor event is not intended and should not be construed as updating or confirming such information.
This presentation contains references to certain "non-GAAP financial measures" as defined by the SEC, which may be referenced in the Appendix. Adjusted EBITDA, Adjusted EBITDA from continuing operations, free cash flow, and pro forma revenue exclude certain items that management does not allocate to its segment results because it believes they are not representative of the company’s ongoing operations. When the company provides forward-looking expectations for non-GAAP measures, the most comparable GAAP measures and reconciliations to those GAAP measures are generally not available without unreasonable effort due to the variability, complexity and limited visibility of the adjusting items that would be excluded from the non-GAAP measures in future periods. The variability in timing and amount of adjusting items could have significant and unpredictable effects on future GAAP results.
THE PINK PANTHER™ & © 1964-2026 Metro-Goldwyn-Mayer Studios Inc. All Rights Reserved. © 2026 Owens Corning. All Rights Reserved.
2
Visuals: Owens Corning logo at bottom left: a small red square with the white text 'OWENS CORNING' and a white swoosh above it, with a tiny registered mark to its right. No other visuals.
Slide 3
A FOCUSED BUILDING PRODUCTS LEADER
Reshaped with over 50% R&R exposure
2025 REVENUE
$10.1B
REVENUE BY END MARKET
34%
17%
23%
26%
Non-Discretionary Repair
Residential R&R
New Residential
Non-Residential
REVENUE BY GEOGRAPHY
8%
11%
1%
80%
Rest of World
Europe
Canada & Mexico
United States
THREE MARKET-LEADING BUSINESSES
ROOFING
$4.4B (43% of sales)
INSULATION
$3.7B (36% of sales)
DOORS
$2.1B (21% of sales)
A leading brand with
Total Protection Roofing System®
and the industry's premier
Contractor Engagement Model
in unique non-discretionary repair
market
Attractive residential and non-
residential insulation mix with
highly efficient production network
in a market with
attractive secular tailwinds
A leading door systems
business leveraging
The Owens Corning Advantage™
to deliver higher margins and
growth
Note: Data as of 2025 Form 10-K for Owens Corning. Consolidated figures eliminate intercompany net sales between reportable segments. Business mix statistics based on 2025 net sales.
Note: Non-discretionary replacement refers to Roofing shingles. Comparability may differ over time. Estimated error margin +/- 5% for revenue split.
Source: Owens Corning management estimates, Owens Corning SEC filings.
3
Visuals: Two donut charts. Revenue by End Market: segments clockwise from top: Non-Discretionary Repair 34% (dark teal #004D65), Residential R&R 17% (blue #009ACA), New Residential 23% (light blue #84E2FF), Non-Residential 26% (pale blue #C1F0FF); white percentage labels inside segments; legend at right with square markers in matching colours. Revenue by Geography: United States 80% (green #3C9748), Canada & Mexico 8% (light green #7FCB88), Europe 11% (pale green #D4EED8), Rest of World 1% (light grey); white labels; legend at right with square markers. Photos: roofing shingle roof and house with brown siding and white windows (right of Roofing column); insulation collage of four stacked images (pink foam board labelled FOAMULAR NGX, grey pipe insulation pieces, gloved hand with tan insulation batt, pink fibreglass insulation); white paneled door with glass panes, dark blue siding, pink flowers and steps (right of Doors column). Owens Corning red logo square with white 'OWENS CORNING' text at bottom-left. Thin grey divider lines and grey header boxes.
Slide 4
PROFITABILITY OUTPERFORMING OUR PEERS
ADJUSTED EBITDA¹ MARGIN² PERFORMANCE VS. PEERS
25%
20%
15%
10%
2019
2020
2021
2022
2023
2024
2025
OC
Peers
Source: S&P Capital IQ.
Peers defined as Carlisle (CSL), Fortune Brands Innovations (FBIN), and MASCO (MAS).
1. Adjusted EBITDA for our peers is determined by removing one-time or unusual items which requires management judgement and may not align to how we identify one-time or unusual items which may limit the direct comparability of adjusted EBITDA across companies.
2. Adjusted EBITDA margin for our peers is an average.
4
Visuals: Clustered column chart with 7 year categories (2019 to 2025) and two series. The y-axis runs 10% to 25% with labels at 10%, 15%, 20% and 25%. A black vertical axis line is on the left and a black horizontal baseline sits at the bottom. There are no gridlines and no data labels. Magenta bars are OC, with values of about 18%, 19%, 22%, 23%, 24%, 25% and 22% for 2019 to 2025. Blue bars are Peers, with values of about 17%, 18%, 18%, 20%, 21%, 22% and 21%. The legend at top right has a magenta square labelled OC and a blue square labelled Peers. The Owens Corning logo is at bottom left: a red square with white 'OWENS CORNING' text.
Slide 5
STRUCTURALLY IMPROVED MARGINS IN LOWER MARKETS
ADJUSTED EBITDA¹ MARGIN PERFORMANCE VS. MACROS
25%
20%
15%
10%
OC
2016
2017
2018
2019
2020
2021
2022
2023
2024
2025
Housing Starts¹
1,144
1,203
1,266
1,236
1,342
1,577
1,614
1,407
1,385
1,370
Shingle Market²
133
144
136
139
151
159
148
157
160
143
Existing Home Sales³
4,822
4,904
4,736
4,746
5,057
5,425
4,532
3,676
3,673
3,706
Housing starts, shingle market and existing home sales data presented as an index with 2016 as the base year (2016 = 100).
1. Lagged (90 days), thousands.
2. Squares, millions (excludes components shingles known in ARMA reporting as individual shingles). ARMA.
3. Single family, thousands.
5
Visuals: Combined bar and dot chart. Ten grey bars (OC adjusted EBITDA margin) for 2016-2025 on a y-axis labelled 10%, 15%, 20%, 25% (no printed bar values). Approximate bar tops: 2016 about 19%, 2017 about 19%, 2018 about 17.8%, 2019 about 17.8%, 2020 about 19%, 2021 about 22%, 2022 about 23%, 2023 about 24%, 2024 about 25%, 2025 about 22%. Overlaid dots per year: green (housing starts), yellow (shingle market), orange (existing home sales), plotted as index positions. Green dots about: 2016 hidden, 2017 about 19%, 2018 about 19.7%, 2019 about 19.2%, 2020 about 20.6%, 2021 about 24.2%, 2022 about 24.8%, 2023 about 21.7%, 2024 about 21.3%, 2025 about 21.2%. Yellow dots about: 2017 19.2%, 2018 18.1%, 2019 18.6%, 2020 20.2%, 2021 21.2%, 2022 19.7%, 2023 20.9%, 2024 21.2%, 2025 19.2%. Orange dots about: 2016 18.1%, 2017 18.2%, 2018 17.8%, 2019 17.8%, 2020 18.7%, 2021 20%, 2022 16.7%, 2023 13.8%, 2024 13.8%, 2025 13.9%. Black vertical y-axis line and black horizontal x-axis line. Legend at top right: grey square with label OC. Left of the table rows are large coloured dots: green, yellow, orange. Red Owens Corning logo (white script 'Owens Corning') at bottom left.
Slide 6
HIGHER STRUCTURAL MARGINS AND MORE RESILIENT EARNINGS
TOTAL OC ADJUSTED EBITDA MARGIN MID-20% AVERAGE
20%-27% RANGE
ROOFING
INSULATION
DOORS
30% average EBITDA margin
27%-35% EBITDA margin range
24% average EBITDA margin
20%-27% EBITDA margin range
Path to 20% EBITDA margin
13%-22% EBITDA margin range
KEY MACRO ASSUMPTIONS
135MM-160MM+
shingle market1
1.2MM-1.6MM
U.S. housing starts
Flat to +3%
discretionary R&R growth
Flat to +3% EU non-
residential construction
Note: Annual EBITDA margin ranges.
1. Shingle market excludes components shingles known in ARMA reporting as individual shingles
6
Visuals: Three photographs. Roofing: a roofer in a red long-sleeve shirt and tan work trousers kneels on a grey shingled roof and uses a nail gun, in bright sunlight with a hard shadow, cropped box. Insulation: a man in a grey cap and dark shirt pushes pink fibreglass insulation into a wooden wall frame with yellow wiring, warm tones, cropped box. Doors: a woman with a long ponytail in a light green top stands holding a dark picture frame beside a white six-panel door on white horizontal siding, bright and soft. Four thin grey horizontal rules above and below each macro assumption column. Owens Corning red logo with a white script wordmark at the bottom-left.
Slide 7
HIGH PERFORMING BUILDING PRODUCTS LEADER
STRATEGIC PRIORITIES
Strengthen
our market
leading positions
Leverage
enterprise scale
and capabilities
Extend
product offering
in existing businesses
CONSISTENT EXECUTION
CUSTOMER GROWTH
SHAREHOLDER VALUE
ICONIC BRAND
WINNING COST POSITION
OWENS CORNING ADVANTAGE™
UNPARALLELED COMMERCIAL STRENGTH
LEADING TECHNOLOGY
FINANCIAL TARGETS TO
OUTPERFORM THE MARKET
$12.5B
revenue
by 2028
Mid-20%
adjusted EBITDA
margin sustained
$5B+
2025-2028
cumulative
FCF
Mid-teens+
return on
capital
$2B
returned to
shareholders
2025-2026
7
Visuals: Central circular diagram: a thick light grey ring (about 36% wide, 64% tall) divided by a white X into four quadrants (top, right, bottom, left). Each quadrant has a black line icon with a magenta label: top, a panther face (Iconic Brand); left, a pie chart with a dollar sign (Winning Cost Position); right, a dumbbell in a square (Unparalleled Commercial Strength); bottom, a lightbulb with a gear (Leading Technology). A white circle in the centre with a light grey outline holds the red Owens Corning logo square and the word ADVANTAGE™. Around the ring are three magenta curved arrows with curved magenta uppercase labels: CONSISTENT EXECUTION on top, CUSTOMER GROWTH on the right (rotated along the ring) and SHAREHOLDER VALUE on the left (grey text). Arrowheads point clockwise. Magenta horizontal rules run under STRATEGIC PRIORITIES (left, to the ring) and under the FINANCIAL TARGETS heading (from the ring to the right edge). Light grey horizontal dividers sit between the left priority blocks and under the last one. The right grid has a light grey vertical divider and horizontal dividers. The red Owens Corning logo square is at bottom-left.
Slide 8
CONSISTENTLY EXECUTING THE OC ADVANTAGE™
IMPROVING MARKET POSITION & CUSTOMER MIX
✓ Contractor engagement model
✓ Pink Advantage Dealer Program
✓ Leading brand creates pull-through opportunities
IMPROVING PRODUCT MIX
✓ Conversion of strips to lams
✓ Growing the Roofing components business
✓ Emphasizing growth in non-residential applications like data centers
INVESTING IN GROWTH
✓ KC fiberglass line to support growth in non-residential and residential
✓ Prattville shingle plant to service largest asphalt shingle region in the U.S.
✓ Russellville plant supports rising commercial market growth
CONTINUOUS OPERATIONAL EFFICIENCY
✓ Doors network optimization; closed 5 facilities
✓ Leverage advanced analytics and AI to drive efficiency
✓ Factory modernization initiative improving cost position
✓ Driving opex leverage through enterprise scale
Organic growth
Higher, more resilient earnings
Lower long-term capital intensity
Robust free cash flow
8
Visuals: Four magenta (#D30F7D) step-shaped header panels with rounded top-left corners and slanted bottom edges, stepping up in height from left to right. White panels with thin grey vertical divider lines hold the bullet lists. A dashed black bracket opens to the left, from the top of the fourth column down to the bottom, ending in a black filled circle with a white right-pointing arrow. Four white rectangles with magenta outlines on the right. Owens Corning red logo square with white text at bottom-left.
Slide 9
CONSISTENT AND DISCIPLINED EXECUTION OF OUR STRATEGY
REVENUE ($B)
ADJUSTED EBITDA MARGIN (%)
Enterprise revenue
CAGR of ~4%
Sustainable 20%+
EBITDA margins
$6.4
$8.5
$9.8
$9.7
$10.6
$10.1
18%
22%
23%
24%
25%
22%
2015-
2020
Average
2021
2022
2023
2024
Proforma
2025
2015-
2020
Average
2021
2022
2023
2024
2025
Note: Compounded annual growth rate (“CAGR”) calculated 2021 to 2025 as reported
Note: 2024 pro forma revenue for re-segmentation, full year of Doors, excludes glass reinforcements and building products in China and Korea
Source: Owens Corning SEC filings; please refer to Appendix C for reconciliation to Owens Corning SEC filings
9
Visuals: Two bar charts of six columns each with value labels above the bars and category labels beneath a thin black baseline. Left chart, Revenue ($B): 2015-2020 Average $6.4, 2021 $8.5, 2022 $9.8, 2023 $9.7, 2024 Proforma $10.6, 2025 $10.1. Right chart, Adjusted EBITDA margin (%): 2015-2020 Average 18%, 2021 22%, 2022 23%, 2023 24%, 2024 25%, 2025 22%. All bars are light grey except the 2025 bar in each chart, which is magenta. No axes, gridlines or legend. Grey horizontal rules run above and below the panel headers, and a thin dotted vertical line divides the panels. Owens Corning logo: a red square with white 'OWENS CORNING' text, at bottom-left.
Slide 10
SIGNIFICANT ANNUAL CASH FLOW GENERATION
OPERATING CASH FLOW ($B)
FREE CASH FLOW ($B)
Enterprise operating cash flow
CAGR of ~4%
Significant annual
FCF generation
$0.9
$1.5
$1.8
$1.7
$1.9
$1.8
2015-
2020
Average
2021
2022
2023
2024
2025
$0.5
$1.1
$1.3
$1.2
$1.2
$1.0
2015-
2020
Average
2021
2022
2023
2024
2025
Note: Compounded annual growth rate (“CAGR”) calculated 2021 to 2025 as reported
Source: Owens Corning SEC filings; please refer to Appendix C for reconciliation to Owens Corning SEC filings
10
Visuals: Two side-by-side vertical bar charts with no y-axis, no gridlines and no legend, each on a thin black baseline. Left chart, Operating Cash Flow ($B), has six bars with value labels above them: 2015-2020 Average $0.9, 2021 $1.5, 2022 $1.8, 2023 $1.7, 2024 $1.9, 2025 $1.8. The first five bars are light grey and the 2025 bar is magenta. Right chart, Free Cash Flow ($B), has six bars: 2015-2020 Average $0.5, 2021 $1.1, 2022 $1.3, 2023 $1.2, 2024 $1.2, 2025 $1.0. The first five bars are light grey and the 2025 bar is magenta. Light grey horizontal rules run above and below the column headers across the full panel width. A thin dotted vertical divider runs between the two charts. The Owens Corning logo, a small red square with white 'OWENS CORNING' text, sits at bottom-left.
Slide 11
DELIVERING SIGNIFICANT SHAREHOLDER RETURNS
DISCIPLINED CAPITAL ALLOCATION STRATEGY
FREE CASH FLOW ALLOCATION
Maintain investment grade balance sheet targeting 2-3x net debt to adjusted EBITDA leverage
Return free cash flow to shareholders through dividends and repurchases
Invest to strengthen our market leading positions
Invest to extend product offering in existing businesses
2015 – 2020
2021
2022
2023
2024
2025
Share Repurchases
Dividend
Other
50% FCF to shareholders target over time
$2B return to shareholders 2025-2026
$4.6B cash returned to shareholders since 2019
More than TRIPLED quarterly dividend since 2019
31% of outstanding shares repurchased 2019-2025
11
Visuals: Stacked column chart 'Free cash flow allocation' with six columns, categories 2015–2020, 2021, 2022, 2023, 2024, 2025, no y-axis or value labels, black baseline. Each column stacks Share Repurchases (blue #009ACA) at bottom, Dividend (green #3C9748) in the middle, Other (light grey #D0CECE) on top, all columns equal total height. Approximate segment proportions: 2015–2020 blue about 33%, green about 16%, grey about 51%; 2021 blue about 57%, green about 12%, grey about 31%; 2022 blue about 61%, green about 10%, grey about 29%; 2023 blue about 56%, green about 16%, grey about 28%; 2024 blue about 38%, green about 17%, grey about 45%; 2025 blue about 80%, green about 20%, no grey. A horizontal dashed magenta line at about the 50% level spans all columns, ending in a black left-pointing triangle arrowhead next to the annotation '50% FCF to shareholders target over time', followed by a thin black rule and '$2B return to shareholders 2025-2026'. Legend below the chart with square swatches: blue Share Repurchases, green Dividend, grey Other. Owens Corning red logo with white 'OWENS CORNING' wordmark at bottom-left. Thin grey divider lines between left-panel statements and thin magenta full-width rule.
Slide 12
INVESTING TO STRENGTHEN AND EXTEND OC’S LEADERSHIP
2025-2027
Investments in growth
and modernization
5%
Capex as
% of sales
2024
Reshaping the
company
2028
Operating a more
modernized network
4%
Capex as
% of sales
12
Visuals: A thick black S-shaped curve rises from lower left (near the 5% label) to a peak, then falls and flattens out to the right, ending in a black arrowhead pointing right toward the 4% label. Three small white circles with black outlines mark points on the curve: one on the rise (2024), one at the peak (2025-2027), one on the descent (2028). Thin black dashed vertical lines drop from or rise to each circle toward its label. Two thin grey horizontal rules frame the diagram. Four photos in a row: (1) people in hard hats and orange hi-vis vests with shovels breaking ground in front of a 'HÄLLEKIS PLANT DECARBONIZATION' sign, cloudy sky, dirt mound in foreground; (2) aerial view of a long white-roofed industrial building with a green landscape and a road behind; (3) a worker in a grey uniform, cap, safety glasses and blue face mask giving a thumbs-up with a green glove, with yellow industrial railings and machinery blurred behind; (4) interior of a factory with a conveyor line carrying pink insulation material, yellow safety rails and machinery. Owens Corning red logo with white script text at bottom left.
Slide 13
LEADING TECHNOLOGY & SUSTAINABILITY POSITION
PRODUCT AND PROCESS INNOVATION
DIGITAL TOOLS TO HELP OUR / CUSTOMERS WIN AND GROW
SUSTAINABILITY IMPACT
BUILDING BETTER TOGETHER 2024 SUSTAINABILITY REPORT
Customer-inspired product innovation
~120 new or improved products / launched in last 3 years
Maintained 20%+ Product Vitality Index / in 2025
Productivity driven process innovation
Contractor selling tools
VR technology for contractor training
Digital customer portal
Self-guided online customer / learning modules
Increase the positive impact of our / products
Reduce the negative impact of our / operations
Eliminate injuries and improve the / quality of life of our employees and their / families
Have a positive impact on our / communities
13
Visuals: Three photo strips under the headers. Left: close-up of a handheld thermal imaging camera (TG165-X, showing 447°F with a rainbow heat map) held against industrial piping, blurred background, blue and orange tones, cropped box. Middle: a man in a pink shirt wearing a VR headset in a warehouse stacked with pink insulation bags, with a glowing teal AR overlay, and a monitor image in the lower left showing a web page with a brick house with trees. Right: black banner reading BUILDING BETTER TOGETHER in white and magenta with 2024 SUSTAINABILITY REPORT in white spaced capitals, faint figures in pink at the top corners. Owens Corning logo: red square with white script text.
Slide 14
ROOFING SEGMENT OVERVIEW
SHINGLES
COMPONENTS
ASPHALT
NONWOVENS
MARKET-LEADING POSITION IN AN ATTRACTIVE MARKET; non-
discretionary repair demand with shift to higher value roofing
systems
ROOFING COMPONENTS OFFER ATTRACTIVE GROWTH OPPORTUNITIES
with margins similar to shingles
CREATING AND CAPTURING VALUE THROUGH CONTRACTOR ENGAGEMENT
helping our customers and contractors win through our
unique advantages
INVESTING IN OUR WINNING COST AND SERVICE POSITION; enhancing
our manufacturing network, capabilities, and supply security
SUSTAINING THE FINANCIAL PERFORMANCE OF THE BUSINESS
Raising long-term EBITDA margin to 30% on average
FINANCIAL PERFORMANCE
Revenue ($b)
EBITDA margin (%)
$4.5
$3.0
$1.5
$0.0
35%
30%
25%
20%
15%
10%
5%
0%
$3.2
$3.7
$4.0
$4.6
$4.4
2021
2022
2023
2024
2025
REVENUE BY PRODUCT
REVENUE BY GEOGRAPHY
Components
Shingles
Europe Canada & Mexico
U.S.
Note: 2024 revenue figures pro forma for resegmentation. Roofing includes nonwovens and lumber, included in Components.
Note: Comparability may differ over time. Revenue before inter-segment eliminations; estimated error margin +/- 5% for revenue split.
Source: Owens Corning management estimates, Owens Corning SEC filings.
Business mix statistics based on 2025 net sales.
14
Visuals: Four photo tiles, each with a magenta label bar on top: SHINGLES (close-up of dark brown/grey asphalt shingles), COMPONENTS (a roofer in tan work pants and boots walking on a dark grey roof underlayment), ASPHALT (industrial refinery tanks and pipes, blue sky), NONWOVENS (white/grey nonwoven fabric roll, soft light). Combo chart: blue bars of revenue ($b) for 2021 to 2025 with values $3.2, $3.7, $4.0, $4.6, $4.4 printed in white inside the bars; left axis $0.0 to $4.5 in $1.5 steps; magenta line for EBITDA margin on right axis 0% to 35% in 5% steps, about 20% in 2021, about 19% in 2022, about 26% in 2023, about 30% in 2024, about 28% in 2025; legend with blue square for Revenue ($b) and magenta line for EBITDA margin (%). Donut chart Revenue by Product: Shingles about 70% dark burgundy #7D0049, Components about 30% magenta #D40F7D, white thin separators. Donut chart Revenue by Geography: U.S. about 90% dark green #1E4B24, Europe about 5% mid green, Canada & Mexico about 2% light green, with labels outside. Red Owens Corning logo at bottom left. Thin grey divider lines between statements, a horizontal rule under the chart, and a vertical rule between donuts.
Slide 15
MARKET-LEADING POSITION IN AN ATTRACTIVE ROOFING MARKET
SIGNIFICANT OC SHINGLE VOLUME COMES THROUGH OCCN
U.S. ASPHALT SHINGLE MARKET
(MM, SQUARES)1
LAMINATE SHINGLES VS. STRIP SHINGLES
(%)1
Duration® Mix
OCCN Members
>30,000 CONTRACTORS
‘15 ‘16 ‘17 ‘18 ‘19 ‘20 ‘21 ‘22 ‘23 ‘24 ‘25
New Construction
Weather
Repair
136
159
148
157
160
143
40
41
41
55
54
41
75
90
81
78
81
79
21
28
26
24
25
23
2015-2020 AVG.
2021
2022
2023
2024
2025
Laminates
Strips
2015-2020 AVG.
2021
2022
2023
2024
2025
17%
CAGR in contractor additions to the network from 2015 to 2025
80%+
of Roofing demand fueled by non-discretionary demand driven by replacement and weather
95%
of Roofing demand is now laminate shingles, reinforcing the foundation for higher value roofing systems
1. ARMA, OC Management Estimates. U.S. asphalt shingle market excludes components shingles (e.g., Hip & Ridge, Starter Strip) known in ARMA reporting as individual shingles. Refer to Appendix A for more details.
15
Visuals: Left: bar chart of OCCN members, 11 grey vertical bars rising from '15 to '25, with a magenta line with markers (Duration Mix) rising from about 20% to about 60% of height, overlaid; legend at top left with a magenta line-with-dot and a grey square; callout '>30,000 CONTRACTORS' in magenta above the last bar; no gridlines, thin grey baseline. Middle: stacked column chart of U.S. asphalt shingle market in MM squares, 6 columns (2015-2020 AVG., 2021-2025), stacked grey (new construction) at the bottom, blue (repair) in the middle, green (weather) on top. Totals: 136, 159, 148, 157, 160, 143 (2025 in bold magenta). Segments, grey/blue/green: avg 21/75/40; 2021 28/90/41; 2022 26/81/41; 2023 24/78/55; 2024 25/81/54; 2025 23/79/41. Legend at top with grey, green and blue squares. Black baseline. Right: 100% stacked columns, 6 columns, green laminates at the bottom with a white diagonal axis-break slash and grey strips on top. Grey share about 38% for the avg, about 28% for 2021, about 20% for 2022-2023, about 15% for 2024-2025 (estimates). Legend with a green square for Laminates and a grey square for Strips. Owens Corning pink/red logo square at bottom left.
Slide 16
INSULATION SEGMENT OVERVIEW
FINANCIAL PERFORMANCE
Revenue ($b)
EBITDA margin (%)
N.A. RESIDENTIAL
N.A. NON-RESIDENTIAL
EUROPE
$4.0
$3.0
$2.0
$1.0
$0.0
25%
20%
15%
10%
5%
0%
$3.2
$3.7
$3.7
$3.9
$3.7
2021
2022
2023
2024
2025
INDUSTRY-LEADING BUSINESS IN ATTRACTIVE, GROWING MARKETS
Energy efficiency and product attributes drive
strong demand
MULTIPLE PATHS TO WIN WITH OUR CUSTOMERS
Iconic brand, broad product offering, and innovation
ADVANTAGED ASSET BASE DRIVES WINNING COST POSITION
Cost effective, flexible network enhanced through process
technology
TRANSFORMED FOR HIGHER AND CONSISTENT EARNINGS
Raising long-term EBITDA margin to 24% on average
REVENUE BY PRODUCT¹
REVENUE BY GEOGRAPHY¹
Europe
NA
Non-Residential
NA
Residential
Canada &
Mexico
Europe
U.S.
Note: 2024 revenue figures pro forma for resegmentation. Insulation includes WUCS and excludes Building Products China and Korea.
Note: Comparability may differ over time. Revenue before inter-segment eliminations; estimated error margin +/- 5% for revenue split.
Source: Owens Corning management estimates, Owens Corning SEC filings.
1. Business mix statistics based on 2025 net sales and excludes Building Products China and Korea. Rest of world (not shown), accounts for <1% of revenue.
16
Visuals: Combo chart 'Financial Performance': blue columns for Revenue ($b) 2021 $3.2, 2022 $3.7, 2023 $3.7, 2024 $3.9, 2025 $3.7, with white value labels inside bars. Left axis $0.0 to $4.0 in $1.0 steps, right axis 0% to 25% in 5% steps. Magenta line for EBITDA margin (%) with no labels, about 20% in 2021 rising to about 22% in 2022, about 22% in 2023, about 24% in 2024, about 23% in 2025. Legend above: blue square 'Revenue ($b)' and magenta line 'EBITDA margin (%)'. Thin grey baseline. Three photos beneath magenta tabs: N.A. Residential, a family of three adults and a child standing in an unfinished room with pink insulation in the walls and a ladder; N.A. Non-Residential, a modern glass-and-steel building with a slanted canopy and bare trees; Europe, an aerial view of a rooftop green terrace with plants and buildings. Donut 'Revenue by Product': about 40% NA Residential (dark plum #7D0049), about 40% NA Non-Residential (magenta #D30F7D), about 20% Europe (light pink #FFBAE2). Donut 'Revenue by Geography': about 68% U.S. (dark green #1E4B24), about 20% Europe (mid green #3C9748), about 12% Canada & Mexico (light green #7FCC89). Owens Corning logo, a red square with white 'OWENS CORNING' script, at bottom left. Thin grey divider rules between text blocks, a horizontal rule above donuts and a vertical rule between donuts.
Slide 17
ATTRACTIVE LONG-TERM SECULAR TRENDS IN INSULATION
NORTH AMERICA RESIDENTIAL
Codes drive more
insulation in homes
NORTH AMERICA NON-RESIDENTIAL
Diverse portfolio in
growth markets
EUROPE
Energy efficiency changing
construction practices
~30%
more lbs. per home
in last 10 to 15 years¹
39%
of commercial building spend
is on repair and remodel³
>25%
of building stock to be renovated
over the next decade to meet
European Green Deal requirements⁴
2-4MM
underbuilt housing
units in the U.S.²
GROWING
DEMAND
for onshoring, mission
critical facilities, and
other highly engineered
applications
3X GROWTH
functional roofs
growing faster than
commercial market
1. Home Innovation Research Labs (HIRL), 2009-2021.
2. Freddie Mac, 2024. Management estimates.
3. Principia January 2025, Ducker study 2022, Freedonia 2022.
4. European Council, Council of the European Union.
17
Visuals: Three photographs side by side, each 30.8% wide and 27.2% tall, at y 18.7%. 1) Left: interior of a house under construction with pink fiberglass batt insulation between wooden studs and rafters. A man in a cap and dark polo, a man holding a baby or toddler, and a woman in a light blue shirt and jeans stand looking up. A stepladder and loose pink insulation rolls are at the left. Warm light, pink and brown tones. 2) Middle: low-angle view of a modern commercial building with a large overhanging solar panel canopy roof and tall glass windows with vertical white fins. Bare tree branches are in the foreground, a blue sky behind, and part of a brick building at right. Cool blue and white tones. 3) Right: aerial drone view of a rooftop terrace garden with a maze-like pattern of green planting beds, grey paving tiles and white walls, with a few people gathered at the top. Green and grey tones. Under the photos are three light grey rectangles (#E6E6E6) holding the column headings. Two thin grey vertical divider lines run in the lower stat area, at about x 34.6% and x 65.4%. The Owens Corning logo, a small red square with white 'OWENS CORNING' script, is at bottom left.
Slide 18
DOORS SEGMENT OVERVIEW
A DIFFERENTIATED MANUFACTURER OF INNOVATIVE DOORS AND DOOR SYSTEMS in attractive categories
DRIVING A WINNING COST POSITION by exceeding $125 million of original enterprise synergies and identifying $75 million additional; total structural improvement of 500bps
VERTICALLY INTEGRATED across components, panels, and systems enables network flexibility
CREATING VALUE FOR CUSTOMERS THROUGH QUALITY, SERVICE, AND BRAND to drive growth in every channel
STRUCTURALLY IMPROVING the business with a path to 20% EBITDA margins leveraging The OC Advantage™, and positioning to outperform the market
RESIDENTIAL INTERIOR
RESIDENTIAL EXTERIOR
LUXURY EXTERIOR
COMPONENTS
REVENUE BY PRODUCT
REVENUE BY GEOGRAPHY
Components
Interior
Exterior
Canada & Mexico
Europe
U.S.
Source: Owens Corning management estimates, Owens Corning SEC filings; Business mix statistics based on 2025 net sales; estimated error margin +/- 5% for revenue split.
Note: Rest of world (not shown), accounts for <1% of revenue.
18
Visuals: Four magenta (#D40F7D) header tiles with white labels, each over a product image: a teal-grey interior panel door in a bathroom with a wooden vanity; a white multi-pane exterior door with a dark navy wall and pink flowers; a luxury modern house with a wood-beamed overhanging roof, forested hillside and glass walls; a product render of a door component frame on white. Donut chart 'Revenue by Product' with segments: Interior about 50% dark maroon #7D0049, Exterior about 38% magenta #D40F7D, Components about 12% light pink #FFBAE2; white separators, labels outside. Donut chart 'Revenue by Geography' with segments: U.S. about 80% dark green #1E4B24, Europe about 10% mid green #3C9748, Canada & Mexico about 10% pale green #D4EED8; labels outside. Thin vertical grey divider between the charts. Thin grey horizontal dividers between left statements. Owens Corning red logo with white text at bottom-left.
Slide 19
ACCELERATING DOORS GROWTH THROUGH A UNIQUE GO-TO-MARKET STRATEGY
HOME CENTERS
Prehung
systems
WHOLESALE
Slabs/
Components
WINNING DIFFERENTIATORS
• Brand matters: OC a top retail partner
• Dedicated account teams, integrated
across categories
• Win with unparalleled commercial strength:
service levels and product innovation
REVENUE SYNERGIES
AND PRODUCT
INNOVATION TO
ENHANCE ORGANIC
GROWTH
DOWNSTREAM DEMAND CREATION
• Independent dealer and homebuilder
loyalty programs
• Incentivizes indirect customers to leverage
complete OC portfolio
• Creates pull-through product demand
in distribution
IMPROVING SERVICE
LEVELS AND CREATING
PULL-THROUGH
DEMAND
19
Visuals: Left top: black line-art illustration of a paneled door with a handle and frame, inside a magenta-outlined box. Left bottom: six black line-art icons in a grid: a door lock plate, a window-style panel, two stacked horizontal slabs, a tall narrow door slab, a door slab with a small knob, and a lever door handle with keyhole. Top grey panel: red Owens Corning logo (red square with white swoosh and the words OWENS CORNING). Bottom grey panel: Pink Advantage Dealer Program logo (pink PINK, black ADVANTAGE, with Pink Panther in a black bordered frame) above a High Performance PINK Certified Home logo with the Pink Panther figure and a small red Owens Corning mark. Thin grey vertical divider lines in each panel. Small red Owens Corning logo at bottom-left.
Slide 20
BUILDING A WINNING COST POSITION IN DOORS
ADDITIONAL $75MM IN COST SYNERGIES1
COST IMPROVEMENT PRIORITIES
Network Optimization
Automation
Other Efficiency
Total
75
Identified additional $75 million of synergies above the original $125 million enterprise commitment
Maintain focus on building a customer centric service organization with market leading quality
Streamline footprint, delivering benefit from network optimization
Driving efficiencies through automation in door assembly and fiberglass skin pressing
Delivering efficiency through operational excellence and TPM
1. Management estimates. Estimate 10% of savings allocated to the Enterprise P&L and 90% of savings allocated to the Doors P&L.
20
Visuals: Horizontal waterfall chart with no value axis. A thin black vertical axis line sits at x about 17.3%, running from y about 29% to 80%. Category labels on the left, right-aligned to the axis: Network Optimization, Automation, Other Efficiency, Total. Three grey (#959595) floating bars step down from upper left to lower right. Network Optimization is a short bar from the axis to about 25% x. Automation runs from about 25% to 36.7% x. Other Efficiency runs from about 36.7% to 47% x. Thin dashed vertical connector lines join the end of each bar to the start of the next, and the last one runs down to the Total bar. The Total bar is magenta (#D30F7D), runs from the axis to about 47% x, and has the bold label '75' just to its right. Bar values are not printed, except the total of 75. Panels have thin light grey outlines. The red Owens Corning logo (a red square with a white swoosh and the text OWENS CORNING) sits at the bottom left.
Slide 21
APPENDIX A:
U.S. ROOFING MARKET
Slide 22
APPENDIX A: U.S. ROOFING MARKET
U.S. ASPHALT SHINGLE MARKET
(MM, SQUARES)1
New Construction
Weather
Repair
136
159
148
157
160
143
40
41
41
55
54
41
75
90
81
78
81
79
21
28
26
24
25
23
2015-2020 AVG.
2021
2022
2023
2024
2025
Year
New Construction
Repair
Weather
2025
16%
55%
29%
2024
16%
50%
34%
2023
15%
50%
35%
2022
17%
55%
28%
2021
18%
56%
26%
2015-2020 Avg.
16%
55%
29%
U.S. ASPHALT SHINGLE MARKET WITH COMPONENTS
(MM, SQUARES)2
New Construction
Weather
Repair
Components Shingles
143
169
158
169
172
154
8
10
10
12
13
11
40
41
41
55
54
41
75
90
81
78
81
79
21
28
26
24
25
23
2015-2020 AVG.
2021
2022
2023
2024
2025
Year
New Construction
Repair
Weather
Components Shingles
2025
15%
51%
27%
7%
2024
15%
47%
31%
7%
2023
14%
46%
33%
7%
2022
17%
51%
26%
6%
2021
17%
53%
24%
6%
2015-2020 Avg.
15%
52%
28%
5%
1. ARMA, OC Management Estimates. U.S. asphalt shingle market excludes components shingles (e.g., Hip & Ridge, Starter Strip) known in ARMA reporting as individual shingles.
2. ARMA, OC Management Estimates. U.S. asphalt shingle market includes components shingles (e.g., Hip & Ridge, Starter Strip) known in ARMA reporting as individual shingles.
22
Visuals: Two stacked column charts, six columns each (2015-2020 AVG., 2021-2025), values in MM squares, no y-axis, a thin black baseline. Segments from bottom: New Construction gray, Repair blue, Weather green, and in the right chart Components Shingles yellow. Left chart totals: 136, 159, 148, 157, 160, 143. Left chart segments by column, bottom to top: New Construction 21, 28, 26, 24, 25, 23; Repair 75, 90, 81, 78, 81, 79; Weather 40, 41, 41, 55, 54, 41. Right chart totals: 143, 169, 158, 169, 172, 154. Right chart segments: New Construction 21, 28, 26, 24, 25, 23; Repair 75, 90, 81, 78, 81, 79; Weather 40, 41, 41, 55, 54, 41; Components 8, 10, 10, 12, 13, 11. The 2025 totals (143 left, 154 right) are bold magenta. Legends have small square markers: gray New Construction, green Weather, blue Repair, yellow Components Shingles. Two data tables below with no gridlines: left has columns Year, New Construction, Repair, Weather; right adds Components Shingles. Owens Corning logo, a red square with white script, at bottom left.
Slide 23
APPENDIX B:
ADDITIONAL FINANCIAL
INFORMATION
Slide 24
APPENDIX B: KEY FINANCIAL DATA – BUSINESSES
Owens Corning*
Roofing
Insulation
Doors
($ in millions)
Q4 2025
Q4 2024
Q4 2025
Q4 2024
Q4 2025
Q4 2024
Q4 2025
Q4 2024
Net sales
2,142
2,574
774
1,059
916
987
486
564
EBITDA*
362
570
199
338
186
228
33
82
EBITDA* as % of net sales
17%
22%
26%
32%
20%
23%
7%
15%
Owens Corning*
Roofing
Insulation
Doors
($ in millions)
2025
2024
2025
2024
2025
2024
2025
2024
Net sales
10,103
9,851
4,437
4,630
3,700
3,926
2,125
1,448
EBITDA*
2,268
2,468
1,411
1,532
848
945
232
232
EBITDA* as % of net sales
22%
25%
32%
33%
23%
24%
11%
16%
Source: Owens Corning SEC filings for continuing operations; reportable segment totals are shown in SEC filings before intercompany eliminations. Doors segment added on May 15, 2024 as a result of the acquisition of Masonite. Doors 2024 reflects the period
May 15, 2024 through December 31,, 2024
*EBITDA for Owens Corning reflects Adjusted EBITDA; please refer to Appendix C for reconciliation to Owens Corning SEC filings
24
Visuals: Two tables, each with 9 columns (label column plus four paired groups) and 5 rows: a group header row (Owens Corning*, Roofing, Insulation, Doors), a column header row, and three data rows. Header rows are dark grey with white text. Data rows alternate light grey (Net sales, EBITDA* as % of net sales) and white (EBITDA*). Thin dark vertical dividers separate the label column and each group. Upper table, quarterly: Net sales 2,142/2,574, 774/1,059, 916/987, 486/564; EBITDA* 362/570, 199/338, 186/228, 33/82; EBITDA* as % of net sales 17%/22%, 26%/32%, 20%/23%, 7%/15%. Lower table, full-year 2025/2024: Net sales 10,103/9,851, 4,437/4,630, 3,700/3,926, 2,125/1,448; EBITDA* 2,268/2,468, 1,411/1,532, 848/945, 232/232; EBITDA* as % of net sales 22%/25%, 32%/33%, 23%/24%, 11%/16%. Owens Corning logo (red square with white 'OWENS CORNING' text) at bottom left.
Slide 25
APPENDIX B: KEY FINANCIAL DATA – DISAGGREGATED REVENUE
Three Months Ended December 31, 2025
($ in millions)
Disaggregation Categories
Roofing
Insulation
Doors
Eliminations
Consolidated
North America Residential
$ 625
$ 381
$ 427
$ (32)
$ 1,401
North America Non-Residential
101
343
-
(2)
442
Total North America
726
724
427
(34)
1,843
Europe
47
189
55
-
291
Asia-Pacific
1
-
-
-
1
Rest of world
-
3
4
-
7
NET SALES
$ 774
$ 916
$ 486
$ (34)
$ 2,142
Twelve Months Ended December 31, 2025
($ in millions)
Disaggregation Categories
Roofing
Insulation
Doors
Eliminations
Consolidated
North America Residential
$ 3,791
$ 1,483
$ 1,877
$ (146)
$ 7,005
North America Non-Residential
437
1,420
-
(9)
1,848
Total North America
4,228
2,903
1,877
(155)
8,853
Europe
200
728
228
(4)
1,152
Asia-Pacific
9
56
3
-
68
Rest of world
-
13
17
-
30
NET SALES
$ 4,437
$ 3,700
$ 2,125
$ (159)
$ 10,103
Source: Owens Corning management estimates, Owens Corning SEC filings; estimated error margin +/- 5% for revenue split.
25
Visuals: Two data tables. Each has a dark grey (#515151) header: a blank top-left cell and a merged cell reading the period title and '($ in millions)' centred. Below is a column header row: Disaggregation Categories, Roofing, Insulation, Doors, Eliminations, Consolidated. Seven body rows with alternating light grey (#D9D9D9) and white bands: North America Residential (grey), North America Non-Residential (white), Total North America (grey, label indented), Europe (white), Asia-Pacific (grey), Rest of world (white), NET SALES (white, bold). Dollar signs sit left-aligned in the first and last rows of each column and numbers are right-aligned. Thin black rules sit under North America Non-Residential and above and below NET SALES. A thick black bar sits below each table (about y 52% and y 92.5%). Three-month values: NA Residential 625/381/427/(32)/1,401; NA Non-Res 101/343/-/(2)/442; Total NA 726/724/427/(34)/1,843; Europe 47/189/55/-/291; Asia-Pacific 1/-/-/-/1; Rest of world -/3/4/-/7; NET SALES 774/916/486/(34)/2,142. Twelve-month values: 3,791/1,483/1,877/(146)/7,005; 437/1,420/-/(9)/1,848; 4,228/2,903/1,877/(155)/8,853; 200/728/228/(4)/1,152; 9/56/3/-/68; -/13/17/-/30; 4,437/3,700/2,125/(159)/10,103. Owens Corning logo at bottom left: small red square with white 'OWENS CORNING' wordmark.
Slide 26
APPENDIX C:
NON-GAAP
RECONCILIATIONS
Slide 27
APPENDIX C: NON-GAAP RECONCILIATION – TABLE 1
The adjusting (expense) income items to EBITDA are shown in the table below (in millions):
Twelve Months Ended December 31,
Three Months Ended December 31,
Twelve Months Ended December 31,
2015 2016 2017 2018 2019 2020 2021 2022 2023 2024 2025 2024 2025
Restructuring costs (b)
Gains on sale of certain precious metals
Gain on sale of Shanghai, China facility
Gain on sale of land in India
Acquisition and divestiture-related costs
Acquisition-related transaction costs
Acquisition-related integration costs excluding amortization
Recognition of acquisition inventory fair value step-up
Litigation settlement gain, net of legal fees
Pension settlement losses
Loss on sale of business
Environmental liability charges
Loss on sale of Chambery, France assets held for sale
Gain on remeasurement of Fiberteq equity investment
Gain on sale of Santa Clara, California site
Paroc marine recall
Loss on sale of Russian operations
Strategic review-related charges
Impairment of venture investments
Goodwill impairment charges
Intangible assets impairment charges
Total adjusting items (a)
(a) Please refer to each year's respective Form 10-K filing in the "Adjusted Earnings Before Interest and Taxes" section of Management's Discussion and Analysis for additional information on these items. For the twelve months ended months ended December 31, 2024 and December 31, 2025, please refer to our Form 10-K filing for the fourth quarter of 2025 in the "Adjusted Earnings Before Interest, Taxes, Depreciation and Amortization ("Adjusted EBITDA") From Continuing Operations" section of Management's Discussion and Analysis for additional information on these adjusting items.
(b) For fiscal year 2015 to 2023, accelerated depreciation and amortization is included in restructuring. For the twelve months ended months ended December 31, 2024 and December 31, 2025, accelerated depreciation and amortization has been excluded from restructuring.
27
Visuals: A reconciliation table embedded as an image: dark gray header row with white bold text, spanning headers 'Twelve Months Ended December 31,' (2015–2023 columns), 'Three Months Ended December 31,' (2024, 2025) and 'Twelve Months Ended December 31,' (2024, 2025). 13 numeric columns. 21 data rows with alternating light gray and white banding, em dashes for zero values, parenthesized negatives. Row values include Restructuring costs: $(2), (28), (48), (22), (28), (41), (34), (48), (169), (29), (8), (73), (27). The final row 'Total adjusting items (a)' is bordered by thick black lines above and below: $(2), (47), (118), (40), (75), (1,002), 33, (39), (138), (184), (405), (404), (1,214). Small red Owens Corning logo with white text at bottom left.
Slide 28
APPENDIX C: NON-GAAP RECONCILIATION – TABLE 2
The reconciliation from net earnings (loss) attributable to Owens Corning to EBIT/EBITDA and Adjusted EBIT/EBITDA is shown in the table below (in millions):
Average 2015 to 2020
2015 | 2016 | 2017 | 2018 | 2019 | 2020 | 2021 | 2022 | 2023
Net earnings (loss) attributable to Owens Corning | $ 330 | $ 393 | $ 289 | $ 545 | $ 405 | $ (383) | n/a | $ 995 | $1,241 | $1,196
Net earnings (loss) attributable to non-redeemable and redeemable noncontrolling interests | 4 | 6 | 1 | 2 | — | (2) | n/a | — | — | (3)
Net earnings (loss) | 334 | 399 | 290 | 547 | 405 | (385) | n/a | 995 | 1,241 | 1,193
Equity in net earnings (loss) of affiliates | 1 | (3) | — | (1) | 1 | — | n/a | 1 | — | 3
Income tax expense | 120 | 188 | 269 | 156 | 186 | 129 | n/a | 319 | 373 | 401
Earnings (loss) before taxes | 453 | 590 | 559 | 704 | 590 | (256) | n/a | 1,313 | 1,614 | 1,591
Interest expense, net | 100 | 108 | 107 | 117 | 131 | 132 | n/a | 126 | 109 | 76
Loss on debt extinguishment | (5) | 1 | 71 | — | 32 | — | n/a | 9 | — | —
Earnings (loss) before interest and taxes | 548 | 699 | 737 | 821 | 753 | (124) | n/a | 1,448 | 1,723 | 1,667
Less: Adjusting items (a) | (2) | (47) | (118) | (40) | (75) | (1,002) | n/a | 33 | (39) | (138)
Adjusted EBIT | $ 550 | $ 746 | $ 855 | $ 861 | $ 828 | $ 878 | $ 786 | $1,415 | $1,762 | $1,805
Net sales | $5,350 | $5,677 | $6,384 | $7,057 | $7,160 | $7,055 | $6,447 | $8,498 | $9,761 | $9,677
Adjusted EBIT as a % of Net sales | 10 % | 13 % | 13 % | 12 % | 12 % | 12 % | 12 % | 17 % | 18 % | 19 %
Earnings (loss) before interest and taxes | 548 | 699 | 737 | 821 | 753 | (124) | n/a | 1,448 | 1,723 | 1,667
Depreciation and amortization | 300 | 343 | 371 | 433 | 457 | 493 | n/a | 502 | 531 | 609
Earnings before interest and taxes, depreciation and amortization | 848 | 1,042 | 1,108 | 1,254 | 1,210 | 369 | n/a | 1,950 | 2,254 | 2,276
Less: Adjusting items (a) | (2) | (47) | (118) | (40) | (75) | (1,002) | n/a | 33 | (39) | (138)
Accelerated depreciation and amortization included in restructuring | (3) | (19) | (17) | (10) | (9) | (20) | n/a | (13) | (26) | (101)
Adjusted EBITDA | $ 847 | $1,070 | $1,209 | $1,284 | $1,276 | $1,351 | $1,173 | $1,904 | $2,267 | $2,313
Net sales | $5,350 | $5,677 | $6,384 | $7,057 | $7,160 | $7,055 | $6,447 | $8,498 | $9,761 | $9,677
Adjusted EBITDA as a % of Net sales | 16 % | 19 % | 19 % | 18 % | 18 % | 19 % | 18 % | 22 % | 23 % | 24 %
(a) Management excludes from net earnings (loss) attributable to Owens Corning certain items it believes are not representative of ongoing operations. Please refer to Table 1 of the Appendix C for explanation of adjusting items.
28
Visuals: A screenshot-style financial table with a dark grey (#505050) header row with white bold year labels (2015 to 2023, plus 'Average 2015 to 2020' between 2020 and 2021). Body rows alternate between light grey (#D0D0D0) and white shading, with black rules above and below subtotal rows (Net earnings (loss), Earnings (loss) before interest and taxes, Adjusted EBIT, Adjusted EBITDA). Right-aligned numeric columns for 2015 to 2023, with 'n/a' in the average column for most rows. Two sections are separated by a blank gap: the Adjusted EBIT build, then the EBITDA build. The italic footnote sits below the table. Owens Corning logo at bottom left: a small red square with a white swoosh and the white text 'OWENS CORNING'.
Slides 29 to 31 continue in the full text file.
Download this deck
The hosted PDF of every library deck is free for readers of the SlideDeck Co newsletter. Join with your email and the viewer and download appear here.
Preparing a results presentation or business update of your own? The SlideDeck Co Standard Deck is a slide library for business reviews, updates and plans.







