
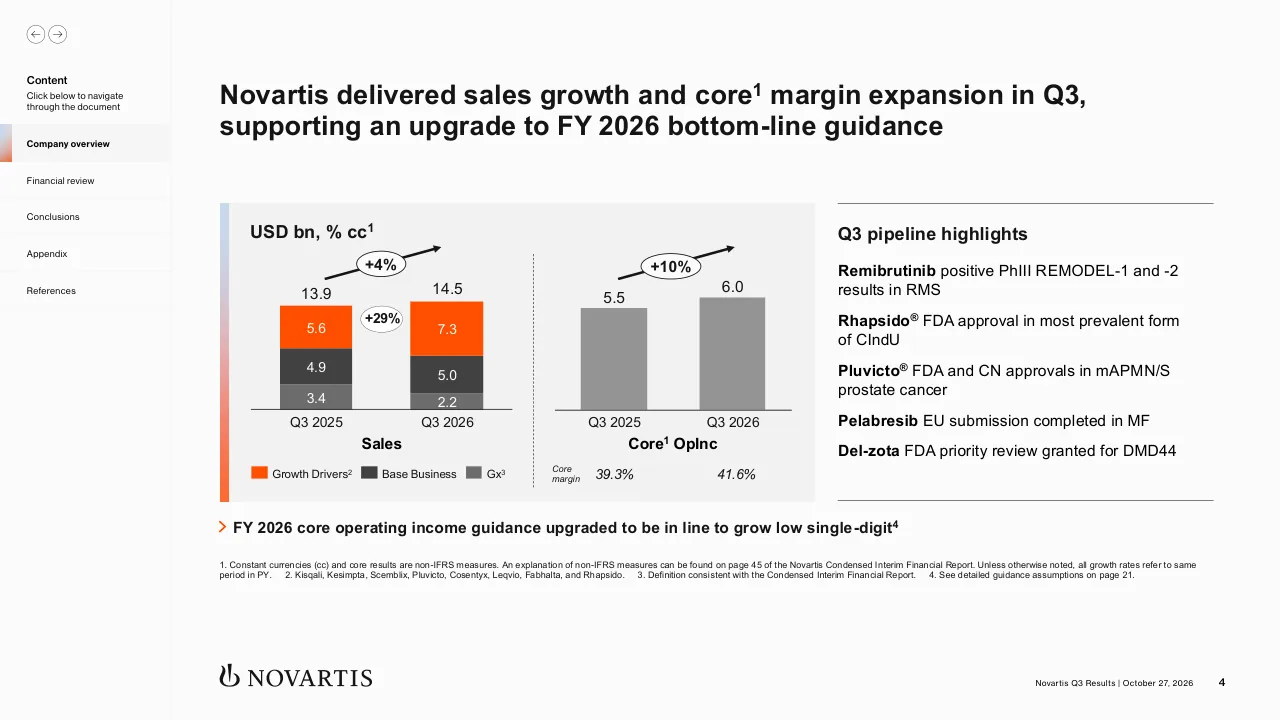
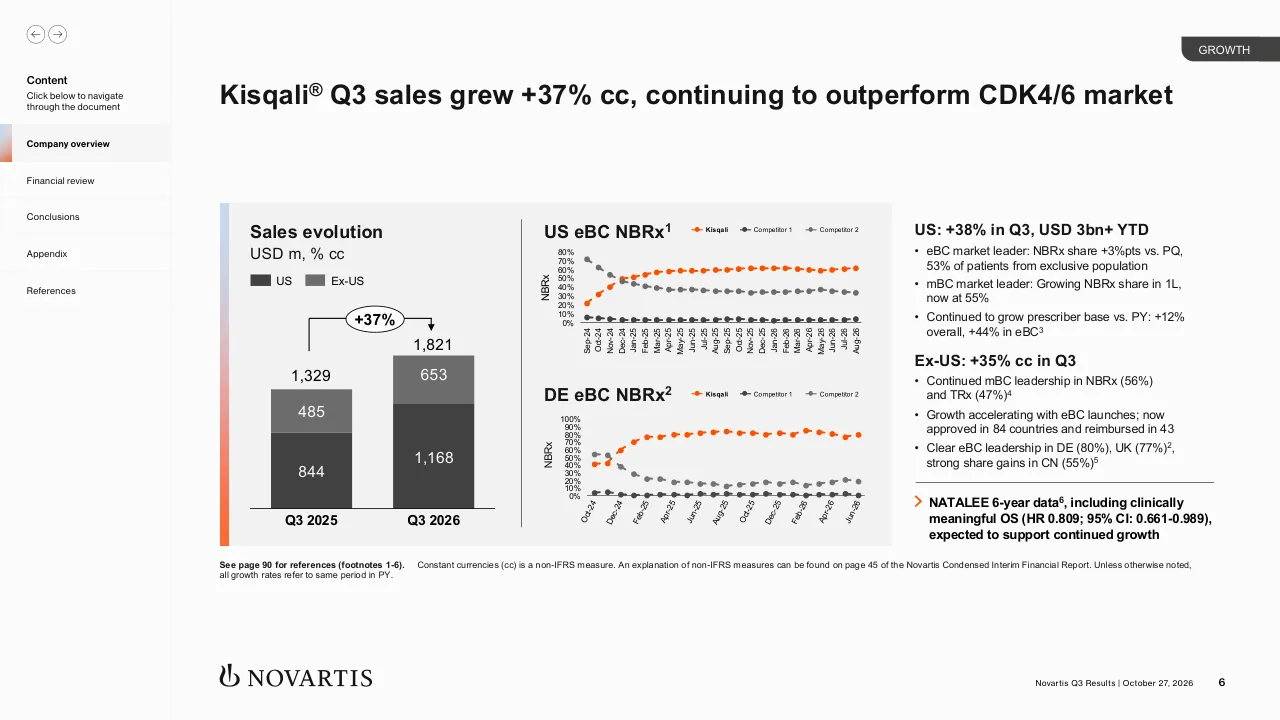
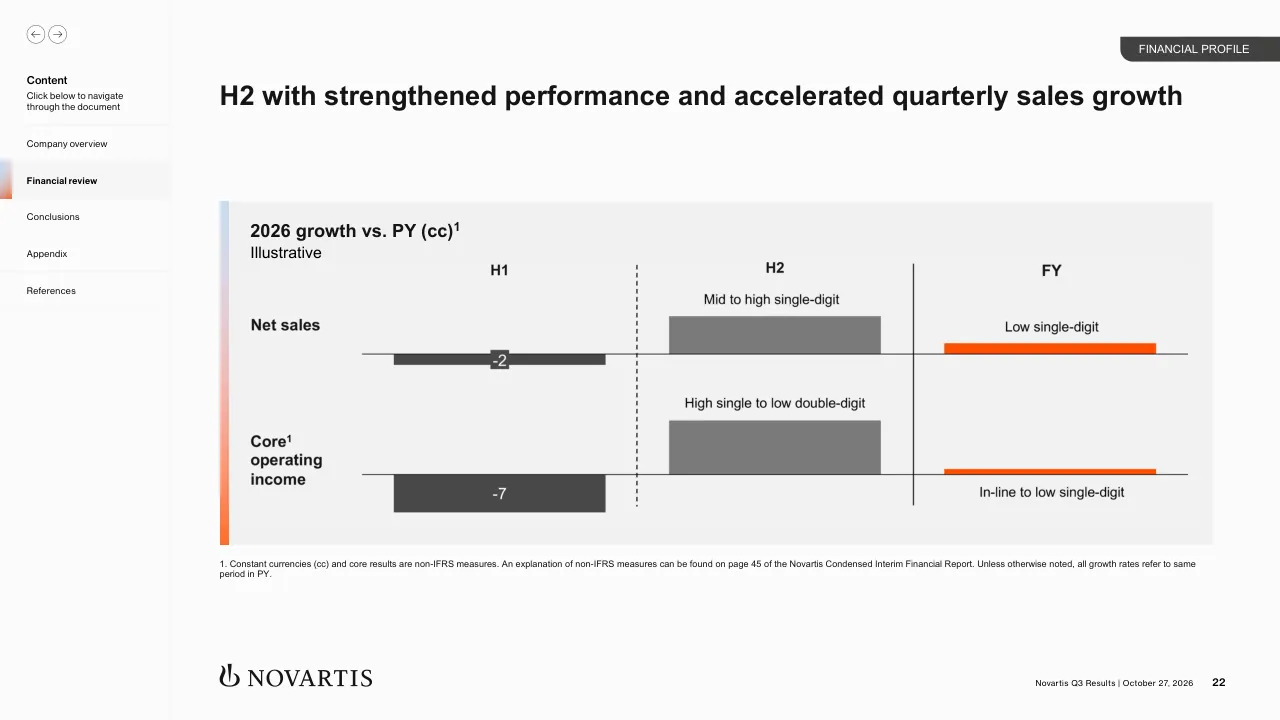
The deck is Novartis's Q3 2026 results investor presentation, dated October 27, 2026, and presented by CEO Vas Narasimhan and CFO Mukul Mehta. It opens with a title slide and a forward-looking statements disclaimer, then moves through a sequence of sections: company overview, financial review, innovation and pipeline, conclusions, and a large appendix. The company overview covers Q3 sales growth, core margin expansion, and sales tables for priority brands such as Kisqali, Kesimpta, Pluvicto, Leqvio, Scemblix, Cosentyx and Rhapsido, each with a slide of quarterly charts and market-share commentary. The financial review presents key figures, capital allocation, the raised full-year core operating income guidance, a quarterly growth outlook and a currency impact slide. The innovation section reports readouts for remibrutinib, del-desiran and pelacarsen, followed by a pipeline overview and a detailed appendix of clinical trial summaries. The deck closes with conclusions and an upcoming investor event. Slides worth studying include the Q3 headline summary, which pairs bar charts with a short list of pipeline highlights, and the Kisqali slide, which combines a monthly NBRx trend line with a competitor comparison.
Slides worth studying
Questions about this deck
How many slides or pages does the Novartis Q3 2026 results investor presentation have?
The deck has 91 pages in total. Slide 1 is the title slide and opens with a navigation menu listing Company overview, Financial review, Conclusions, Appendix and References.
What did Novartis report for Kisqali sales growth in Q3 2026?
Kisqali Q3 sales grew +37% cc, with Q3 2026 sales of 1,821 USD million. Slide 6 also notes that US sales were up +38% in Q3 and that Kisqali is the eBC market leader in the US.
What is the Novartis FY 2026 core operating income guidance after the Q3 update?
Novartis upgraded its FY 2026 core operating income guidance to be in line to grow low single-digit. Slide 4 gives this guidance, and it refers to the detailed assumptions on slide 21.
What did Novartis report for remibrutinib in the Q3 2026 innovation readouts?
Slide 14 states that the primary endpoint was met in both Phase III REMODEL-1 and REMODEL-2 trials in RMS, significantly reducing ARR versus teriflunomide. The slide also says the FDA submission is expected in Q4 with a priority review voucher.
Details
- Company: Novartis
- Year: 2026
- Type: Investor presentation
- Industry: Pharmaceuticals
- Pages: 91
Review score: 7 out of 10, Effective
Presentation quality, judged with the SlideDeck Co review heuristic. Ask, evidence and idea merit are not rated here.
The main section (slides 4 to 26) is a competent investor deck. Slides 4, 6 and 22 use full-sentence action titles, a consistent chart-plus-commentary layout and a restrained orange and grey palette, so the audience can see growth, margin and guidance quickly. The route is logical: headline results, priority brands, pipeline readouts, financial review and guidance, conclusions, then the investor event. The weaknesses are consequential. Slide 6 has very small chart axes, labels and legends with weak competitor differentiation, and slides 4 and 22 leave large empty bands under the titles. The appendix from about slide 27 onward is a long run of near-identical text-only trial tables set in tiny type (slides 30 to 36 and 39 to 72), which is reference material that is hard to read on screen.
Worth keeping: The action titles, the consistent brand layout with the left navigation and section tags, and the restrained orange highlight for the key series on slides 4, 6 and 22.
Most useful repair: Enlarge the chart text and simplify the NBRx lines on slide 6, close the empty space under the titles on slides 4 and 22, and make the tiny pipeline tables on slides 30 to 36 legible.
What would change the score: Cut or consolidate the repetitive clinical-trial appendix into a readable reference format with highlighted key fields, and add a stronger visual for the slide 14 readout outcomes.
Confidence medium. 72 of 91 pages inspected on contact sheets, 4 at readable size. Reviewed 2026-11-08. Model-assisted review (claude-sonnet-5-5).
Full text of the slides (91 slides)
Every slide's words and a description of its charts and images, so the deck can be searched and rebuilt. Also available as Markdown.
Slide 1
Content
Click below to navigate through the document
Company overview
Financial review
Conclusions
Appendix
References
Investor presentation
October 27, 2026
Q3 2026
Results
NOVARTIS
Visuals: Two circular outline buttons at top left holding a left arrow and a right arrow. Thin light grey horizontal divider lines between the menu items. A small solid orange-red vertical bar sits above the gap between the gradient panel and the photo. The gradient panel has a soft blurred blend of light blue at the left, peach and pink in the middle, and bright orange at the upper right. A cropped photograph of a modern glass Novartis office building with angular faceted glass roofs, a bare tree with yellow autumn leaves in front, orange foliage at the bottom, and a pale overcast sky. A tall office block at the right edge carries a NOVARTIS sign tilted diagonally in teal letters with a red logo mark. Novartis logo: a black flame-like symbol with the serif wordmark NOVARTIS.
Slide 2
Content
Click below to navigate through the document
Company overview
Financial review
Conclusions
Appendix
References
Disclaimer
This presentation contains forward-looking statements within the meaning of the United States Private Securities Litigation Reform Act of 1995, that can generally be identified by words such as “potential,” “expected,” “will,” “plan,” “pipeline,” “outlook,” “confident,” or similar expressions, or by express or implied discussions regarding: potential new products, potential new indications for existing products, potential product launches or potential future revenues from any such products; or results of ongoing clinical trials; potential future, pending or announced transactions; potential future sales or earnings; strategy, plans, expectations or intentions, including discussions regarding our continued investment into new R&D capabilities and manufacturing; our capital structure. You should not place undue reliance on these statements. Such forward-looking statements are based on the current beliefs and expectations of management regarding future events and are subject to significant known and unknown risks and uncertainties. Should one or more of these risks or uncertainties materialize, or should underlying assumptions prove incorrect, actual results may vary materially from those set forth in the forward-looking statements. There can be no guarantee that the investigational or approved products described in this presentation will be submitted or approved for sale or for any additional indications or labeling in any market, or at any particular time. Nor can there be any guarantee that such products will be commercially successful in the future. Neither can there be any guarantee that the expected benefits or synergies from the transactions described in this presentation will be achieved in the expected timeframe, or at all. In particular, our expectations could be affected by, among other things, uncertainties concerning: global healthcare cost containment, including ongoing government, payer and general public pricing and reimbursement pressures and requirements for increased pricing transparency; the success of key products, commercial priorities and strategy; the research and development of new products, including clinical trial results and additional analysis of existing clinical data; our ability to obtain or maintain proprietary intellectual property protection, including the ultimate extent of the impact on Novartis of the loss of patent protection and exclusivity on key products; our ability to realize the strategic benefits, operational efficiencies or opportunities expected from our external business opportunities; the development or adoption of new technologies, including artificial intelligence, and new business models; the implementation of our new IT projects and systems; potential significant breaches of information security or disruptions of our information technology systems; actual or potential legal proceedings, including regulatory actions or delays or government regulation related to the products and pipeline products described in this presentation; safety, quality, data integrity, or manufacturing issues; our performance on and ability to comply with environmental, social and governance measures and requirements; major macroeconomic and geo- and socio-political developments, including the impact of any potential tariffs on our products or the impact of war in certain parts of the world; future global exchange rates; future demand for our products; and other risks and factors referred to in Novartis AG’s most recently filed Form 20-F and in subsequent reports filed with, or furnished to, the US Securities and Exchange Commission. Novartis is providing the information in this presentation as of this date and does not undertake any obligation to update any forward-looking statements as a result of new information, future events or otherwise.
All trademarks in this presentation are the property of their respective owners.
This presentation includes non-IFRS financial measures, including constant currencies (cc), core results and free cash flow. An explanation of non-IFRS measures can be found on page 45 of the Novartis Condensed Interim Financial Report.
NOVARTIS
Novartis Q3 Results | October 27, 2026
2
Visuals: Two small circular outline icon buttons at top left of the sidebar: one with a left arrow, one with a right arrow (thin dark grey/black 1px outline, about 1.4% of slide height in diameter each... roughly 32px circles). A thin vertical grey divider line separates the sidebar from the main area at x≈13.3%. Thin light grey horizontal rules lie beneath the sidebar heading block and between each menu item. Novartis logo at bottom left: a black flame/droplet-with-flask emblem to the left of the serif wordmark 'NOVARTIS' in black capitals.
Slide 3
Content
Click below to navigate / through the document
Company overview
Financial review
Conclusions
Appendix
References
Company overview
Vas Narasimhan, M.D.
Chief Executive Officer
NOVARTIS
Visuals: Full-bleed, full-height colour photograph on the right (about 49% of the slide width): studio portrait of a man with short dark hair graying at the temples, a slight closed-mouth smile, looking at the camera. Head-and-shoulders crop, he wears a light periwinkle-blue checked collared shirt, against a mottled grey-blue backdrop. Soft studio lighting. Sidebar has two small circular outline buttons (left arrow and right arrow) at top left, thin black strokes. The active menu item 'Company overview' has a light grey highlight band with a small vertical gradient tab at its left edge (blue at top to orange/red at bottom). Thin light grey divider lines separate menu items and a vertical divider separates the sidebar from the main area. The Novartis logo is a black flame/flask-like emblem with the serif wordmark NOVARTIS.
Slide 4
Content
Click below to navigate through the document
Company overview
Financial review
Conclusions
Appendix
References
Novartis delivered sales growth and core¹ margin expansion in Q3, / supporting an upgrade to FY 2026 bottom-line guidance
USD bn, % cc¹
+4%
+29%
+10%
13.9
14.5
5.6
7.3
4.9
5.0
3.4
2.2
Q3 2025
Q3 2026
Sales
Growth Drivers²
Base Business
Gx³
5.5
6.0
Q3 2025
Q3 2026
Core¹ OpInc
Core margin
39.3%
41.6%
Q3 pipeline highlights
Remibrutinib positive PhIII REMODEL-1 and -2 results in RMS
Rhapsido® FDA approval in most prevalent form of CIndU
Pluvicto® FDA and CN approvals in mAPMN/S prostate cancer
Pelabresib EU submission completed in MF
Del-zota FDA priority review granted for DMD44
FY 2026 core operating income guidance upgraded to be in line to grow low single-digit⁴
1. Constant currencies (cc) and core results are non-IFRS measures. An explanation of non-IFRS measures can be found on page 45 of the Novartis Condensed Interim Financial Report. Unless otherwise noted, all growth rates refer to same period in PY. 2. Kisqali, Kesimpta, Scemblix, Pluvicto, Cosentyx, Leqvio, Fabhalta, and Rhapsido. 3. Definition consistent with the Condensed Interim Financial Report. 4. See detailed guidance assumptions on page 21.
NOVARTIS
Novartis Q3 Results | October 27, 2026
4
Visuals: Left sidebar: two small circular outline buttons with left and right arrows at top-left. 'Company overview' menu row is highlighted with a light grey fill and a vertical gradient bar at its left edge (blue to orange). Thin light grey separator lines between menu items. Chart panel: light grey (#F2F2F2) box with a narrow vertical gradient strip on its left edge (light blue at top to orange-red at bottom). Left chart is a stacked column chart, 'Sales' in USD bn: Q3 2025 total 13.9 with segments Gx 3.4 (mid grey), Base Business 4.9 (dark grey #404040), Growth Drivers 5.6 (orange #FF4E00); Q3 2026 total 14.5 with Gx 2.2, Base Business 5.0, Growth Drivers 7.3. A black arrow slanting upward with an oval label '+4%' links the totals, and a small oval '+29%' sits between the Growth Drivers segments. Black baseline under the columns. Legend below with squares: orange Growth Drivers², dark grey Base Business, mid grey Gx³. A vertical dotted divider separates the charts. Right chart: two grey (#949594) columns, 'Core¹ OpInc': Q3 2025 5.5 and Q3 2026 6.0, with an upward arrow and oval '+10%'. Core margin row in italics: 39.3% and 41.6%. Two thin dark horizontal rules above and below the right highlights column. Small orange chevron before the guidance line. Novartis logo (flame-like icon plus serif wordmark) at bottom left.
Slide 5
Content
Click below to navigate through the document
Company overview
Financial review
Conclusions
Appendix
References
GROWTH
Priority brands and launches continued to show strong growth, / demonstrating the replacement power of the business
Q3 Sales
Sales
USD million
Growth vs. PY
USD million
Growth vs. PY
cc1
KISQALI ribociclib
1,821
492
37%
Kesimpta (ofatumumab)
1,484
262
22%
SCEMBLIX (asciminib)
593
235
67%
LEQVIO
506
198
63%
Cosentyx (secukinumab)
1,857
159
9%
PLUVICTO
674
110
20%
Rhapsido (remibrutinib) 25mg tablets
101
101
nm
FABHALTA (iptacopan)
237
88
60%
Strong / growth / +29% cc1
1. Constant currencies (cc) is a non-IFRS measure. An explanation of non-IFRS measures can be found on page 45 of the Novartis Condensed Interim Financial Report. Unless otherwise noted, all growth rates refer to same period in PY. / nm = not meaningful.
NOVARTIS
Novartis Q3 Results | October 27, 2026
5
Visuals: Horizontal bar chart in table form titled 'Q3 Sales' with columns: brand logo, Sales (USD million), bar of Growth vs. PY in USD million, and Growth vs. PY in cc. Eight rows separated by thin grey lines, with a black vertical axis line at the bar start and a black rule under the header and at the bottom. Dark grey bars with bold value labels at the bar end: Kisqali 1,821 sales, bar 492, 37%; Kesimpta 1,484, 262, 22%; Scemblix 593, 235, 67%; Leqvio 506, 198, 63%; Cosentyx 1,857, 159, 9%; Pluvicto 674, 110, 20%; Rhapsido 101, 101, nm; Fabhalta 237, 88, 60%. Brand logos at the left of each row: Kisqali (blue and orange icon with dark wordmark), Kesimpta (teal icon, dark wordmark), Scemblix (red wordmark), Leqvio (teal-blue wordmark with icon), Cosentyx (purple/pink icon and wordmark), Pluvicto (blue wordmark with red/orange icon), Rhapsido (blue wordmark with red and blue arrow), Fabhalta (green icon, dark wordmark). Vertical gradient strip at left edge of panel from pale blue at top through pink to orange at bottom. Dashed black bracket to the right of the rows pointing to the 'Strong growth +29% cc1' callout. Sidebar has two circular outline arrow buttons (left and right), a highlighted active menu row for 'Company overview' with a blue-to-orange gradient strip on its left edge, and thin divider lines between items. Novartis logo with flame-like icon and serif wordmark bottom left. GROWTH dark grey tab with rounded bottom-left corner at top right.
Slide 6
Content
Click below to navigate through the document
Company overview
Financial review
Conclusions
Appendix
References
GROWTH
Kisqali® Q3 sales grew +37% cc, continuing to outperform CDK4/6 market
Sales evolution
USD m, % cc
US
Ex-US
+37%
1,821
1,329
653
485
1,168
844
Q3 2025
Q3 2026
US eBC NBRx1
Kisqali
Competitor 1
Competitor 2
NBRx
80%
70%
60%
50%
40%
30%
20%
10%
0%
Sep-24 Oct-24 Nov-24 Dec-24 Jan-25 Feb-25 Mar-25 Apr-25 May-25 Jun-25 Jul-25 Aug-25 Sep-25 Oct-25 Nov-25 Dec-25 Jan-26 Feb-26 Mar-26 Apr-26 May-26 Jun-26 Jul-26 Aug-26
DE eBC NBRx2
Kisqali
Competitor 1
Competitor 2
NBRx
100%
90%
80%
70%
60%
50%
40%
30%
20%
10%
0%
Oct-24 Dec-24 Feb-25 Apr-25 Jun-25 Aug-25 Oct-25 Dec-25 Feb-26 Apr-26 Jun-26
US: +38% in Q3, USD 3bn+ YTD
• eBC market leader: NBRx share +3%pts vs. PQ, 53% of patients from exclusive population
• mBC market leader: Growing NBRx share in 1L, now at 55%
• Continued to grow prescriber base vs. PY: +12% overall, +44% in eBC3
Ex-US: +35% cc in Q3
• Continued mBC leadership in NBRx (56%) and TRx (47%)4
• Growth accelerating with eBC launches; now approved in 84 countries and reimbursed in 43
• Clear eBC leadership in DE (80%), UK (77%)2, strong share gains in CN (55%)5
NATALEE 6-year data6, including clinically meaningful OS (HR 0.809; 95% CI: 0.661-0.989), expected to support continued growth
See page 90 for references (footnotes 1-6).
Constant currencies (cc) is a non-IFRS measure. An explanation of non-IFRS measures can be found on page 45 of the Novartis Condensed Interim Financial Report. Unless otherwise noted,
all growth rates refer to same period in PY.
NOVARTIS
Novartis Q3 Results | October 27, 2026
6
Visuals: Left sidebar: two circular outline icons with left and right arrows at top-left. 'Company overview' row is highlighted with light grey fill and a vertical blue-to-orange gradient bar on its left edge; thin separator lines between menu items. Top right: dark grey tab with rounded bottom-left corner containing GROWTH. Chart panel: light grey (#F2F2F2) panel with a thin vertical gradient strip on its left edge (pale blue at top to orange at bottom). Stacked bar chart 'Sales evolution' with legend (dark grey square US, mid grey square Ex-US). Two bars on a black baseline: Q3 2025 total 1,329 (US 844 dark grey #414140 bottom, Ex-US 485 mid grey #6D6E6C top); Q3 2026 total 1,821 (US 1,168, Ex-US 653). A bracket line connects above the Q3 2025 bar to an oval labelled +37% with an arrow pointing down to the 1,821 total. A thin vertical divider separates it from two dotted line charts. Top chart 'US eBC NBRx1': y-axis 0% to 80%, x-axis monthly Sep-24 to Aug-26 with rotated labels; orange Kisqali series rises from about 22% to about 60%; dark grey Competitor 1 near 5% flat; grey Competitor 2 falls from about 72% to about 37%. Legend with orange, dark grey and grey dotted markers. Bottom chart 'DE eBC NBRx2': y-axis 0% to 100%, x-axis Oct-24 to Jun-26 labels every two months; orange Kisqali rises from about 42% to about 80%; Competitor 2 falls from about 57% to about 20%; Competitor 1 near 3%. A thin horizontal rule above the NATALEE callout, an orange chevron arrow left of the callout. Novartis logo (flame-like symbol and serif wordmark) bottom left.
Slide 7
Content
Click below to navigate through the document
Company overview
Financial review
Conclusions
Appendix
References
GROWTH
Kesimpta® Q3 sales grew +22% cc, fueled by continued strong demand
Sales evolution
USD m, % cc
US
Ex-US
+22%
1,484
1,222
478
394
1,006
828
Q3 2025
Q3 2026
US: +21% cc in Q3
• TRx growth¹ outpacing the market, +3%pts in MS (~16% share) and +4.5%pts in B-cell class (~27% share) vs. PY
• Continuing to be prescribed earlier in therapy, with 77% of NBRx’s 1L or 1st switch
Ex-US: +23% cc in Q3
• Strong growth in Europe, treating ~1/6 MS patients²
• ~80% of EU4³ patients from 1L or 1st switch
Continued evidence generation highlighted at MSToronto
• STHENOS (Phase IIIb study) supports 1L initiation of Kesimpta in mildly active patients
• ALITHIOS (OLE study) shows sustained high efficacy and a consistent safety and tolerability profile over 8 years
• KATHAROS (prospective OL breastfeeding study) supports treatment decisions for women with MS
• NEOS (Phase III study) broadens the evidence base in paediatric MS
See page 90 for references (footnotes 1-3).
Constant currencies (cc) is a non-IFRS measure. An explanation of non-IFRS measures can be found on page 45 of the Novartis Condensed Interim Financial Report. Unless otherwise noted, all growth rates refer to same period in PY.
NOVARTIS
Novartis Q3 Results | October 27, 2026
7
Visuals: Stacked column chart 'Sales evolution', USD m, % cc, on a light grey panel with a vertical blue-to-orange gradient strip on its left edge. Two columns: Q3 2025 total 1,222 (US 828 dark grey, Ex-US 394 mid grey) and Q3 2026 total 1,484 (US 1,006 dark grey, Ex-US 478 mid grey). Legend: dark grey square US, mid grey square Ex-US. A bracket line runs from the top of the 1,222 column up and across to an oval labelled '+22%' with an arrow pointing down to the 1,484 column. Black baseline under the columns, no y axis. Sidebar has two circular outline arrow icons (left and right), a highlighted 'Company overview' menu row with a blue-to-orange gradient bar on its left edge, and thin divider lines between menu items. Novartis logo with flame/ symbol mark and serif wordmark. Dark grey rounded-corner tab 'GROWTH' at top right.
Slide 8
Content
Click below to navigate through the document
Company overview
Financial review
Conclusions
Appendix
References
GROWTH
Pluvicto® Q3 sales grew +20% cc, driven by strong ex-US momentum and / US pre-taxane growth
Sales evolution
USD m, % cc
US
Ex-US
+20%
674
564
172
104
460
502
Q3 2025
Q3 2026
US: +9% in Q3
• Growth driven by pre-taxane setting (70% of business), with use after only 1 ARPI largest contributor
• 1L mAPMR (mCRPC) NBRx share of 15%; further share gains vs. ARPIs remains top priority
• FDA approval for PSMAddition in August; expect initial uptake in Q4 with acceleration in 2027
Ex-US: +68% cc in Q3
• Accelerating adoption in Europe, Canada and Japan, with continued momentum in China¹
• Japan became the fastest market to reach 1,000 patients, supported by ongoing site expansion
• China NMPA approval for PSMAddition in August; expect growth acceleration supported by 6x / expansion in treatment centers vs. PY
See page 90 for references (footnote 1).
Constant currencies (cc) is a non-IFRS measure. An explanation of non-IFRS measures can be found on page 45 of the Novartis Condensed Interim Financial Report. Unless otherwise noted, all / growth rates refer to same period in PY.
NOVARTIS
Novartis Q3 Results | October 27, 2026
8
Visuals: Stacked bar chart 'Sales evolution', USD m, % cc, in a light grey card (#F2F2F2) with a vertical gradient strip at its left edge (pale blue #C5D8EE at top to orange #FF6A2F at bottom). Legend: dark grey square = US, mid grey square = Ex-US. Two stacked bars on a thin black baseline, no y-axis. Q3 2025: US 460 (dark #414241), Ex-US 104 (mid grey #6D6E6D), total 564 above. Q3 2026: US 502, Ex-US 172, total 674 above. A bracket-style black arrow runs from above the 564 total up, across to the right, and down with an arrowhead to above the 674 total, with a white oval labelled +20% on the line. Sidebar has two circular outline arrow buttons (left and right) at top left. The active item 'Company overview' sits in a light grey band with a left gradient strip (blue to orange). Thin divider lines between sidebar items. Dark charcoal tab with rounded lower-left corner holds GROWTH. Novartis logo: flame-like line icon plus serif NOVARTIS wordmark.
Slide 9
Content
Click below to navigate through the document
Company overview
Financial review
Conclusions
Appendix
References
GROWTH
Promising early indicators for PSMAddition launch in US
Strong foundation in place
>2/3 mAPMN/S (mHSPC) patients managed by HCPs already using Pluvicto or connected to established referral pathways
Broad treatment site access and capacity, with 9/10 patients within 30 miles of site in US
Continued efforts to help address non-clinical aspects, including further shortening time to treatment
Launch dynamics
Expect 5-10 weeks lead-time for new patients to be treated
Fastest uptake expected in high tumor burden and de novo patient segments where unmet need is highest vs. ADT+ARPI
Continued expansion in community, including urology
Encouraged by early uptake indicators, including new patient orders and highest-ever NBRx in September
Infusion
Pre-filled syringe
NOVARTIS
Novartis Q3 Results | October 27, 2026
9
Visuals: Navigation sidebar with two circular arrow icons (left and right) in outline at top left. The 'Company overview' item is highlighted with a light grey bar and a left vertical blue-to-orange gradient strip. Two cards, each with a light grey header band, a thin dark grey outline and a left vertical gradient strip (light blue at top through pink to orange at bottom). Photo 1: Pluvicto infusion packaging, a green-capped round lead container with a white label reading PLUVICTO next to a small glass vial with a red cap, on a white background with a soft shadow. Photo 2: pre-filled syringe kit, a cream/beige cylindrical shield with cap and a small syringe with a red tip lying diagonally beneath it, on a white background. Each photo has a white rounded-corner label box with a thin grey outline to its right ('Infusion', 'Pre-filled syringe'). Dark grey GROWTH tab with rounded lower-left corner at the top right. Novartis logo with flame-like symbol and serif wordmark at bottom left.
Slide 10
Content
Click below to navigate through the document
Company overview
Financial review
Conclusions
Appendix
References
GROWTH
Leqvio® grew +63% cc in Q3, reflecting strong demand around the world
Sales evolution
USD m, % cc
US
Ex-US
+63%
506
272
234
308
162
146
Q3 2025
Q3 2026
US: +60% in Q3, outgrowing advanced lipid-lowering market1,2,3
• MOTRx growth (+60%) ahead of market (+46%) and main competitor (+46%), reflecting Leqvio’s differentiated persistency
• Continued improvement in Medicare NBRx share (+4.9%pts to 22%)4
• Increasing depth in priority health systems (+28% vs. PY), with continued focus on post-event patients and increasing access/acquisition confidence
• US label updated with cardiovascular outcomes statement; ORION-4 and V2P readouts anticipated in Q4 and 2027, respectively
Ex-US: +65% cc in Q3
• China growth continues post-NRDL as hospital listings expand
• Sustained growth in Europe
Expanding Leqvio evidence
• V-CHALLENGE presented at ESC, showing superior LDL-C lowering vs. bempedoic acid
• ORION-4 and V2P design papers published in AHJ
See page 90 for references (footnotes 1-4). Constant currencies (cc) is a non-IFRS measure. An explanation of non-IFRS measures can be found on page 45 of the Novartis Condensed Interim Financial Report. Unless otherwise noted, all growth rates refer to same period in PY. Novartis obtained global rights to develop, manufacture, and commercialize Leqvio under license/collaboration agreement with Alnylam Pharmaceuticals.
NOVARTIS
Novartis Q3 Results | October 27, 2026
10
Visuals: Left sidebar: two circular outline icons with left and right arrows at top left. The 'Company overview' menu row is highlighted with a light grey fill and a thin vertical orange-to-blue gradient bar at its left edge. Thin horizontal divider lines separate the menu items. A thin vertical line separates the sidebar from the main area. Top right: dark grey tab with rounded lower-left corner holding the word GROWTH. Chart panel: light grey box with a vertical gradient strip on its left edge running from pale blue at top to orange at bottom. Stacked bar chart 'Sales evolution', USD m, % cc, with legend of dark grey square (US) and mid grey square (Ex-US). Two bars on a black baseline, no value axis. Q3 2025 bar: US 146 (dark grey, bottom), Ex-US 162 (mid grey, top), total 308 above the bar. Q3 2026 bar: US 234 (dark), Ex-US 272 (mid), total 506 above the bar. Segment values are in white. A black elbow arrow runs from above the Q3 2025 bar up, then right to the Q3 2026 bar and down with an arrowhead to the 506 label, interrupted by an oval white-filled outlined label '+63%' in bold. Bottom left: Novartis logo, a flame-like symbol with the NOVARTIS wordmark in a serif typeface.
Slide 11
Content
Click below to navigate through the document
Company overview
Financial review
Conclusions
Appendix
References
GROWTH
Scemblix® Q3 sales grew +67% cc, driven by strong US momentum
Sales evolution
USD m, % cc
US
Ex-US
+67%
593
179
414
358
125
233
Q3 2025
Q3 2026
US 1L NBRx Share (R3M)1
Competitor 1
Competitor 2
Competitor 3
Competitor 4
Competitor 5
Scemblix
17%
24%
25%
32%
30%
33%
Jan-25 Feb-25 Mar-25 Apr-25 May-25 Jun-25 Jul-25 Aug-25 Sep-25 Oct-25 Nov-25 Dec-25 Jan-26 Feb-26 Mar-26 Apr-26 May-26 Jun-26
JP 1L NBRx Share (Quarterly)2
Competitor 1
Competitor 2
Competitor 3
Competitor 4
Scemblix
18
45
50
49
56
27
19
14
15
Q4’24
Q1’25
Q2’25
Q3’25
Q4’25
Q1’26
Q2’26
US: +78% in Q3
Achieved 1L NBRx leadership with 33% share (+4%pts vs. PQ)1
Maintained leadership in later lines; expect continued shift in treatment mix from 2L/3L toward 1L3
Ex-US: +46% cc in Q3
Continued 3L+ NBRx leadership with 77% share across key markets4
Early-line indication now approved in 69 ex-US countries
JP sustained 1L NBRx leadership, achieving 56% share, DE 1L NBRx share 33%5
See page 91 for references (footnotes 1-5). Constant currencies (cc) is a non-IFRS measure. An explanation of non-IFRS measures can be found on page 45 of the Novartis Condensed Interim Financial Report. Unless otherwise noted, all growth rates refer to same period in PY.
NOVARTIS
Novartis Q3 Results | October 27, 2026
11
Visuals: Sidebar: two small circular outline icons with left and right arrows at top-left; the active menu item 'Company overview' has a light grey highlight band with a vertical blue-to-orange gradient strip on its left edge; thin separator lines between menu items. GROWTH tab: dark grey rounded-left tab at the top right edge. Grey chart panel with a thin vertical gradient strip on the left edge (light blue at top to orange at bottom). Stacked bar chart 'Sales evolution' (USD m, % cc), with legend squares dark grey for US and mid grey for Ex-US. Q3 2025 bar: US 233 (dark), Ex-US 125 (mid grey), total 358. Q3 2026 bar: US 414, Ex-US 179, total 593. A bracket line from the 358 bar goes up and across through an oval labelled +67% to an arrowhead pointing down at 593. Baseline under the bars. A thin vertical divider separates the bar chart from the line charts. US 1L NBRx Share (R3M) line chart: monthly Jan-25 to Jun-26 on x-axis with rotated labels; legend of Competitor 1 (black), Competitor 2 (dark grey), Competitor 3 (mid grey), Competitor 4 (light grey), Competitor 5 (very light grey), Scemblix (orange). The orange line rises from 17% to 24%, 25%, 32%, 30% and 33%, ending above the others. JP 1L NBRx Share (Quarterly) line chart: Q4'24 to Q2'26; Competitor 1 black line falls from the top-left to 27 then 19; competitors 2-4 grey lines decline to 14 and 15; the orange Scemblix line rises from 18 to 45, 50, 49 and 56, with a small bracket near 49. Bullet lists with round bullets on the right. Novartis logo: a stylised flame-like mark with the NOVARTIS serif wordmark.
Slide 12
Content
Click below to navigate through the document
Company overview
Financial review
Conclusions
Appendix
References
GROWTH
Cosentyx® Q3 sales grew +9% cc, with growth in HS and SpA indications
Sales evolution
USD m, % cc
US
Ex-US
+9%
1,698
1,857
693
764
1,005
1,093
Q3 2025
Q3 2026
US HS Naive NBRx Share (R4W)1
Competitor 1 (molecule 1)
Competitor 2
Cosentyx
60%
40%
20%
0%
50%
49%
48%
52%
48%
47%
48%
Aug-25
Oct-25
Dec-25
Jan-26
Mar-26
May-26
Jun-26
Aug-26
US SpA IV Patient Share2
Competitor 1
Competitor 2
Competitor 3
Cosentyx
60%
40%
20%
0%
49%
33%
14%
4%
Jul-24
Sep-24
Nov-24
Jan-25
Mar-25
May-25
Jul-25
Sep-25
Nov-25
Jan-26
Mar-26
May-26
Jul-26
US: +9% in Q3
• HS: Market leader with 48% 1L NBRx share1
• SpA: Base business resilient with stable share in a crowded market
• Growth benefited from PY RD adjustments
Ex-US: +9% cc in Q3
• Continued growth in Europe and most emerging markets
Continued indication expansion
• PMR: EC approval in October; FDA decision expected Q4
• HS IV: FDA approval in October
See page 91 for references (footnotes 1-2). Constant currencies (cc) is a non-IFRS measure. An explanation of non-IFRS measures can be found on page 45 of the Novartis Condensed Interim Financial Report. Unless otherwise noted, all growth rates refer to same period in PY.
NOVARTIS
Novartis Q3 Results | October 27, 2026
12
Visuals: Stacked bar chart 'Sales evolution' (USD m, % cc) with two bars: Q3 2025 (US 1,005 dark grey, Ex-US 693 mid grey, total 1,698) and Q3 2026 (US 1,093, Ex-US 764, total 1,857). A bracket line with an arrow from the first total to the second carries an oval labelled +9%. Legend squares: US dark grey, Ex-US mid grey. Line chart 'US HS Naive NBRx Share (R4W)': y axis 0-60%, x axis Aug-25 to Aug-26; Cosentyx orange line at about 47-52% with labels 50%, 49%, 48%, 52%, 48%, 47%, 48%; Competitor 1 black line about 20-34%, Competitor 2 dark grey line about 18-31%. Line chart 'US SpA IV Patient Share': y axis 0-60%, x axis Jul-24 to Jul-26 (bimonthly); Competitor 2 dark grey about 49-55% ending 49%, Competitor 1 black about 33-37% ending 33%, Cosentyx orange rising from about 4% to 14%, Competitor 3 light grey about 4%. Left sidebar has circular arrow icons, a highlighted 'Company overview' row with a blue-to-orange gradient bar at its left edge. A vertical gradient strip (light blue to orange) on the left edge of the grey panel. Thin vertical divider between the bar chart and the line charts. Novartis logo with flame symbol. Dark grey 'GROWTH' tab with a rounded lower-left corner.
Slide 13
Content
Click below to navigate through the document
Company overview
Financial review
Conclusions
Appendix
References
GROWTH
Rhapsido® CSU launch momentum continued in Q3; FDA approval
in symptomatic dermographism (SD) supports expansion into CIndU
CSU
CIndU
Strong launch trajectory in US
• >6k prescribers, evenly split allergists/dermatologists¹
• >15k patients treated, >70% 1L after AH²
• NBRx share 26%, +3%pts vs. PQ³
• Disciplined contracting, with ~50% access to label; further access expansion anticipated in Q4 and 2027
Building momentum ex-US
• Launched in 7 markets; >1k prescribers and >7k patients⁴
• Strong early uptake in Germany and China
FDA approval in SD⁵
• First and only FDA-approved treatment for SD, most prevalent form of CIndU
• ~100k US CIndU patients uncontrolled on AH⁶; ~2/3 with SD¹
• 100% overlap with CSU prescribers, enabling an efficient launch
• Global filings across 3 CIndU subtypes⁷ expected in Q4 2026
> Upgraded peak sales guidance for Rhapsido in CSU and CIndU to USD 4bn+
See page 91 for references (footnotes 1-7).
NOVARTIS
Novartis Q3 Results | October 27, 2026
13
Visuals: Two circular outline arrow icons (left and right arrows) at top left of sidebar. Active menu item 'Company overview' highlighted with light grey band and a thin vertical blue-to-orange gradient bar at left edge. Two cards with thin dark grey outlines, each with light grey header band and a narrow vertical gradient strip on left edge (pale blue at top to orange at bottom). Thin dark vertical divider line between the two columns inside the CSU card. A small orange chevron '>' before the call-out line. Dark grey tab with rounded bottom-left corner holding 'GROWTH'. Novartis logo (flame/flask-like symbol plus serif wordmark NOVARTIS) bottom left. Thin light horizontal separators between sidebar menu items and a faint vertical line at the sidebar edge.
Slide 14
Content
Click below to navigate through the document
Company overview
Financial review
Conclusions
Appendix
References
INNOVATION
Important readouts for remibrutinib, del-desiran and pelacarsen in Q3
Remibrutinib
Del-desiran
Pelacarsen
Phase III REMODEL-1 and -2 in RMS
• Primary endpoint met in both trials, significantly reducing ARR vs. teriflunomide
• Superiority on all key secondary endpoints
• Clinically meaningful delay in disability progression
• Robust, favorable safety with no liver safety signal, consistent with approved indications
• Data presented at MSToronto2026 in October
Next steps
• FDA submission expected in Q4 with PRV
Phase III HARBOR in DM1
• Primary endpoint of vHOT vs. placebo not met
• Evidence of clinical activity in secondary endpoints and exploratory analyses
Next steps
• Data to be presented at an upcoming medical congress
• Full dataset under evaluation; HA engagement to determine development path
• Partial impairment charge of USD 1.9 billion in Q3; carrying amount USD 5.5 billion
Phase III HORIZON in CVRR
• Primary endpoint of reducing the risk of cardiovascular events vs. placebo not met, despite lower Lp(a) levels achieved
Next steps
• Data to be presented at AHA Scientific Sessions 2026 in November
• Potential future development of DII235 under assessment
Novartis reaffirmed guidance of 5-6% cc1 sales CAGR 2025-30 and mid-single-digit cc1 long-term growth outlook
1. Constant currencies (cc) is a non-IFRS measure. An explanation of non-IFRS measures can be found on page 45 of the Novartis Condensed Interim Financial Report.
NOVARTIS
Novartis Q3 Results | October 27, 2026
14
Visuals: Two circular outline arrow icons (left and right) at top left of sidebar. Active sidebar item 'Company overview' has light grey highlight row with a vertical gradient bar at left edge (blue-grey to orange). Dark grey tab at top right with rounded left corner. Large panel with thin dark grey border and a narrow vertical gradient strip on its left edge (light blue at top to orange at bottom). Panel has a light grey header band with three column titles; a circle-with-checkmark icon at the right of the Remibrutinib header and circle-with-X icons at the right of Del-desiran and Pelacarsen headers. Thin vertical dark divider lines separate the three columns. Orange chevron icon to the left of the bottom takeaway line. Novartis logo: flame/droplet symbol with NOVARTIS wordmark in serif capitals. Thin horizontal separator lines between sidebar menu items.
Slide 15
Content
Click below to navigate through the document
Company overview
Financial review
Conclusions
Appendix
References
INNOVATION
REMODEL: Remibrutinib offers comprehensive disease control and a robust / favorable safety profile, without chronic B-cell depletion
Remibrutinib delivered comprehensive / disease control…
…with a robust favorable safety profile
Relapses reduced to 1 every ~13 years
MRI activity reduced by 65-70%
>92% of patients free from disability progression / (6mCDP)1
~3x more likely to achieve NEDA-3
6-month PIRA reduced by ~30%
No liver safety signals
No infection imbalances
Nearly 50% fewer discontinuations due to AEs
Immunomodulation without B-cell depletion
Next steps: Global regulatory filings ongoing; US expected by EOY with priority review voucher
1. Clinically meaningful delay in disability progression: >92% of patients remained progression-free as assessed by 6mCDP through 24 months, nominal statistical significance.
NOVARTIS
Novartis Q3 Results | October 27, 2026
15
Visuals: Two circular outline navigation buttons (left and right arrows) at top left of the sidebar. The active sidebar item 'Company overview' has a light gray highlight bar with a blue-to-orange vertical gradient strip at its left edge. A dark gray tab with rounded left corners at the top right holds 'INNOVATION'. The central panel has a thin dark gray 1px outline, a light gray header band, and a vertical blue-to-pink-to-orange gradient strip on its left edge. A thin vertical gray divider separates the two columns. Each of the 9 list items starts with a circled-checkmark outline icon, and thin gray horizontal rules separate items. An orange chevron precedes 'Next steps:'. The Novartis flame-like logo icon sits to the left of the NOVARTIS wordmark. Small white squares sit at the right edge.
Slide 16
Content
Click below to navigate through the document
Company overview
Financial review
Conclusions
Appendix
References
INNOVATION
Remibrutinib has the potential to be a USD 4bn+ medicine in RMS, / with potential further upside from nrSPMS
RMS+nrSPMS patients treated globally
2025
~85K
~440k
~40k
~805k
~140k
~720k
~280k
~60k
~40k
Naïve
Oral
Anti-CD20
Other
Total US
Total Ex-US
Total treated RMS
Total treated nrSPMS1
Total treated RMS+nrSPMS
Remibrutinib target population
~30%
~40-100% over time
~45%
~100% over time
>38%
Treated patients on a DMT. 2025. Source: IQVIA, Spherix Chart Study, Stethos, JMDC, Novartis. Naïve = new patients per year (incidence) that receive a DMT; Oral, CD20 and Other switches = prevalent patients on each class
(Others = BRACEs and other infusions). Ex-US = Top 7 ex-US markets (EU5, Japan, Canada). 1. nrSPMS is defined by relapse history and includes patients with MRI activity. The ~85k estimate is based on treated non-active SPMS
(naSPMS) patients; as nrSPMS is a broader, overlapping population, the estimate may be conservative.
NOVARTIS
Novartis Q3 Results | October 27, 2026
16
Visuals: Waterfall-style bar chart titled 'RMS+nrSPMS patients treated globally, 2025'. No axis scale printed; baseline is a thin dark line under the bars. Dark grey bars with white bold value labels: Naïve ~40k (lowest, floating from baseline), Oral ~60k (stacked above Naïve), Anti-CD20 ~140k (stacked above Oral), Other ~40k (stacked above Anti-CD20), Total US ~280k (full bar from baseline, top aligned with Other top), Total Ex-US ~440k (floating bar starting at the top of Total US, with a white diagonal break slash through it), Total treated RMS ~720k (full bar with white diagonal break slash near top), Total treated nrSPMS ~85K (hatched, diagonal-line pattern box with dark outline, floating above the top of Total treated RMS level), Total treated RMS+nrSPMS ~805k (dark bar with white diagonal break slash, topped by a hatched box with no label). Thin dashed grey connector lines link the tops of consecutive bars. A thin vertical gradient strip (light blue at top to orange at bottom) sits along the left edge of the chart panel. A bottom band in mid-grey (#DADADA) holds 'Remibrutinib target population' row with values under Naïve ~30%, Oral ~40-100% over time, Anti-CD20 ~45%, Other ~100% over time, Total Ex-US >38%, separated by thin dashed vertical dividers. Sidebar has two circular outline arrow icons (left and right) at top left, and an active-section highlight with a blue-to-orange gradient strip at its left edge. Novartis logo (flame/hand symbol plus serif wordmark) at bottom left. The INNOVATION tab is a dark rounded-corner tab at top right.
Slide 17
Content
Click below to navigate through the document
Company overview
Financial review
Conclusions
Appendix
References
INNOVATION
Multiple readouts still expected in 2026, with a strong catalyst path in 2027
Select assets (expected)
Readouts
2026
ianalumab 1L ITP
Leqvio® CVRR-LDLC (ORION-4)
Rhapsido HS
2027
abelacimab SPAF¹
Fabhalta® gMG
ianalumab LN, SLE & SSc
Kesimpta® MS Q2M dosing
Leqvio® CVRR-LDLC (V2P)
Zigakibart IgAN
Regulatory
Studies with announced positive readouts
2026
Cosentyx® PMR approval (US)
ianalumab SjD approval (US)
Pluvicto mAPMN/S approval (JP)
Rhapsido® CIndU submissions (US, EU, JP, CN)
remibrutinib RMS submission (US)
2027
del-zota DMD approval (US)²
pelabresib MF approval (EU)
remibrutinib RMS approval (US), RMS submissions (EU, JP)
1. Event-driven trial readout. 2. Submitted for accelerated approval.
NOVARTIS
Novartis Q3 Results | October 27, 2026
17
Visuals: Two tables with thin dark horizontal rules at the top, between the 2026 and 2027 groups, and at the bottom. Each table has a light grey label panel at the left with a vertical gradient bar (light blue at top to orange at bottom) at its left edge. The Readouts panel has a circle-check icon at the bottom; the Regulatory panel has a classical building (institution) icon at the bottom. Each row has a thin line icon: gear (ianalumab 1L ITP, pelabresib, Pluvicto), heart (Leqvio, abelacimab, Fabhalta), antibody Y shape (Rhapsido, ianalumab LN/SLE, Cosentyx, ianalumab SjD), brain (Kesimpta, remibrutinib, del-zota). Sidebar has two circular arrow buttons (left and right), a highlighted 'Company overview' row with a blue-to-orange gradient bar on the left, and thin dividers between menu items. Novartis logo with flame-like symbol and serif wordmark at bottom left.
Slide 18
Content
Click below to navigate through the document
Company overview
Financial review
Conclusions
Appendix
References
Financial review
and 2026 guidance
Mukul Mehta
Chief Financial Officer
NOVARTIS
18
Novartis Q3 Results | October 27, 2026
Visuals: Right: full-bleed portrait photograph of a middle-aged man with short swept-back grey and black hair, warm brown skin, slight smile, looking at the camera. He wears a dark navy blazer over a light blue textured open-collar shirt. Head and shoulders framing, soft studio lighting, dark slate blue-grey mottled backdrop, cropped to a tall rectangle from the right edge to about 51% of the slide width. Top left: two small circular outline buttons with a left arrow and a right arrow, thin black stroke. Sidebar: thin light grey divider lines between menu items and a vertical sidebar edge line at about 13.3%. The active item Financial review has a light grey highlight band with a narrow orange-to-blue gradient tab at its left edge. Bottom left: Novartis logo, a black flame-like symbol followed by the serif wordmark NOVARTIS in capitals.
Slide 19
Content
Click below to navigate through the document
Company overview
Financial review
Conclusions
Appendix
References
FINANCIAL PROFILE
Q3 performance with net sales growth at +4% cc1 and strong core1 margin expansion
Key figures1
USD million, unless indicated otherwise
Q3 2025
Q3 2026
Change vs. PY
% USD
% cc
9M 2025
9M 2026
Change vs. PY
% USD
% cc
Net sales
13,909
14,522
4
4
41,196
42,043
2
0
Core operating income
5,460
6,036
11
10
16,960
16,873
-1
-2
Core margin
39.3%
41.6%
+2.3%pts
+2.0%pts
41.2%
40.1%
-1.1%pts
-0.8%pts
Operating income2
4,501
1,843
-59
-61
14,028
10,828
-23
-24
Net income2
3,930
1,196
-70
-71
11,563
7,609
-34
-35
Core EPS (USD)
2.25
2.46
9
8
6.94
6.85
-1
-3
EPS (USD)2
2.04
0.63
-69
-70
5.94
4.01
-32
-33
Free cash flow
6,217
5,111
-18
15,941
14,002
-12
1. Constant currencies (cc), core results and free cash flow are non-IFRS measures. An explanation of non-IFRS measures can be found on page 45 of the Novartis Condensed Interim Financial Report. Unless otherwise noted, all growth rates refer to same period in PY. 2. Operating income, net income and EPS declined mainly due to the USD 1.9 billion partial impairment charge of the del-desiran IPR&D asset.
NOVARTIS
Novartis Q3 Results | October 27, 2026
19
Visuals: Sidebar: two small circular outline buttons at top left, one with a left arrow and one with a right arrow. The menu items are separated by thin light-grey horizontal lines; the 'Financial review' item has a light-grey highlight band with a vertical blue-to-orange gradient bar at its left edge. Table: light grey panel (#F2F2F2) with a thin vertical gradient strip on its left edge running from pale blue at top through pink to orange at bottom. Column groups: label column, Q3 2025, Q3 2026 (darker grey column highlight #DADADA), % USD, % cc, then 9M 2025, 9M 2026 (darker grey highlight), % USD, % cc. Black rule under the header row and thin grey rules between rows. Dotted vertical separator between % USD and % cc columns. Six orange (#FF5A1F) hand-drawn style oval outlines circle the values: Q3 % cc 4 (Net sales), 10 (Core operating income), +2.0%pts (Core margin), and 9M % cc 0, -2 (rows Net sales and Core operating income). Dark grey tab at top right with rounded left corner containing 'FINANCIAL PROFILE'. Novartis logo with flame/hands-and-drop symbol and the serif wordmark NOVARTIS at the bottom left. Table values are as given in the text. Free cash flow has no % cc values.
Slide 20
Content
Click below to navigate through the document
Company overview
Financial review
Conclusions
Appendix
References
FINANCIAL PROFILE
Continuing our shareholder-friendly capital allocation strategy
Investing in the business
Returning capital to shareholders
Investments in organic business
Ongoing investment in R&D and CapEx
Value-creating bolt-ons in Q3
Acquisition of Myricx (closed in Q3)
Exercised option for asset acquisition from Sironax
Substantial cash generation
Consistently growing annual dividend1
USD 9.1bn dividend paid in H1 2026
Share buybacks
Up to USD 10bn buyback continuing,
with up to USD 4.9bn still to be executed2
1. In CHF. 2. As of September 30, 2026.
NOVARTIS
Novartis Q3 Results | October 27, 2026
20
Visuals: Left sidebar with two circular outline arrow buttons (left and right arrows) at top. The Financial review menu item is highlighted by a light grey band with a vertical blue-to-orange gradient bar at its left edge. A dark grey tab with rounded top-left corner at the top right edge carries the section label. The main panel is light grey with a thin vertical gradient bar on its left edge running pale blue at top to orange at bottom. In the centre is a white circle with a dark grey outline (about 0.3% stroke) holding the text, with four dark grey filled dots on the circle at upper left, upper right, lower left and lower right. From each dot, a thin dark grey diagonal line leads outward to a horizontal thin dark grey rule that runs over the text block of the left or right column (top rules at the headings, bottom rules under the lower items). The Novartis logo is a flame-like drop symbol with the wordmark in serif capitals.
Slide 21
Content
Click below to navigate through the document
Company overview
Financial review
Conclusions
Appendix
References
FINANCIAL PROFILE
Raising Novartis 2026 full year core1 operating income guidance
Expected, barring unforeseen events; growth vs. PY in cc1
Net sales
expected to grow low single-digit
Core1 operating income
expected to be in line to grow low single-digit
(from low single-digit decline)
FY guidance on other financial KPIs
• Core net financial result: Expenses expected to be around USD 1.7bn
• Core tax rate: Expected to be around 16.5%
1. Constant currencies (cc) and core results are non-IFRS measures. An explanation of non-IFRS measures can be found on page 45 of the Novartis Condensed Interim Financial Report. Unless otherwise noted, all growth rates refer to same period in PY.
NOVARTIS
Novartis Q3 Results | October 27, 2026
21
Visuals: Two circular outline icons at top left of the sidebar, one with a left arrow and one with a right arrow. The sidebar has thin horizontal divider lines between menu items. The active item 'Financial review' has a light grey highlight band with a vertical gradient strip at its left edge (pale blue at top to orange at bottom). A thin vertical divider line separates sidebar from content. A dark grey tab with a rounded top-left corner holds 'FINANCIAL PROFILE' at the top right edge. Two KPI boxes with thin grey outlines and white backgrounds; each has a light grey (#F2F2F2) label panel on the left with a narrow vertical gradient strip at its left edge (pale blue top to orange-red bottom). A thin black vertical line sits to the left of the 'FY guidance' block. The Novartis logo (flame/droplet icon plus serif wordmark NOVARTIS) is at bottom left.
Slide 22
Content
Click below to navigate through the document
Company overview
Financial review
Conclusions
Appendix
References
FINANCIAL PROFILE
H2 with strengthened performance and accelerated quarterly sales growth
2026 growth vs. PY (cc)1
Illustrative
H1
H2
FY
Net sales
Mid to high single-digit
Low single-digit
-2
High single to low double-digit
Core1 operating income
-7
In-line to low single-digit
1. Constant currencies (cc) and core results are non-IFRS measures. An explanation of non-IFRS measures can be found on page 45 of the Novartis Condensed Interim Financial Report. Unless otherwise noted, all growth rates refer to same period in PY.
NOVARTIS
Novartis Q3 Results | October 27, 2026
22
Visuals: Sidebar: two circular outlined arrow buttons (left and right arrows) at top left. The 'Financial review' menu item is highlighted with a light grey band and a narrow vertical blue-to-orange gradient bar at the left edge. Thin light divider lines between menu items. Chart panel (illustrative bar chart): three columns H1, H2, FY separated by a dashed vertical black line (between H1 and H2) and a solid vertical black line (between H2 and FY). Two horizontal black baselines, one for Net sales (y about 49%) and one for Core operating income (y about 66%). Net sales: H1 dark grey bar (#4A4A4A) hanging just below the baseline with the label '-2' in a small dark box with white text; H2 mid-grey bar (#7F7F7F) above the baseline with label 'Mid to high single-digit' above; FY thin bright orange bar (#FF4F00) above baseline with label 'Low single-digit' above. Core operating income: H1 larger dark grey bar below baseline with white label '-7'; H2 taller mid-grey bar above baseline with label 'High single to low double-digit' above; FY very thin orange bar on baseline with label 'In-line to low single-digit' below. Panel left edge has vertical gradient strip from light blue at top through pink to orange at bottom. Novartis logo: flame/droplet-like icon with serif wordmark NOVARTIS in dark grey.
Slide 23
Content
Click below to navigate through the document
Company overview
Financial review
Conclusions
Appendix
References
FINANCIAL PROFILE
Expected currency impact for full year 2026 and 2027
Currency impact vs. PY
%pts, assuming late-October exchange rates prevail in 2026 and 2027
FX impact on Net sales
FX impact on Core1 operating income
4
2
0
-1
1
-1
Q1
Q2
Q3
Q4
FY
FY
2026
2027
2
0
1
0
1
0
Q1
Q2
Q3
Q4
FY
FY
2026
2027
Actual
Simulation
1. Core results are non-IFRS measures. An explanation of non-IFRS measures can be found on page 45 of the Novartis Condensed Interim Financial Report. Unless otherwise noted, all growth rates refer to same period in PY.
NOVARTIS
Novartis Q3 Results | October 27, 2026
23
Visuals: Two bar charts on a light grey panel with a thin vertical gradient strip (light blue at top to orange at bottom) on its left edge. Left chart, 'FX impact on Net sales': baseline with bars for Q1 to Q4, FY 2026 and FY 2027, separated by a vertical dashed line before the 2027 FY. Values: Q1 4 (dark grey bar), Q2 2 (dark grey), Q3 0 (no bar), Q4 -1 (orange bar below baseline), FY 2026 1 (orange bar above baseline), FY 2027 -1 (orange bar below baseline). Category labels in bold below, a horizontal line beneath them, and year labels '2026' and '2027' below. Right chart, 'FX impact on Core1 operating income': Q1 2 (dark grey), Q2 0, Q3 1 (dark grey), Q4 0, FY 2026 1 (orange), FY 2027 0, with a dashed vertical separator before the last FY, same labels and year grouping. Legend at bottom left: dark grey square 'Actual', orange square 'Simulation'. Sidebar: two circular outline arrow buttons (left and right) at top left, the 'Financial review' item highlighted with a light grey band and a blue-to-orange gradient bar on the left edge, thin divider lines between menu items. Novartis logo: flame-like hand symbol with serif wordmark NOVARTIS. Dark grey tab with rounded left corners at top right.
Slide 24
Content
Click below to navigate through the document
Company overview
Financial review
Conclusions
Appendix
References
Conclusions
Vas Narasimhan, M.D.
Chief Executive Officer
NOVARTIS
Visuals: Two small circular outline buttons at top left of the sidebar, one with a left arrow and one with a right arrow, thin black strokes. Thin light grey horizontal divider lines separate the menu rows, and a thin vertical line separates the sidebar from the main area. The active 'Conclusions' row has a light grey (#F5F5F5) band with a narrow vertical gradient tab at its left edge, blending from light blue to coral orange. Right side: full-bleed, edge-to-top-and-bottom studio portrait photo of a man, Vas Narasimhan, with short dark hair graying at the temples, a slight smile, looking at the camera, in a light blue checked collared shirt with open collar, against a mottled grey-blue backdrop; soft even studio lighting; framed from the shoulders up, head right of centre. Novartis logo: a small black flame/droplet-shaped symbol followed by the serif wordmark NOVARTIS in black capitals.
Slides 25 to 91 continue in the full text file.
Download this deck
The hosted PDF of every library deck is free for readers of the SlideDeck Co newsletter. Join with your email and the viewer and download appear here.
Preparing a results presentation or business update of your own? The SlideDeck Co Standard Deck is a slide library for business reviews, updates and plans.







