
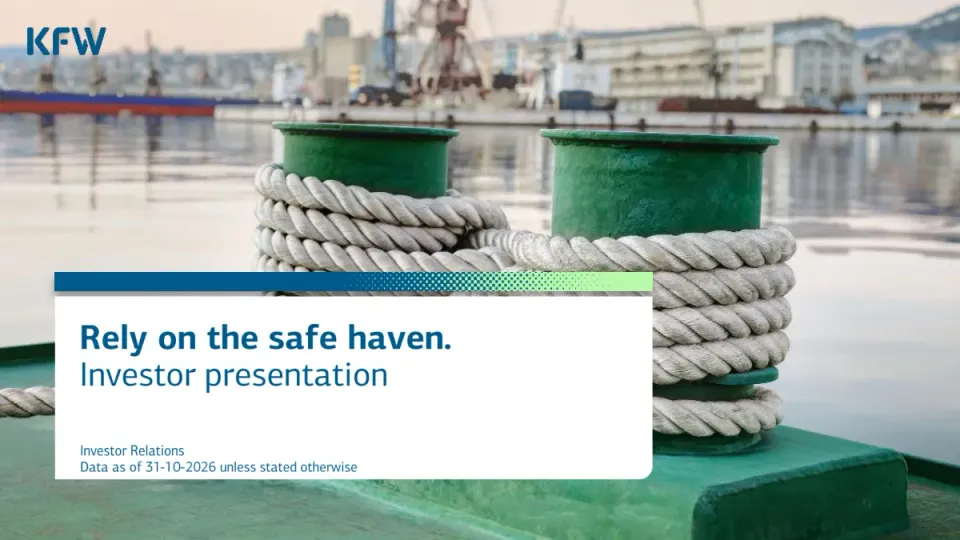
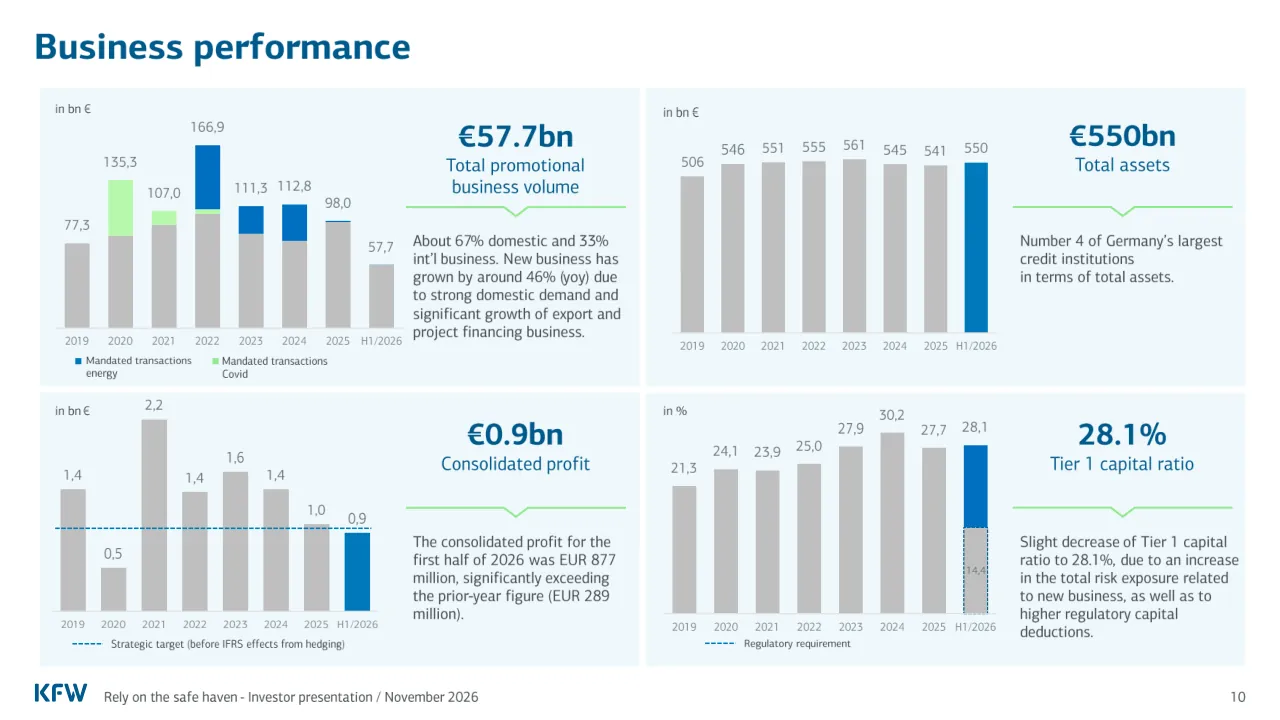
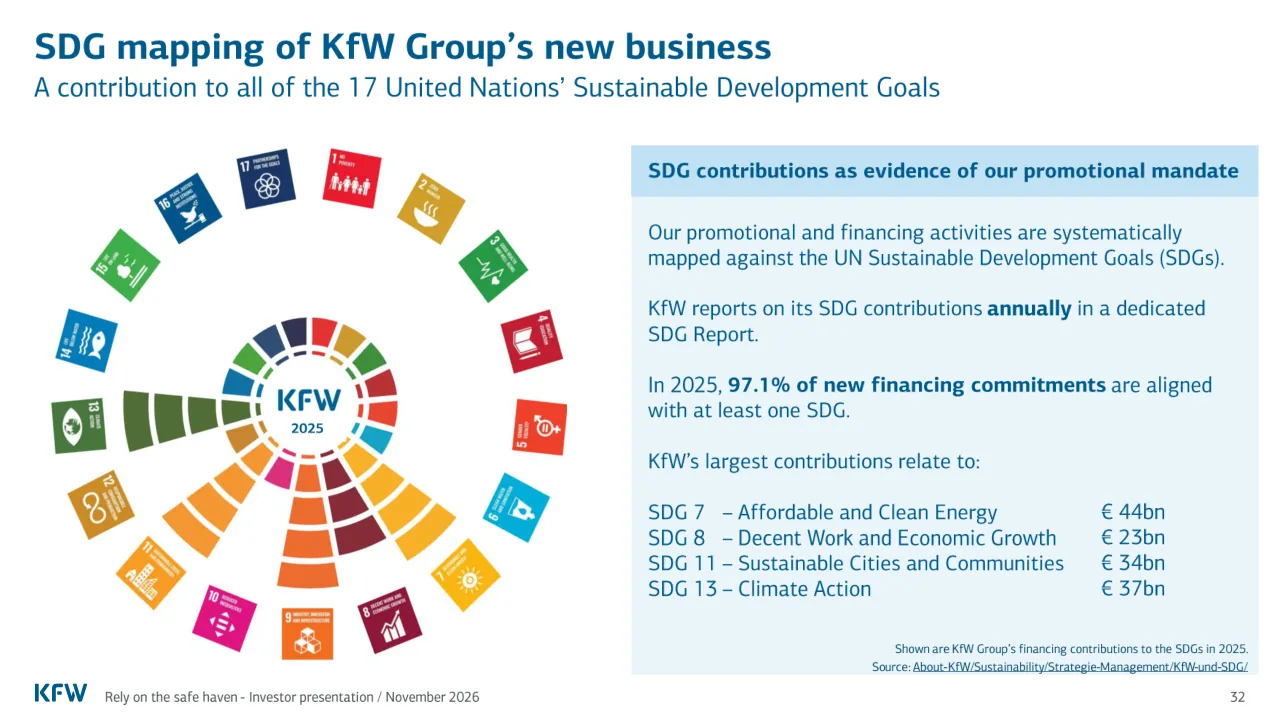
This deck is KfW's semi-annual investor presentation, dated November 2026 with data as of 31 October 2026. It opens with a disclaimer on US securities offers, followed by a table of contents. The business model section covers promotional volumes, the on-lending model, exposure by region and sector, and Frankfurt as a financial hub. Next, rating and funding cover the federal guarantee, financial and ESG ratings, and debt capital markets by currency and product. Later sections address sustainability, including SDG mapping, green bond allocation and impact, and digitalisation initiatives such as DLT-based bonds. The Germany Fund is also presented. The appendix contains the worldwide office network, liquidity portfolio, strategic holdings, key IFRS figures, Nordic and Asian funding, and sustainability governance. The deck closes with contact details and a photo credits slide. Several slides are dense tables of funding data and benchmark issues, serving as a reference for how an issuer lays out financial information. Slides 5 and 10 present key metrics as headline figures with short explanations, while slide 14 organises a long list of external ratings by agency and outlook.
Slides worth studying
Questions about this deck
How many slides does the KfW Bankengruppe investor presentation have?
The deck has 58 pages, as stated in the deck's details. Slide 3, the table of contents, lists the final section, Contact & References, as running from slides 56 to 58.
What does the KfW Bankengruppe deck say about its promotional business volume?
Slide 10 states a total promotional business volume of €57.7bn, with about 67% domestic and 33% international business. Slide 7 gives the same H1/2026 promotional business volume of EUR 57.7bn.
What credit ratings does the KfW Bankengruppe deck show?
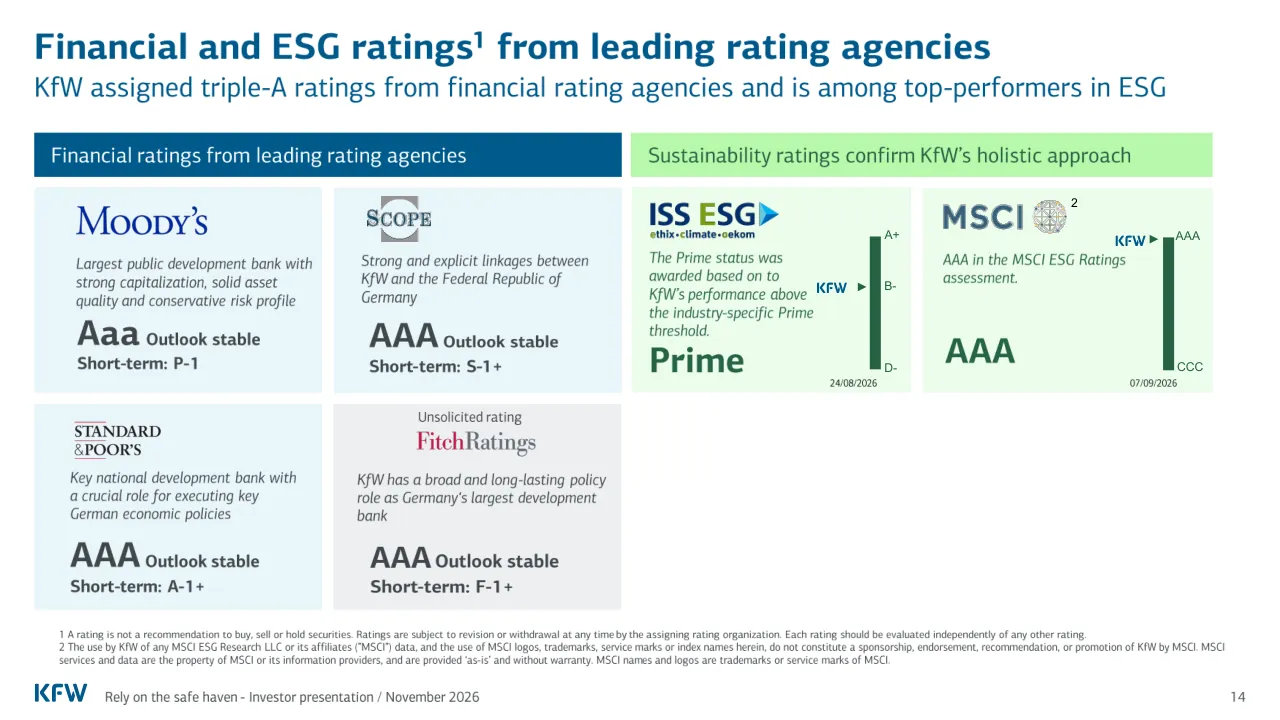
Slide 14 lists Moody's at Aaa, S&P at AAA, Fitch at AAA and Scope at AAA, each with a stable outlook. The same slide also shows the MSCI ESG rating of AAA.
How is the KfW Bankengruppe investor presentation structured?
Slide 3 sets out seven sections: Business Model (slides 4 to 11), Rating and Funding (slides 12 to 30), Commitment to Sustainability (slides 31 to 37), Digitalisation Initiatives (slides 38 to 40), The Germany Fund (slides 41 to 43), Appendix (slides 44 to 55), and Contact & References (slides 56 to 58).
Details
- Company: KfW Bankengruppe
- Year: 2026
- Type: Investor presentation
- Industry: Public development bank / Financial services
- Pages: 58
Review score: 7 out of 10, Effective
Presentation quality, judged with the SlideDeck Co review heuristic. Ask, evidence and idea merit are not rated here.
The deck has a consistent identity, a clear contents page with slide ranges, section dividers and a logical route from business model to funding, sustainability, digitalisation and appendix. The readable slides (10, 14, 32) are well built: slide 10 pairs four charts with headline figures and one-line explanations, and slide 14 groups ratings by agency with the key grade in bold. The weaknesses are consequential: the long funding run (slides 19 to 27) repeats a dense chart-plus-table layout with tiny table text and rotated bond labels, slide 15 is crowded, and slide 35 has a broken footer and slide 50 a jumbled chart legend. Many pages are reference-grade rather than designed to be read live, and the five section dividers (4, 12, 31, 38, 41) add little.
Worth keeping: Keep the headline-figure-plus-chart structure of slide 10, the grouped rating layout of slide 14, the contents page with slide ranges, and the consistent blue and green identity with the repeating flag tiles (Total EUR, USD, GBP) on the benchmark pages.
Most useful repair: Enlarge or cut the small table text and rotated x-axis labels on slides 19 to 27 and 50, clean up the footer on slide 35 and the legend on slide 50, and thin the crowded slide 15.
What would change the score: I would add a takeaway headline to the repeated funding pages and a short summary slide for the live audience, moving the full tables to the appendix.
Confidence medium. 58 of 58 pages inspected on contact sheets, 4 at readable size. Reviewed 2026-11-08. Model-assisted review (claude-sonnet-5-5).
Full text of the slides (58 slides)
Every slide's words and a description of its charts and images, so the deck can be searched and rebuilt. Also available as Markdown.
Slide 1
KFW
Rely on the safe haven.
Investor presentation
Investor Relations
Data as of 31-10-2026 unless stated otherwise
Visuals: Photograph: a harbour scene shot at dusk-like soft daylight. In the foreground are two green painted mooring bollards (cleats) wrapped with thick off-white/grey twisted rope, the larger one at right and a second at left-centre, seen from a low angle with a green quay surface in the lower foreground. Behind them is calm grey-blue water reflecting the quay, with a blurred port: a red-and-blue ship hull at far left, red and grey cranes, pale beige and white multi-storey buildings, and hazy hills under a pale peach sky at top. Composition is full-bleed with the bollards occupying the centre and right; the lower half is covered by the white panel. Lighting is soft and diffuse. Dominant colours: green (#2E7D5B-ish), grey-white rope, pale blue-grey water, peach-beige sky. The photo is not tinted or overlaid, but the white panel and accent bar sit over it. Logo: KFW wordmark in dark blue (#00609C-ish) at top-left. Accent bar: a horizontal band across the top of the white panel, dark blue (#00609C) on the left, transitioning through a halftone dot pattern to light mint green (#B4F5A0) at the right end, with a faint drop shadow beneath its left part.
Slide 2
Disclaimer (Haftungsausschluss)
The information contained in this document does not constitute an offer of securities for sale in the United States. Securities may not be offered or sold in the United States absent registration or an exemption from registration. Any offering of securities in the United States will be made by means of a prospectus that may be obtained from KfW and will contain detailed information about KfW and its management, financial statements and information about the Federal Republic of Germany.
Die in diesem Dokument enthaltenen Informationen stellen kein Angebot zum Kauf von Wertpapieren in den USA dar. Wertpapiere dürfen in den USA nur mit vorheriger Registrierung oder ohne vorherige Registrierung nur aufgrund einer Ausnahmeregelung verkauft oder zum Kauf angeboten werden. Ein Angebot zum Kauf von Wertpapieren wird in den USA nur auf Grundlage eines Prospekts erfolgen, der von der KfW zur Verfügung gestellt wird und detaillierte Informationen über KfW, ihre Geschäftsleitung, ihre Jahresabschlüsse sowie Informationen über die Bundesrepublik Deutschland enthalten wird.
Rely on the safe haven - Investor presentation / November 2026
2
Slide 3
Table of contents
01
Business Model
→ slides 4 to 11
02
KfW Rating and Funding at KfW: Capital & Money Markets
→ slides 12 to 30
03
Commitment to Sustainability
→ slides 31 to 37
04
Digitalisation Initiatives
→ slides 38 to 40
05
The Germany Fund
→ slides 41 to 43
06
Appendix
→ slides 44 to 55
07
Contact & References
→ slides 56 to 58
Rely on the safe haven - Investor presentation / November 2026
3
Visuals: None apart from the seven navy section bars, their green number discs and the small white right-pointing arrows in front of each slide range; there are no photographs, charts or diagrams. Each bar carries a numbered disc (01 to 07) at its left end and a link with a Wingdings arrow and underlined range text at its right end. The KfW logo sits in the footer at bottom left.
Slide 4
KfW
Business Model
Table of contents
Visuals: Full-bleed decorative background: a dark-to-mid blue halftone texture. The left third is almost flat dark blue. From about x 25% to the right edge, a regular grid of small square dots in a slightly lighter blue fades in and grows denser toward the right edge, forming a checkerboard-like pattern. No photograph, chart, diagram or logo. Two very small 2 by 2 pixel image tiles are placed at x 5.7%, y 49.4% and x 5.7%, y 39.7%, behind the title text, and a third at x 76.5%, y 6.3% behind the header label; they read as flat colour and have no visible content of their own.
Slide 5
KfW at a glance
Our Legacy
KfW established in 1948
Shareholders: Federal Republic (80%)
& federal states (20%)
Our People & Network
>8,000 employees
Represented in over 80 offices worldwide
Our Business
Germany
KfW
KfW CAPITAL
SMEs
Private clients
Municipalities, LFI, companies
Start-ups & Future Fund
International
KfW IPEX-Bank
KfW
KfW DEG
Export & project finance
Developing & emerging economies
Strengthening competitiveness
The digital transformation & promotional bank by 2030
& resilience
Our Key Financials
(2025)
€98bn
New business
AAA
Rating
€40.6bn
Equity
27.7%
Capital ratio
€1.0bn
Consolidated profit
Our Focus
Globalisation
Social change
Climate & environment
Trend-independent promotion topics
Digitalisation & innovation
Our Products
Grants
Strategic holdings
Promotional loans
Commercial loans
Other
Rely on the safe haven - Investor presentation / November 2026
5
Visuals: Four icon-and-label rows and two diagrams. (1) Our Business: a boxed organisation table with a dark blue header bar 'Germany' over a row with KfW (light blue-white cell, #E9F5FB) and KfW CAPITAL (pale blue cell); below, a row of four blue line icons with labels SMEs (cloud over factory), Private clients (house with people), Municipalities, LFI, companies (building with office blocks), Start-ups & Future Fund (rocket); then a dark green header bar 'International' over cells KfW IPEX-Bank (very pale green) and KfW DEG with KfW (light green), followed by green icons Export & project finance (euro coin) and Developing & emerging economies (globe). (2) Central diagram: concentric circles, pale green ring carrying curved text Strengthening competitiveness above and & resilience below, enclosing a dark blue disc with KfW wordmark in white and the text The digital transformation & promotional bank by 2030. (3) Our Key Financials: six blue figures with grey captions, no chart axes: €98bn New business, AAA Rating, €40.6bn Equity, 27.7% Capital ratio, €1.0bn Consolidated profit. (4) Our Focus: a horizontal row of five circular icons joined by a thin grey line: solar panel with sun on dark green (#398357) labelled Climate & environment; globe on bright green (#57D96D) labelled Globalisation; shuffle arrows on light green (#B7F9AA) labelled Trend-independent promotion topics; people group on pale green (#D4FCCA) labelled Social change; gear with circuit on very pale green (#ECFDED) labelled Digitalisation & innovation. (5) Our Products: a row of five circular icons joined by a thin grey line: house with euro sign on navy (#00446E) labelled Promotional loans; hand with plant on dark blue (#005A8C) labelled Grants; coin stacks on bright blue (#007ABC) labelled Commercial loans; handshake on light blue (#97CFED) labelled Strategic holdings; hand with pen-like tool on pale blue (#D1EBF7) labelled Other. (6) KfW wordmark logo bottom-left, dark blue.
Slide 6
Transformation agenda ‘KfWplus’ / Strengthening competitiveness & resilience / Climate & / environment / Digitalisation & / innovation / Managing impact & / mobilising private / capital / Customer / Top-performing KfW / 1. Making a difference, / together. / 3. Digitalisation & AI / 2. Employee / potential / 4. Business & / operating model, / and governance / The digital / transformation / & promotional / bank / KfW / Rely on the safe haven - Investor presentation / November 2026 / 6 / 6
Visuals: Illustrated quadrant diagram. A circle is divided into four quarter segments by a navy cross. Top-left quadrant is light green (#CCF5C8) with a flat illustration of green trees, a grey trunk, white and grey clouds and a yellow sun over a dark green hill, labelled Climate & environment. Top-right quadrant is light blue (#9ACFEB) with a white robotic arm on a blue cloud (#0A6DB5) beside a small navy dashboard with green and white bar chart, labelled Digitalisation & innovation. Bottom-left quadrant is light grey (#D0D3D9) with a stack of grey and white euro banknotes (one marked €), a circular arrow loop and a stack of grey coins with a euro coin, labelled Managing impact & mobilising private capital. Bottom-right is a light blue box (#D4ECF7) titled Top-performing KfW with four numbered items: 1 Making a difference together with two cartoon people and a hex-shaped cluster, 3 Digitalisation & AI with a laptop showing a document and sparkles, 2 Employee potential with a raised arm and a dark blue disc, 4 Business & operating model, and governance with a flag and rising bar chart in blues. A thick blue (#0A6DB5) curved arc runs around the outside of the wheel and carries the heading Strengthening competitiveness & resilience. A blue arrow points up and right toward the white circle. The arcs and arrow are flat with rounded ends and no shadows.
Slide 7
KfW’s business activities
Promotional business volume H1/2026: EUR 57.7bn
Domestic
SME Bank & Private Clients
Standardized financing products for SMEs, / business founders, start-ups, self-employed / professionals and private individuals
56%
Customized Finance & Public / Clients
Individual financings for municipal & social / infrastructure, customized financing for FI & / promotional institutions of German federal states
10%
KfW Capital
Subsidiary (100%, est. 2018) to invest in / German and European venture capital (VC) and / venture debt funds
KfW CAPITAL
1%
International
Promotion of Developing / Countries & Emerging Economies
KfW’s public (KfW Development Bank) & private / sector activities (DEG) in developing countries
7%
Export & Project Finance / (KfW IPEX Bank)
Subsidiary (100%, est. 2007) for exports and / project & corporate financing world-wide
IPEX-Bank
26%
KfW Group’s Environment / investment ratio / (H1/2026)
58%
New original business for environment and climate protection / in % of total new business volume 2026 adjusted for special / mandates.
KfW Group’s Domestic / SME ratio / (H1/2026)
45%
New original business for SMEs in % of total new domestic / business volume in 2026 adjusted for special mandates.
Rely on the safe haven - Investor presentation / November 2026
7
Visuals: Five photographs and five donut charts, plus two KPI tiles and two logos. Photos: (1) SME cell, bottom-left: solar panels on a red-tiled roof under a pale blue sky, cropped rectangle, daylight, blue and red dominant. (2) Customized Finance cell: overhead view of an open-plan office with people at round tables and green plants, cropped rectangle, bright neutral light, white, beige and green dominant. (3) KfW Capital cell: three business people at a white flipchart, one woman in the centre, two men in dark suits, indoor soft light, grey, white and dark navy dominant. (4) Developing countries cell: a young girl in a pink-and-white striped dress pumping water from a concrete well in a courtyard with a pink wall and blue curtain, daylight, pink and grey dominant. (5) Export cell: a red-hulled container ship moored beside a glass-fronted port building under a blue sky, daylight, red, teal and blue dominant. Donut charts, all with a white ring, grey outline and light green (#B7F9AA) arc equal to the printed share, with the percentage printed in the centre in bold Arial #41484C: SME Bank 56% (green arc about 56% of ring, starting at 12 o'clock clockwise); Customized Finance 10%; KfW Capital 1%; Developing Countries 7%; Export & Project Finance 26%. KPI tiles: 'KfW Group’s Environment investment ratio (H1/2026)' with value 58%, and 'KfW Group’s Domestic SME ratio (H1/2026)' with value 45%, each a light green box with bold dark blue label and a green value box. Logos: KfW CAPITAL wordmark in bold dark blue KfW with smaller CAPITAL beside it, and KfW IPEX-Bank wordmark in bold dark blue KfW with smaller IPEX-Bank beside it; KfW logo in footer. No other visuals.
Slide 8
Proven and successful business model
KfW involves commercial banks in its domestic activities (on-lending model)
Liquidity management
KfW
BANK
Lender
Financing partner
Final borrower
The claim of the house bank against the final
borrower is assigned/ceded to KfW as collateral
Funding
KfW
Rely on the safe haven - Investor presentation / November 2026
8
Visuals: Diagram (one illustration, roughly 82% of slide width, placed at x 6.4%, y 21.6%). Left part: a dark blue (#00578A) globe with light blue-grey (#9FC3D9) continents, wrapped by two light grey (#D6DCE0) curved block arrows forming a circular cycle. Above the globe are stacked coins: a green (#3D8054) pound coin, a dark green euro coin and a light green (#8FE38A) dollar coin, labelled 'Liquidity management' in green text. Below the globe are similar stacked coins (pound, euro, light green dollar) labelled 'Funding'. To the left of the globe sit a dark green server/tower block with white horizontal slots, a second smaller dark green server, and a light green house with four white windows. Centre: a tall rounded dark blue (#00578A) rectangle with three white horizontal bars and the white bold text 'KFW' at its base. A light grey (#D6DCE0) block arrow points right to a white-backed square containing a dark blue (#00578A) house-shaped 'BANK' icon with white bold capitals and a small light blue chimney tab at its top right; a second light grey arrow points right to the borrower illustration. Right part: a light blue (#55B0E6) house with four white windows, a dark green wind turbine with light green curved motion arcs, a light green sun over a dark green solar panel, a dark green pine tree and a light green round bush at the lower left. Bottom: a dark green (#3D8054) thick U-shaped arrow runs from beneath the 'Final borrower' bar, along the bottom, and up into an upward-pointing arrowhead under the 'Lender' bar. The arrow is solid, with no shadows or gradients. Labels 'Lender', 'Financing partner' and 'Final borrower' sit in three dark blue (#00578A) rectangular bars with white bold text, and the caption in dark grey bold text sits inside the U of the arrow. No photographs.
Slide 9
Allocation of economic capital for credit risk / Business model focuses strongly on Germany and the financial industry / By region / 2025 / 33% / 23% / 5% / 9% / 3% / 10% / 6% / 11% / Germany / Euro-area countries (excl. Germany) / EU countries (excl. euro-area countries and Germany) / Europe outside EU / Africa / Asia (incl. Australia and New Zealand) / Latin America / North America / Exposure to Germany: / 33% / By sector / 2025 / 38% / 15% / 6% / 9% / 9% / 8% / 4% / 11% / Banking sector / Industrial sector / Retail sector / Non-basic consumer goods / Utility companies / Financial sector / No sector focus / Other / Exposure to banking sector: / 38% / KFW / Rely on the safe haven - Investor presentation / November 2026 / 9
Visuals: Two doughnut charts with white separator lines between segments, no axes, no legend-embedded title. Left chart titled 'By region', subtitle '2025', centre of ring at about x 20.7%, y 47.5%. Segments clockwise from 12 o'clock with labelled values: Germany 33%, Euro-area countries (excl. Germany) 23%, EU countries (excl. euro-area countries and Germany) 5%, Europe outside EU 9%, Africa 3%, Asia (incl. Australia and New Zealand) 10%, Latin America 6%, North America 11%; values sum to 100%. Right chart titled 'By sector', subtitle '2025', centre at about x 65.5%, y 47.5%. Segments clockwise from 12 o'clock: Banking sector 38%, Industrial sector 15%, Retail sector 6%, Non-basic consumer goods 9%, Utility companies 9%, Financial sector 8%, No sector focus 4%, Other 11%; values sum to 100%. Legends are square swatches with labels, one per row. No highlighted points beyond the Germany and banking segments referenced by the KPI boxes. Two KPI callouts: 'Exposure to Germany:' with value 33%, and 'Exposure to banking sector:' with value 38%, each a navy box with white bold label next to a pale green box with dark green bold value.
Slide 10
Business performance
in bn €
77,3
135,3
107,0
166,9
111,3
112,8
98,0
57,7
2019
2020
2021
2022
2023
2024
2025
H1/2026
Mandated transactions energy
Mandated transactions Covid
€57.7bn
Total promotional business volume
About 67% domestic and 33% / int'l business. New business has / grown by around 46% (yoy) due / to strong domestic demand and / significant growth of export and / project financing business.
in bn €
506
546
551
555
561
545
541
550
2019
2020
2021
2022
2023
2024
2025
H1/2026
€550bn
Total assets
Number 4 of Germany’s largest / credit institutions / in terms of total assets.
in bn €
1,4
0,5
2,2
1,4
1,6
1,4
1,0
0,9
2019
2020
2021
2022
2023
2024
2025
H1/2026
Strategic target (before IFRS effects from hedging)
€0.9bn
Consolidated profit
The consolidated profit for the / first half of 2026 was EUR 877 / million, significantly exceeding / the prior-year figure (EUR 289 / million).
in %
21,3
24,1
23,9
25,0
27,9
30,2
27,7
28,1
14,4
2019
2020
2021
2022
2023
2024
2025
H1/2026
Regulatory requirement
28.1%
Tier 1 capital ratio
Slight decrease of Tier 1 capital / ratio to 28.1%, due to an increase / in the total risk exposure related / to new business, as well as to / higher regulatory capital / deductions.
KFW
Rely on the safe haven - Investor presentation / November 2026
10
Visuals: Four bar charts, all with grey (#BFBFBF) bars and a single highlighted bar for H1/2026. Chart 1 (top left): stacked bar chart titled by the KPI Total promotional business volume, axis unit in bn €, no visible numeric axis, bars for 2019 to H1/2026 with printed totals 77,3 / 135,3 / 107,0 / 166,9 / 111,3 / 112,8 / 98,0 / 57,7. Grey base segments; 2020 has a light green #B7F9AA Covid segment on top, 2021 a small green segment, 2022 a large blue #0070C0 energy segment plus small green, 2023 and 2024 blue energy segments, 2025 a thin blue segment. Legend below: blue square Mandated transactions energy; light green square Mandated transactions Covid. Chart 2 (top right): simple column chart titled Total assets, unit in bn €, values 506 / 546 / 551 / 555 / 561 / 545 / 541 / 550, H1/2026 bar in blue #007ABC, others grey. Chart 3 (bottom left): column chart in bn €, values 1,4 / 0,5 / 2,2 / 1,4 / 1,6 / 1,4 / 1,0 / 0,9 for 2019 to H1/2026, H1/2026 bar blue #007ABC, others grey; a horizontal dashed blue line (#007ABC, about 1 pt) crosses the chart at about the level of the 0,9 bar top with no value printed; legend dashed blue line Strategic target (before IFRS effects from hedging). Chart 4 (bottom right): column chart in %, values 21,3 / 24,1 / 23,9 / 25,0 / 27,9 / 30,2 / 27,7 for 2019 to 2025 in grey, H1/2026 split: blue #0070C0 top segment labelled 28,1 above, and a lower grey segment with dashed outline labelled 14,4 inside; a dashed blue horizontal reference line in legend Regulatory requirement. KFW logo in dark blue bold sans wordmark at bottom left.
Slide 11
KfW supports and operates in the European financial center Frankfurt
World-leading commercial internet hub
DE-CIX Frankfurt – the world's leading commercial internet node in the heart of Europe
16 terabits per second peak, access in over 30 data centers, cloud exchange with over 50 cloud service providers
Central Hub and economic growth motor in Europe
Frankfurt airport amongst 5 largest airports in Europe
FrankfurtRheinMain metropolitan region, with nearly 6 million inhabitants, is the second largest economic area in Germany
Börse Frankfurt amongst 3 largest stock exchanges in Europe
Home to German & European regulatory authorities
ISSB
ESRB
EIOPA
BaFin
ECB
GLEIF
FMSA
Bundesbank
AMLA
KFW
Rely on the safe haven - Investor presentation / November 2026
11
Frankfurt – key KPIs
781,337
Residents
89,366
Bank employees
For >800 years globally known as trade fair location
249,096
Students
44
Research institutes
280
Banks and Credit Institutions
Visuals: One circular photograph of the Frankfurt skyline, centred at about x 37.7 y 32.7 w 22.9 h 41.5 percent. Subject: a dense cluster of high-rise office towers (glass and concrete, several tall slender towers in the centre and right) rising above a lower foreground of older mid-rise residential buildings with pitched roofs and a few trees in spring leaf. Composition: wide view from an elevated position, skyline occupying the upper-middle of the circle, the rooftops in the lower third; the image is cropped to a circle with a thin dark grey outline of about 0.75 pt. Lighting: soft, diffuse daylight under a pale hazy sky. Dominant colours: pale blue-grey sky (#C9D6E2), grey-beige concrete, muted green tree tones, and steel-blue glass. No overlay or tint. Also: a KfW wordmark logo at the footer, and a set of KPI icons in the lower right: a house with people figures (dark blue #00517F roof outline with light blue #3E9BD6 figures) above 781,337; a person seated at a desk with a laptop (dark blue head and body, light blue #3E9BD6 laptop) above 89,366; a globe with a pencil (dark blue globe with light blue accent) above the >800 years text; a graduation cap with a book (dark blue #00517F, light blue tassel) above 249,096; a magnifying glass over a line chart with nodes (dark blue handle, light blue arrows) above 44; a dark blue rectangular tile (#00517F) with a light blue euro coin badge, a building outline and a small house icon above 280. No other charts, tables or diagrams.
Slide 12
Table of contents
KfW Rating and Funding
Capital and Money Markets
Visuals: A halftone pattern of small square dots fills the right side of the slide. The dots are darker navy squares on a slightly lighter blue ground, with the density highest at the right edge and fading to nothing toward the left, where the ground is plain. No photograph, illustration, chart, logo or icon.
Slide 13
Guarantee from the / Federal Republic of Germany
Guarantee established in 1998
Defined by law
Direct, explicit and unconditional
§1a of the Law concerning KfW
The Federal Republic guarantees all obligations of KfW in respect of loans extended to and debt securities issued by KfW, fixed forward transactions or options entered into by KfW and other credits extended to KfW as well as credits extended to third parties inasmuch as they are expressly guaranteed by KfW.
KfW
Rely on the safe haven - Investor presentation / November 2026
13
Visuals: One photograph and three small line icons. Photograph: the Reichstag building in Berlin seen from the front at a low angle, centred slightly left. The glass dome is at upper left, the pediment with sculptural relief is centred, the inscription 'DEM DEUTSCHEN VOLKE' is on the frieze above the columns, and a row of stone columns rises above people on the steps. A German flag hangs on a pole at right and a partial flag appears at the far left edge. Daylight with a clear pale blue sky; dominant colours are sky blue #8FC3E0, sandstone beige #B9AE98, glass grey #7D8A90 and black flag stripes. The photo is full-bleed and not cropped in a box, with no overlay or tint. Icons: (1) a padlock in a filled blue circle #005A8C, white glyph; (2) a graduation cap in a filled grey circle #6D6E71, white glyph; (3) a clipboard with a check mark in a filled green circle #3A8A3F, white glyph. A thin grey horizontal rule #8C8C8C, about 1 px, runs across the right panel below the bullets.
Slide 14
Financial and ESG ratings¹ from leading rating agencies / KfW assigned triple-A ratings from financial rating agencies and is among top-performers in ESG / Financial ratings from leading rating agencies / Sustainability ratings confirm KfW’s holistic approach / Largest public development bank with strong capitalization, solid asset quality and conservative risk profile / Aaa Outlook stable / Short-term: P-1 / Strong and explicit linkages between KfW and the Federal Republic of Germany / AAA Outlook stable / Short-term: S-1+ / Key national development bank with a crucial role for executing key German economic policies / AAA Outlook stable / Short-term: A-1+ / Unsolicited rating / KfW has a broad and long-lasting policy role as Germany‘s largest development bank / AAA Outlook stable / Short-term: F-1+ / The Prime status was awarded based on to KfW’s performance above the industry-specific Prime threshold. / KFW / A+ / B- / D- / Prime / 24/08/2026 / AAA in the MSCI ESG Ratings assessment. / KFW / AAA / CCC / 07/09/2026 / 2 / 1 A rating is not a recommendation to buy, sell or hold securities. Ratings are subject to revision or withdrawal at any time by the assigning rating organization. Each rating should be evaluated independently of any other rating. / 2 The use by KfW of any MSCI ESG Research LLC or its affiliates (“MSCI”) data, and the use of MSCI logos, trademarks, service marks or index names herein, do not constitute a sponsorship, endorsement, recommendation, or promotion of KfW by MSCI. MSCI services and data are the property of MSCI or its information providers, and are provided ‘as-is’ and without warranty. MSCI names and logos are trademarks or service marks of MSCI. / Rely on the safe haven - Investor presentation / November 2026 / 14
Visuals: Logos: Moody's wordmark in dark navy serif capitals (x 6.0, y 28.7, w 10.3, h 3.9); Scope logo, a grey square box with the word SCOPE in dark serif capitals (x 28.7, y 27.3, w 4.9, h 6.3); Standard & Poor's wordmark in black serif capitals with a thin red rule (x 5.8, y 58.5, w 6.7, h 5.3); Fitch Ratings logo with 'Fitch' in crimson #C8102E and 'Ratings' in grey (x 32.5, y 60.0, w 9.3, h 3.5); ISS ESG logo with 'ISS' and 'ESG' in navy and green plus a blue arrow and the tagline 'ethix · climate · oekom' (x 50.2, y 27.1, w 11.1, h 6.8); MSCI logo in grey-blue letters with a globe icon and a small superscript 2 (x 73.2, y 26.9, w 10.3, h 5.9). Chart in ISS card: vertical dark green bar #266446 (x about 67.9 to 68.8, y about 32.9 to 51.3) with scale labels A+ at top, B- at middle and D- at bottom (ordinal rating scale, no numeric values); KFW marker logo with a small blue arrow pointing to the bar at about the B- level (x 63.7 to 67.3, y 39.5 to 41.5). Chart in MSCI card: vertical dark green bar #266446 (x about 90.9 to 91.7, y about 32.9 to 51.3) with labels AAA at top and CCC at bottom; a KFW logo with blue arrow pointing to the top AAA level (x 87.1 to 90.5, y 32.6 to 34.2). No legend, no highlighted points beyond the KFW markers. Footer KfW logo: dark blue #005A8C bold sans wordmark (x 2.7, y 94.5, w 4.1, h 3.0).
Slide 15
Capital markets / SSA market / #2 in the SSA segment / Expected funding volumes 2026 in / € billion / Rentenbank 11 / NRW.Bank 15-17 / KfW 80-85 / EU 180 / EIB 60 / IBRD 44-53 / ADB 36 / ESM/EFSF 25 / IDB 17 / IFC 18-26 / IADB 17 / BNG 15-17 / EBRD 16 / Our USPs / Credit risk of the Federal Republic with yield pick-up vs Bunds – even in non-euro currencies (surrogate to Bund) / Liquidity of our bonds / Currency & product diversity / Relevance / Green bonds 17.5% / €433 billion / One of the largest and most active bond issuers worldwide / Funding volume 2025: €71bn / Outstanding KfW bonds & SSD at end of 2025 / Credit ratings – Aaa / AAA / AAA / KfW / Guarantee / Institutional liability / Risk weight 0% / Sustainability ratings – Prime / AAA / Green bonds / Active for more than 10 years / Among the top 5 issuers worldwide / In 2026, KfW exceeded the €100 billion mark in total KfW green bonds issued / Digitalisation / KfW makes an important contribution to shaping the digital financial market as an active bond issuer and investor / Strengthening Europe's digital sovereignty, e.g., European Regulated Layer One (RL1) initiative, ECB-AG Pontes / Currency diversity / In 2025, KfW issued bonds in 10 currencies / 58% / 24% / 10% / 8% / EUR / USD / GBP / AUD HKD NOK / CHF SEK CNY / DKK / Rely on the safe haven - Investor presentation / November 2026 / 15
Visuals: Chart: horizontal bar chart titled Expected funding volumes 2026 in € billion, placed top-centre-left under the SSA market heading. Categories top to bottom: Rentenbank 11; NRW.Bank 15-17; KfW 80-85 (highlighted in dark navy #005A8C, bar is the only dark bar); EU 180; EIB 60; IBRD 44-53; ADB 36; ESM/EFSF 25; IDB 17; IFC 18-26; IADB 17; BNG 15-17; EBRD 16. Bars are light blue #97CFED with bold dark labels at bar ends; category labels right-aligned in grey #41484C; vertical baseline axis line in dark grey; no visible axis tick values, value labels printed at bar ends. Bar length scale is proportional to value, with EU 180 the longest bar. Legend: none. Photos: six square-cropped photographs in a 2-row grid, bottom-left of the slide, boxed with square corners and no border: (1) offshore wind turbines against a dusk sky shaded blue to orange; (2) a white and beige multi-storey apartment building with a red-tiled roof and green trees under a blue sky; (3) a yellow and black tram on a street lined with dark trees, seen from the side; (4) a ring-tailed lemur sitting on a branch with a soft green background; (5) a worker in a blue shirt installing dark blue solar panels on a roof. Icon grid: a 2-column, 3-row cluster of small square UN Sustainable Development Goals icons (about six visible) with colours yellow, orange, red, dark green, blue and green, to the right of the tram photo. Logos: KfW wordmark in white inside the central navy circle; KfW wordmark in navy at bottom-left. Diagram: a circular text ring with a light green band around a navy disc, the top arc reads Credit ratings – Aaa then AAA and AAA, the bottom arc reads Sustainability ratings – Prime then AAA. Donut chart titled Relevance: outer ring with navy #005A8C segment (82.5%) and light green #D4FCCA segment (Green bonds 17.5%) at top right of ring; centre label €433 billion; caption Outstanding KfW bonds & SSD at end of 2025. Currency bar chart titled In 2025, KfW issued bonds in 10 currencies: a single 100% horizontal stacked bar with segments EUR 58% (navy #005A8C, label white), USD 24% (light blue #97CFED, label navy), GBP 10% (pale green #B7F5A4, label navy), and 8% (bright green #5BD46B, label navy) which stands for AUD HKD NOK CHF SEK CNY DKK; category names EUR, USD, GBP below segments and the grouped list beside the last segment. Lines: thin grey diagonal lines from the central ring to the four panel corners and a vertical grey divider at the slide centre.
Slide 16
Strong presence in DCM / DCM funding / in billion euros / 82,6 / 89,4 / 90,2 / 78,0 / 71,0 / 83,8 / 5,4 / 5,4 / 5,4 / 5,1 / 4,7 / 5,2 / 16,2 / 10,6 / 12,9 / 12,2 / 14,0 / 21,4 / 2021 / 2022 / 2023 / 2024 / 2025 / 2026 / (YTD) / Green Bonds / Average duration in years / KFW / Rely on the safe haven - Investor presentation / November 2026 / 16 / EUR 80-85bn / Funding target for 2026 / Total funding volume expected at EUR 80-85bn / Up to EUR 15bn funding via Green Bonds with continued focus on EUR market / Refinancing strategy for 2026 continues unchanged: / EUR and USD remain our core refinancing currencies / Currency diversification upon investor demand, e.g. new growing markets like HKD
Visuals: Chart: vertical stacked column chart with a secondary line overlay, titled 'DCM funding in billion euros' (white text on navy). Bars are light blue #97CFED (total DCM funding, values printed above each bar, in billion euros) with light green #B7F9AA segments at the base (Green Bonds, values printed inside each segment). Categories on the horizontal axis: 2021, 2022, 2023, 2024, 2025, 2026 (YTD). Values: 2021 total 82,6 with Green Bonds 16,2; 2022 total 89,4 with Green Bonds 10,6; 2023 total 90,2 with Green Bonds 12,9; 2024 total 78,0 with Green Bonds 12,2; 2025 total 71,0 with Green Bonds 14,0; 2026 (YTD) total 83,8 with Green Bonds 21,4. No y-axis or gridlines are printed; the value scale is about 0 to 95 billion euros implied by bar heights (estimate). A thin white baseline runs under the bars. Line series 'Average duration in years' in dark blue #005A8C, drawn across the green segments with white rounded-oval callouts containing the printed values: 5,4 (2021), 5,4 (2022), 5,4 (2023), 5,1 (2024), 4,7 (2025), 5,2 (2026). Legend below the chart: green swatch labelled Green Bonds and a dark blue line sample labelled Average duration in years. No highlighted points beyond the callouts. Right panel contains a thin dark blue horizontal divider with a small downward V-notch at its centre; no photograph, logo other than the KFW wordmark in the footer.
Slide 17
Wide range of products addressing investor needs
KfW Benchmark Programmes
KfW Benchmark bonds are among the most liquid bonds on the market
Re-openings support the liquidity of outstanding lines
Highly diversified investor base
Regular issuances with sizes from 3-6bn (8bn incl. re-openings, euro only)
€: 3, 5, 7 and 10y
$: 2, 3, 5 and 10y
Format: EMTN, Global
Additional Public Bonds
KfW is one of the leading SSA issuers in the £, A$ and HK$ market
Large and liquid bonds, complemented by re-openings
Strategic approach in £ and A$
Diversified investor base
Tenors from 1 to 30y
Format: EMTN, Global, Kangaroo, Kauri
Tailor-made Placements
Customized products for investor needs
Flexible in currency, structure and maturity
Format: EMTN, NSV, SSD
EUR bn
58,7
18,5
6,6
2026 (YTD)
KfW Benchmark Programmes
Additional public bonds
Tailor-made placements
€ $
€ $ £ HKD
A$ SEK NOK
“Green Bonds – Made by KfW” in all segments
KfW
Rely on the safe haven - Investor presentation / November 2026
17
Visuals: Column chart, titled EUR bn (label at top right of the panel), with no axis lines or gridlines and no axis tick values. One series, shown as three bars with the categories grouped under the label 2026 (YTD). Bar 1 KfW Benchmark Programmes, dark navy #002D46, value 58,7 printed above the bar (about 58.7 EUR bn). Bar 2 Additional public bonds, blue #005A8C, value 18,5 printed above (18.5 EUR bn). Bar 3 Tailor-made placements, bright blue #0076C4, value 6,6 printed above (6.6 EUR bn). Bar heights are proportional to the values (bar 1 about 42.7 percent of slide height, bar 2 about 13.4, bar 3 about 4.8). Legend below the bars in dark grey text with small square markers in the series colours, listed in order: KfW Benchmark Programmes, Additional public bonds, Tailor-made placements. No highlighted points. Behind the columns, a green-to-grey gradient rectangle, and three faint grey watermark currency-symbol strings at about 20 percent opacity: '€ $' at left, '€ $ £ HKD' and 'A$ SEK NOK' at right. Header bars are flat rectangles with square corners and no shadow.
Slide 18
KfW’s funding by currencies
Benchmark bonds are issued in core currencies EUR and USD
Funding by currencies
70%
60%
50%
40%
30%
20%
10%
0%
EUR
USD
2020
2021
2022
2023
2024
2025
2026 (YTD)
12%
10%
8%
6%
4%
2%
0%
GBP
AUD
HKD
NOK
CNY
Others
2020
2021
2022
2023
2024
2025
2026 (YTD)
Comprehensive product portfolio and broad currency profile meets investors’ requirements.
Rely on the safe haven - Investor presentation / November 2026
18
Visuals: Two grouped vertical bar charts with a shared legend style. Left chart: grouped column chart, no chart title beyond the heading 'Funding by currencies', y-axis 0% to 70% in 10% steps with light grey gridlines, categories EUR and USD, series 2020 (#005A8C), 2021 (#B7F9AA), 2022 (#57D96D), 2023 (#97CFED), 2024 (#00375B), 2025 (#003654), 2026 (YTD) (#007ABC). EUR values about: 2020 64%, 2021 55%, 2022 65%, 2023 54%, 2024 62%, 2025 58%, 2026 56.5%. USD values about: 2020 24%, 2021 26%, 2022 19%, 2023 29%, 2024 25%, 2025 24%, 2026 25%. No highlighted points. Legend beneath the chart in one row with coloured square markers. Right chart: grouped vertical bar chart, y-axis 0% to 12% in 2% steps with light grey gridlines, categories GBP, AUD, HKD, NOK, CNY, Others, same seven series colours as left. GBP values about: 2020 5%, 2021 8.4%, 2022 9%, 2023 9%, 2024 9%, 2025 10%, 2026 10.1%. AUD about: 1.4, 3.3, 2.4, 4.0, 2.0, 2.5, 3.2. HKD about: 1.0, 1.0, 0.3, 0.6, 0.7, 2.3, 3.8. NOK about: 1.5, 1.9, 0.6, 2.0, 0.5, 1.7, 0.5. CNY about: 0.8, 1.4, 1.3, 0.5, 1.0, 0.35, 0.3. Others about: 2.6, 2.6, 2.0, 1.3, 0.2, 1.0, 0.8 (all in %). Legend beneath in one row. Callout band is a flat pale-blue rectangle, not a chart. KfW logo is a bold blue wordmark at bottom-left.
Slide 19
Bond maturities until 2036
KfW’s redemption profile reflects the average loan term of the promotional business (asset side)
EUR bn
90,00
80,00
70,00
60,00
50,00
40,00
30,00
20,00
10,00
-
2026
2027
2028
2029
2030
2031
2032
2033
2034
2035
2036
EUR
USD
Others
KfW
Rely on the safe haven - Investor presentation / November 2026
19
Visuals: Chart: vertical stacked bar chart, one stacked column per year from 2026 to 2036, 11 columns evenly spaced. Title: none printed inside the chart. Y-axis: 'EUR bn', range 0 to 90, gridline labels 10,00 steps (labels read '-' at zero, 10,00, 20,00 ... 90,00), no gridlines visible. X-axis: years 2026 to 2036 as category labels. Series (stacked bottom to top: EUR dark navy, USD green, Others light blue), values are not printed on the slide so all are estimates marked about: 2026 EUR about 0, USD about 3.2, Others about 3.8, total about 7.1. 2027 EUR about 60.7, USD about 15.1, Others about 7.7, total about 83.5. 2028 EUR about 52.8, USD about 16.8, Others about 12.5, total about 82.1. 2029 EUR about 45.1, USD about 12.9, Others about 7.2, total about 65.2. 2030 EUR about 29.0, USD about 10.4, Others about 4.7, total about 44.1. 2031 EUR about 29.7, USD about 10.8, Others about 4.7, total about 45.2. 2032 EUR about 28.4, USD about 0.4, Others about 3.7, total about 32.5. 2033 EUR about 18.2, USD about 6.5, Others about 0.3, total about 25.0. 2034 EUR about 13.8, USD about 1.7, Others about 0.4, total about 15.9. 2035 EUR about 9.7, USD about 0.1, Others about 0.2, total about 10.0. 2036 EUR about 14.8, USD about 3.2, Others about 1.0, total about 19.0. Legend: horizontal, centred below the x-axis, three entries: square swatch navy EUR, square swatch green USD, square swatch light blue Others. Highlighted points: none. Logo: KfW wordmark in dark blue at bottom left.
Slide 20
EUR Benchmark Programme
Total
207bn
€
Highlights
• The EUR benchmark programme is the backbone of KfW's funding
strategy - representing more than 50% of the overall yearly funding
• KfW acts as benchmark reference in the SSA market
• Regular issuances across all benchmark maturities each year
• With it's flexible funding approach KfW is able to enter the market
with new lines or re-openings on existing lines, depending on
investor demand
• KfW's benchmark lines can reach up to €8bn, placing them among
the largest in the SSA market, ensuring the highest level of liquidity
€ BM / € bn / Green / 2026 / Tenor / % / Lead Managers
I/2026 / 5.0 / N / Jan 7 / 3y / 2.375 / BofA, LBBW, HSBC, Barclays
II/2026 / 5.0 / N / Jan 7 / 10y / 3.0 / BofA, LBBW, HSBC, Barclays
III/2026 / 5.0 / Y / Feb 4 / 7y / 2.75 / BNP, DB, GS, Danske
IV/2026 / 5.0 / Y / Apr 16 / 5y / 2.875 / CoBa, NatWest, Santander, UBS
V/2026 / 3.0 / N / May 27 / 10y / 3.375 / BNP, HSBC, DZ, GS
VI/2026 (tap VI/2024) / 3.0 / N / June 30 / 7y / 2.5 / CA, Deka, JPM, MS
VII/2026 / 5.0 / Y / Aug 25 / 3y / 3.0 / Barclays, DB, NatWest, SocGen
Re-openings / 12.0 / 2026 Total / 43.0
bn EUR
Outstandings
8 / 7 / 6 / 5 / 4 / 3 / 2 / 1 / 0
2027 / 2028 / 2029 / 2030 / 2031 / 2032 / 2033 / 2034 / 2035 / 2036 / 2037
KFW EUR 2027/02 / KFW EUR 2027/05 / KFW EUR 2027/04 / KFW EUR 2027/06 / KFW EUR 2027/08 / KFW EUR 2027/09 / KFW EUR 2027/10 / KFW EUR 2027/12 / KFW EUR 2028/01 / KFW EUR 2028/03 / KFW EUR 2028/04 / KFW EUR 2028/06 / KFW EUR 2028/07 / KFW EUR 2028/10 / KFW EUR 2028/11 / KFW EUR 2029/01 / KFW EUR 2029/04 / KFW EUR 2029/06 new / KFW EUR 2029/09 new green / KFW EUR 2029/12 / KFW EUR 2030/06 / KFW EUR 2030/09 / KFW EUR 2030/11 / KFW EUR 2031/01 / KFW EUR 2031/02 / KFW EUR 2031/06 new green / KFW EUR 2031/10 / KFW EUR 2032/01 / KFW EUR 2033/04 new green / KFW EUR 2033/06 / KFW EUR 2034/01 / KFW EUR 2035/01 / KFW EUR 2036/01 new / KFW EUR 2036/05 / KFW EUR 2036/06 new / KFW EUR 2037/03
New Issue / New Issue 2026 / New Issue 2026 Green / Tap / Tap 2026
Rely on the safe haven - Investor presentation / November 2026
20
Visuals: Chart (stacked column, 'Outstandings', y-axis 'bn EUR' from 0 to 8 in steps of 1, no x-axis title). The x-axis carries one column per bond with rotated labels, grouped under the years 2027 (8 bars), 2028 (7), 2029 (5), 2030 (3), 2031 (4), 2032 (1), 2033 (2), 2034 (1), 2035 (1), 2036 (3) and 2037 (1). Values are estimates ('about') because no values are printed. Bars from left to right, stacked bottom to top: 2027/02 about 5 New Issue; 2027/05 about 5 New Issue plus 2 Tap; 2027/04 about 5 New Issue plus 1 Tap; 2027/06 about 5 New Issue plus 2 Tap; 2027/08 about 6 New Issue plus 1 Tap; 2027/09 about 5 New Issue; 2027/10 about 4 New Issue, 2 Tap, 1 Tap 2026; 2027/12 about 3 New Issue plus 3 Tap; 2028/01 about 5 New Issue; 2028/03 about 6 New Issue plus 1 Tap; 2028/04 about 6 New Issue plus 1 Tap; 2028/06 about 4 New Issue plus 2 Tap; 2028/07 about 3 New Issue, 1 Tap, 2 Tap 2026; 2028/10 about 4 New Issue plus 3 Tap; 2028/11 about 5 New Issue plus 2 Tap; 2029/01 about 5 New Issue plus 2 Tap; 2029/04 about 5 New Issue plus 2 Tap; 2029/06 new about 5 New Issue plus 1 New Issue 2026; 2029/09 new green about 5 New Issue 2026 Green; 2029/12 about 4 New Issue plus 1 Tap; 2030/06 about 5 New Issue plus 2 Tap 2026; 2030/09 about 3 New Issue plus 2 Tap; 2030/11 about 3 New Issue; 2031/01 about 5 New Issue plus 1 Tap; 2031/02 about 4 New Issue plus 1 Tap; 2031/06 new green about 5 New Issue 2026 Green; 2031/10 about 3 New Issue plus 3 Tap 2026; 2032/01 about 5 New Issue plus 2 Tap; 2033/04 new green about 5 New Issue 2026 Green; 2033/06 about 3 New Issue, 1 Tap, 1 Tap 2026; 2034/01 about 3 New Issue, 3 Tap, 1 Tap 2026; 2035/01 about 3 New Issue plus 3 Tap; 2036/01 new about 5 New Issue 2026; 2036/05 about 3 New Issue; 2036/06 new about 3 New Issue 2026; 2037/03 about 2 New Issue plus 2 Tap. Legend below the plot in one row: New Issue (dark blue), New Issue 2026 (purple), New Issue 2026 Green (green), Tap (light blue), Tap 2026 (pale purple). Highlighted points: none beyond the colour coding. Table: columns '€ BM', '€ bn', 'Green', '2026', 'Tenor', '%', 'Lead Managers'; rows I/2026 5.0 N Jan 7 3y 2.375 BofA, LBBW, HSBC, Barclays; II/2026 5.0 N Jan 7 10y 3.0 BofA, LBBW, HSBC, Barclays; III/2026 5.0 Y Feb 4 7y 2.75 BNP, DB, GS, Danske; IV/2026 5.0 Y Apr 16 5y 2.875 CoBa, NatWest, Santander, UBS; V/2026 3.0 N May 27 10y 3.375 BNP, HSBC, DZ, GS; VI/2026 (tap VI/2024) 3.0 N June 30 7y 2.5 CA, Deka, JPM, MS; VII/2026 5.0 Y Aug 25 3y 3.0 Barclays, DB, NatWest, SocGen; footer row Re-openings 12.0, 2026 Total 43.0. Logo: KfW wordmark in blue, bottom-left. Callout: a green speech-bubble shape with the text 'Total 207bn' and a large euro sign.
Slide 21
KfW's investor landscape and liquidity
KfW benchmark bonds are among the most liquid bonds on the market
€
Distribution of KfW's benchmark investor base
Turnover in KfW EUR bonds in secondary markets2
Four lead managers for each EUR benchmark bond
Traded by approx. 30-40 banks OTC and at various stock exchanges
Broad order book diversification (Ø more than 150 investors in 2025)
Geographic distribution (in %)1
Investor distribution (in %)1
With outstanding lines of up to 8€ bn, secondary turnovers can be applied easily.
Bid/offer spreads on trading platforms are reliable and perceived to be among the tightest in the EUR SSA market
EUR
Total Outstandings (aggregate principal)
New Issuance (aggregate principal)
Total Turnover
254,0
216.0
227.0
229.0
195.0
172.5
205,6
165.9
147.6
148.1
123.9
116.4
144.0147.0 157.8
98.0 124.0 138.5
32.5 37.5 41.5 32.5 33.8 41.3 34.0 35.6 27
2017 2018 2019 2020 2021 2022 2023 2024 2025
Total turnover in KfW EUR bonds is shown in relation to the total outstanding and the new issues of KfW EUR bonds of each funding year, respectively.
Note: The data includes only turnover with end clients. Broker transactions are excluded.
1 Based on allocation of EUR benchmark bonds / 2 No warranty is given as to the completeness or accuracy of the total turnover data, which has been supplied by 15-20 different banks and accumulated but not verified by KfW.
KfW
Rely on the safe haven - Investor presentation / November 2026
21
Visuals: Four charts. (1) Line chart 'Geographic distribution (in %)1': y-axis 0 to 80 in steps of 20 (percent), x-axis 2019 to 2026, light grey gridlines. Series, values about: Europe ex Germany (dark blue #005A8C) about 64, 67, 68, 66, 58, 67, 62, 54; Germany (pale green #B7F9AA) about 22, 20, 14, 14, 18, 12, 10, 6; Asia (green #57D96D) about 12, 8, 13, 12, 15, 13, 15, 10; Other (light blue #9ED3F0) about 3, 6, 5, 10, 9, 5, 12, 19. Legend to the right in the same order, labels in grey. (2) Line chart 'Investor distribution (in %)1': y-axis 0 to 50 in steps of 10 (percent), x-axis 2019 to 2026. Series, values about: Central Banks (dark blue) about 28, 35, 36, 27, 29, 36, 32, 37; Banks (pale green) about 38, 36, 24, 23, 42, 33, 32, 28; Asset Manager (green) about 25, 23, 31, 39, 21, 23, 27, 23; Ins. & Pension (light blue) about 3, 1, 4, 9, 5, 5, 4, 4; Other (navy) about 6, 6, 5, 3, 3, 4, 4, 8. Legend to the right, top to bottom in the same order. (3) Bar and line chart headed 'EUR' (no axes shown, values printed): pale green bars Total Outstandings (aggregate principal) 2017 98.0, 2018 124.0, 2019 138.5, 2020 172.5, 2021 195.0, 2022 216.0, 2023 227.0, 2024 229.0, 2025 254.0; dark green bars New Issuance (aggregate principal) 2017 32.5, 2018 37.5, 2019 41.5, 2020 32.5, 2021 33.8, 2022 41.3, 2023 34.0, 2024 35.6, 2025 27; dark blue line Total Turnover 2017 144.0, 2018 147.0, 2019 157.8, 2020 116.4, 2021 123.9, 2022 148.1, 2023 147.6, 2024 165.9, 2025 205.6. Bars are grouped by year on a shared baseline; no highlighted points. Legend at right with three swatches (pale green bar, green bar, dark blue line). (4) Euro symbol logo in dark blue #004369, bold. Also a KfW wordmark logo bottom-left in dark blue #005A8C.
Slide 22
USD Benchmark Programme
Highlights
KfW is the world’s third-largest USD SSA issuer, and its USD
benchmark programme is a market reference for others
The USD benchmark programme strategically complements KfW’s
funding programme
Over 25 years with regular issuances across all benchmark maturities
Strong commitment to liquidity, lead managers are encouraged to be
active in KfW’s bonds and closely monitor secondary market liquidity
KfW’s USD benchmark bonds are registered with the SEC, providing
diversified funding and wider investor access including U.S. investors
by meeting U.S. regulatory standards for transparency
USD BM USD bn 2026 Tenor % Lead Managers
I/2026 5.0 Jan 14 5y 3.750 BMO, Citi, JPM, RBC
II/2026 4.0 Mar 17 3y 3.5 CA, MS, Nomura, TD
III/2026 4.0 May 20 5y 4.125 Citi, DB, JPM,TD
IV/2026 3.0 Jul 17 3y 4.25 BoA, BoM, RBC TD
V/2026 3.0 Jul 17 7y 4.375 BoA, BoM, RBC TD
VI/2026 3.0 Sep 16 5y 4.50 CIBC, GS, JPM, MS
2026 Total 22.0
Outstandings
bn USD
Total
74bn
$
Rely on the safe haven - Investor presentation / November 2026
22
Visuals: Chart: vertical column chart titled Outstandings, with the unit bn USD printed at its top-left. Y-axis runs 0 to 6 bn USD in steps of 1, with light grey horizontal gridlines at each step; labels are grey #7F7F7F. X-axis categories are twenty KfW USD bonds, labelled diagonally at about 45 degrees: KfW USD 2027/03, KfW USD 2027/05, KfW USD 2027/06, KfW USD 2027/08, KfW USD 2028/02, KfW USD 2028/04, KfW USD 2028/05, KfW USD 2028/06, KfW USD 2028/08, KfW USD 2029/03, KfW USD 2029/05 new, KfW USD 2029/07 new, KfW USD 2030/03, KfW USD 2030/07, KfW USD 2030/10, KfW USD 2031/03 new, KfW USD 2031/07 new, KfW USD 2031/10 new, KfW USD 2033/07, KfW USD 2033/08 new. Grouped under year labels 2027 (4 bars), 2028 (5), 2029 (3), 2030 (3), 2031 (3), 2033 (2), separated by thin vertical grey lines. No data labels are printed; approximate values read from gridlines: series New Issue (dark blue #005A8C): 2027/03 about 5, 2027/05 about 5, 2027/06 about 3, 2027/08 about 3, 2028/02 about 4, 2028/04 about 3, 2028/05 about 3, 2028/06 about 4, 2028/08 about 3, 2029/03 about 5, 2030/03 about 3, 2030/07 about 5, 2030/10 about 2, 2033/07 about 4. Series New Issue 2026 (purple #A455C5): 2029/05 new about 4, 2029/07 new about 3, 2031/03 new about 5, 2031/07 new about 4, 2031/10 new about 3, 2033/08 new about 3. Legend centred below the chart: dark-blue square New Issue, purple square New Issue 2026. No bars are highlighted beyond colour. Badge: green speech-bubble shape reading Total 74bn with a large dark-blue dollar sign icon at its right. Logo: KfW wordmark in dark blue at bottom-left.
Slide 23
KfW’s investor landscape and liquidity
KfW benchmark bonds are among the most liquid bonds on the market
$
Distribution of KfW’s benchmark investor base
Four lead managers for each USD BM bond
Traded by approx. 30-40 banks OTC and at various stock exchanges
Broad order book diversification (Ø up to 100 investors in 2025)
Geographic distribution (in %)1
80
60
40
20
0
2019 2020 2021 2022 2023 2024 2025 2026
Asia
EMEA
Americas
Other
Investor distribution (in %)1
60
50
40
30
20
10
0
2019 2020 2021 2022 2023 2024 2025 2026
Central Banks
Banks
Asset Manager
Other
Turnover in KfW USD bonds in secondary markets2
KfW’s bonds are considered as HQLA (high quality liquid assets) level 1
Bid/offer spreads perceived to be among the tightest in the USD SSA market
USD
146.0 194.0 164.6 88.0 90.0 78.0 83.0 71.0 68.0
96.0 92.0 83.5 88.0 90.0 78.0 83.0 71.0 68.0
25.0 21.5 23.4 12.2 16.6 14.8 24.0 14.6 17
53.7 54.4 41.0 60.2 85.9 74.8
2017 2018 2019 2020 2021 2022 2023 2024 2025
Total
Outstandings
New Issuance
(aggregate
principal)
Total Turnover
Total turnover in KfW USD bonds is shown in relation to the total outstanding
and the new issues of KfW USD bonds of each funding year, respectively.
Note: The data includes only turnover with end clients. Broker transactions are excluded.
1 Based on allocation of USD benchmark bonds
2 No warranty is given as to the completeness or accuracy of the total turnover data, which has been supplied by 15-20 different banks and accumulated but not verified by KfW.
Rely on the safe haven - Investor presentation / November 2026
23
Visuals: 1) Line chart 'Geographic distribution (in %)1': x-axis years 2019-2026 (categorical); y-axis 0 to 80 in steps of 20, no units beyond %; no data labels printed, so values are estimates marked about. Series: Asia (dark blue #005A8C) about 31, 32, 19, 19, 10, 22, 23, 21; EMEA (light green #B7F9AA) about 38, 34, 36, 45, 59, 48, 46, 53; Americas (green #57D96D) about 31, 30, 38, 32, 30, 30, 31, 27; Other (light blue #9DD3F0) about 0, 2, 7, 4, 0, 1, 0, 0. Legend at right, vertical, with line swatches in series colours. No highlighted points. 2) Line chart 'Investor distribution (in %)1': y-axis 0 to 60 in steps of 10; no data labels, values estimated. Series: Central Banks (dark blue) about 52, 53, 43, 40, 31, 42, 40, 34; Banks (light green) about 37, 33, 35, 46, 48, 43, 47, 51; Asset Manager (green) about 7, 10, 14, 12, 18, 13, 11, 13; Other (light blue) about 4, 3, 6, 2, 4, 2, 2, 3. Legend at right with line swatches. 3) Combined bar-and-line chart titled 'USD' (no chart title beyond that label): categories 2017 to 2025; no visible y-axis, values printed on each mark. Bars: Total Outstandings in light green #B7F9AA, labelled 96.0, 92.0, 83.5, 88.0, 90.0, 78.0, 83.0, 71.0, 68.0; New Issuance (aggregate principal) in green #57D96D, labelled 25.0, 21.5, 23.4, 12.2, 16.6, 14.8, 24.0, 14.6, 17. Line: Total Turnover in dark blue #005A8C with a 2.5 pt stroke and round markers, labelled 146.0 (2017), 194.0 (2018, peak), 164.6 (2019), 53.7 (2020), 54.4 (2021), 41.0 (2022, lowest), 60.2 (2023), 85.9 (2024), 74.8 (2025). Legend at right: Total Outstandings, New Issuance (aggregate principal), Total Turnover. Category axis is a thin grey baseline. Highlighted point: the 2018 peak of 194.0 and the 2022 low of 41.0 are the extremes of the line. 4) Vertical grey divider line, #7F7F7F, about 0.1% wide, full height of the content area. 5) KfW logo, dark blue #005A8C wordmark, bottom left. 6) Dollar-sign glyph '$' in dark blue #004369, top right, regular weight, large.
Slides 24 to 58 continue in the full text file.
Download this deck
The hosted PDF of every library deck is free for readers of the SlideDeck Co newsletter. Join with your email and the viewer and download appear here.
Preparing a results presentation or business update of your own? The SlideDeck Co Standard Deck is a slide library for business reviews, updates and plans.







