
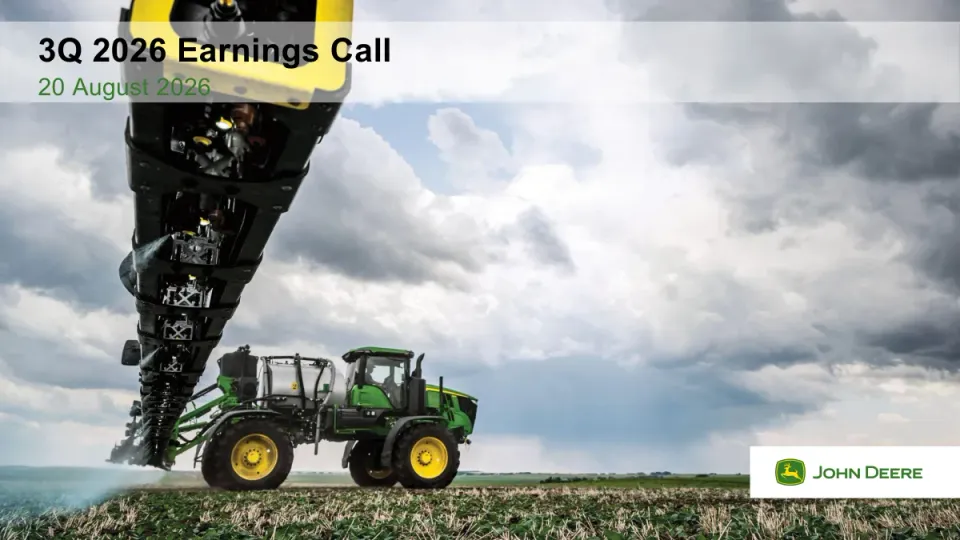
The deck opens with a title slide for the 3Q 2026 earnings call, held on 20 August 2026, followed by a dense forward-looking statements disclaimer. Next is a headline results slide showing net sales and revenues, equipment net sales, net income, and diluted EPS, each compared with the prior year using percentage change arrows. The middle section covers results and outlook by business segment: Production and Precision Ag, Small Ag and Turf, Construction and Forestry, and Financial Services. Each segment has a results slide with an operating profit waterfall, then an industry outlook slide with simple icon tiles for regions and an outlook slide with bar pairs for the fiscal year. A consolidated outlook slide covers the tax rate, net income, cash flow, R&D, capital expenditure, and other items. The appendix holds retail sales and dealer inventory data for North America and Europe, the use-of-cash priorities, and the date of the next earnings call. The deck closes on that date slide.
Slides worth studying
- Slide 4: The operating profit waterfall uses colour to separate positive and negative drivers and anchors the start and end totals in dark grey, so the bridge reads at a glance.
- Slide 6: Industry outlook tiles use arrows and short labels in a consistent grid, turning regional forecasts into a readable visual summary without any dense text.
- Slide 7: Paired bars with a single large callout number per metric keep the outlook clear and let the forecast stand out against the prior-year actual.
- Slide 17: The use-of-cash priorities are laid out as a labelled diagram with one clear idea per block, a good model for explaining capital allocation visually.
Details
- Company: John Deere
- Year: 2026
- Type: Investor presentation
- Industry: Agricultural and construction equipment
- Pages: 19
Review score: 7 out of 10, Effective
Presentation quality, judged with the SlideDeck Co review heuristic. Ask, evidence and idea merit are not rated here.
The deck is a consistent, readable earnings-call set. Every segment follows the same results, industry outlook, segment outlook pattern, with a fixed title, subtitle and footer, and the series colours stay consistent, so a listener can follow it with the speaker. Weaknesses are mostly in the charts: slides 4 and 7 title only the topic, so the takeaway (sales down, margin falling from 15.4% to 11-12%) is left for the speaker or reader to work out. The slide 7 bars carry no baseline values for the forecast, the waterfall labels are small, and the forward-looking statements slide (2) is a block of tiny text.
Worth keeping: Keep the repeating segment template, the green and yellow segment colour coding, and the clean waterfall on slide 4 with its labelled start and end totals.
Most useful repair: Rewrite titles to state the takeaway, enlarge the waterfall axis labels, and put values or ranges on the forecast bars (slide 7) so the scale is not left to inference.
What would change the score: I would add a short summary slide before the segments and make the title slide text clear of the sprayer image, since the date on slide 1 sits over a busy photo.
Confidence high. 19 of 19 pages inspected on contact sheets, 4 at readable size. Reviewed 2026-11-10. Model-assisted review (claude-sonnet-5-5).
Full text of the slides (19 slides)
Every slide's words and a description of its charts and images, so the deck can be searched and rebuilt. Also available as Markdown.
Slide 1
3Q 2026 Earnings Call
20 August 2026
JOHN DEERE
Visuals: Photograph, full-bleed: a green John Deere self-propelled sprayer drives left to right across a stubbled crop field under a heavy, cloudy sky. Its white spray tank and yellow-rimmed wheels are visible, and a large black and yellow spray nozzle tower rises from the left foreground, angled diagonally toward the top-left corner, with fine spray mist drifting from its nozzles. Framing is a low-angle wide shot. Lighting is diffuse overcast daylight. Dominant colours are grey-white and blue-grey clouds, green machine and crop, black tower, and yellow accents. The image is not cropped inside a box and has no tint, except the white band at 50% opacity across the top. Logo: John Deere logo (yellow-and-green leaping deer in a shield) with the JOHN DEERE wordmark in green capitals, on the white box.
Slide 2
Forward-Looking Statements
These materials and the accompanying earnings call include forward-looking statements within the meaning of the safe harbor provisions of the Private Securities Litigation Reform Act of 1995. Forward-looking statements may be identified by words such as “forecast,” “guidance,” “project,” “target,” “outlook,” “prospects,” “expect,” “estimate,” “will,” “goal,” “plan,” “anticipate,” “intend,” “predict,” “believe,” “likely,” “future,” “could,” “may,” or other similar words or phrases, including the negative variations of such words or phrases. Examples of forward-looking statements include, among others, comments and information concerning the Company’s plans and projections for the future, the agricultural industry, cash priorities, estimates and assumptions with respect to economic, political, supply chain, energy, technological and weather matters, market acceptance of the Company’s products, benefits of acquisitions and divestitures, as well as integration of businesses and anticipated transaction costs.
Forward-looking statements are neither historical facts nor assurances of future performance. Instead, they are based only on management’s current beliefs, expectations and assumptions regarding the future of the Company’s business, plans and strategies, projections, anticipated events and trends, the economy, and other future conditions. Forward-looking statements are subject to inherent uncertainties, risks, changes in circumstances, and other factors that are difficult to predict and many of which are outside of the Company’s control and may cause our actual results to differ materially from those projected in these forward-looking statements. Among these factors are risks related to the agricultural business cycle; construction and forestry activity; macroeconomic conditions, including unemployment, inflation, interest rate volatility and energy price increases resulting from geopolitical conflicts; the uncertainty of government policies and actions with respect to the global trade environment including increased and contested tariffs; exposure to risks and events beyond our control in countries in which we operate, such as economic and political instability, worldwide demand for food and different forms of renewable energy impacting the price of farm commodities; rationalization, restructuring, relocation, expansion and/or reconfiguration of manufacturing and warehouse facilities; accurately forecasting customer demand for products and services; delays or disruptions in our supply chain, including those arising from geopolitical conflicts; changes in climate patterns, unfavorable weather events, and natural disasters; higher interest rates and currency fluctuations; negative economic conditions in the financial industry which could impact our financial services segment; adapting in highly competitive markets; challenges in executing and realizing the benefits of our business strategies; dealer practices and their ability to manage new and used inventory, distribute our products, and provide support and service for precision technology solutions; the ability to realize anticipated benefits of acquisitions and joint ventures, including challenges with successful integration; negative claims or publicity that damage our reputation or brand; the ability to attract, develop, engage, and retain qualified employees; the impact of workforce reductions on company culture, employee retention and morale, and institutional knowledge; labor relations and contracts, including work stoppages and other disruptions; security breaches, cybersecurity attacks, technology failures, and other disruptions to our information technology infrastructure and products; leveraging artificial intelligence and machine learning within our business processes; changes to existing laws and regulations, including the implementation of new, more stringent laws, as well as compliance with these laws and regulations; and investigations, claims, lawsuits, or other legal proceedings. For a discussion of risks and uncertainties impacting our business, see “Item 1A Risk Factors” in our most recent Annual Report on Form 10-K, as updated by our subsequent filings with the U.S. Securities and Exchange Commission. Investors should refer to and consider the information on risks and uncertainties in addition to the information presented here.
All forward-looking statements made in these materials and the accompanying earnings call are based only on information currently available and speak only as of the date on which they are made. You should not place undue reliance on forward-looking statements. The Company, except as required by law, undertakes no obligation to update or revise any forward-looking statements whether as a result of new developments or otherwise.
These materials and the accompanying earnings call may contain non-GAAP financial measures. Non-GAAP measures should be viewed as a supplement to, and not in isolation from, or as a substitute for the Company’s GAAP measures of performance and the financial results calculated in accordance with GAAP and reconciliations from these results should be carefully evaluated.
2
John Deere | 3Q 2026 Earnings Call | August 20, 2026
Visuals: none. The only non-text elements are the full-slide green background fill and the grey footer band, both plain flat fills with no images, charts, or icons.
Slide 3
3Q 2026 Results
($ millions except where noted)
Net Sales and
Revenues
Net Sales
(Equipment Operations)
Net Income
(attributable to
Deere & Company)
Diluted EPS
($ per share)
$12,018
$12,608
$10,357
$10,999
$1,289
$1,379
$4.75
$5.10
3Q 2025
3Q 2026
3Q 2025
3Q 2026
3Q 2025
3Q 2026
3Q 2025
3Q 2026
5%
6%
7%
7%
3
John Deere | 3Q 2026 Earnings Call | August 20, 2026
Visuals: Four side-by-side bar charts, each with two vertical bars (3Q 2025 in grey, 3Q 2026 in green) and a category label under each bar. Chart 1, Net Sales and Revenues: 3Q 2025 $12,018 (grey), 3Q 2026 $12,608 (green), arrow box 5%. Chart 2, Net Sales (Equipment Operations): 3Q 2025 $10,357 (grey), 3Q 2026 $10,999 (green), arrow box 6%. Chart 3, Net Income (attributable to Deere & Company): 3Q 2025 $1,289 (grey), 3Q 2026 $1,379 (green), arrow box 7%. Chart 4, Diluted EPS ($ per share): 3Q 2025 $4.75 (grey), 3Q 2026 $5.10 (green), arrow box 7%. Bars are drawn to a common baseline; each bar is drawn about proportional to its value, with no printed axes, gridlines or legend. Each bar sits on a thin light grey baseline. Below each chart is a boxed upward arrow: a grey outlined square (stroke about #A6A6A6, about 3px) containing a grey upward arrow icon (#A6A6A6, thin stroke) and a bold black percentage to its right. No highlighted points beyond the green 3Q 2026 bars.
Slide 4
Production & Precision Ag / 3Q 2026 Results $ in millions / Net Sales ↓6% / $4,273 / $3,998 / 3Q 2025 / 3Q 2026 / Operating Profit Comparison / $580 / ($124) / $108 / $49 / $0 / ($95) / $5 / $28 / ($24) / $527 / 3Q 2025 / Volume/ Mix / Price / Currency / Warranty / Production Costs / SA&G/ R&D / Special Items / Other / 3Q 2026 / 4 John Deere | 3Q 2026 Earnings Call | August 20, 2026
Visuals: Two charts. Chart 1 (left): column chart titled 'Net Sales ↓6%' (grey heading text with a small grey down arrow), two columns with values printed above: 3Q 2025 $4,273 in grey #A6A6A6 and 3Q 2026 $3,998 in green #367C2B; units in $ millions per the subtitle; no y-axis or gridlines shown; category labels '3Q 2025' and '3Q 2026' under a thin light grey baseline; no legend. Chart 2 (right): waterfall titled 'Operating Profit Comparison' in grey, units $ in millions, no y-axis shown, value labels above or within each bar. Bars left to right with printed values: 3Q 2025 $580 (dark grey #595959 total bar, label white bold inside top); Volume/Mix ($124) (light grey #D9D9D9 decrease, about 39% to 48% of height); Price $108 (green #367C2B increase, about 40% to 48%); Currency $49 (green increase, about 37% to 40%); Warranty $0 (no bar, label only); Production Costs ($95) (light grey decrease, about 37% to 44%); SA&G/R&D $5 (thin green increase, about 43%); Special Items $28 (green increase, about 41% to 43%); Other ($24) (light grey decrease, about 41% to 43%); 3Q 2026 $527 (dark grey #595959 total bar, label white bold inside top). Category labels under the baseline at about 81% to 84% height. Baseline is a thin grey line with small tick marks between categories. No legend. Circular badge: grey #7F7F7F filled circle containing a thin white right-pointing chevron arrow, sitting on the vertical divider line.
Slide 5
Small Ag & Turf / 3Q 2026 Results $ in millions / Net Sales 12% / 3Q 2025 / $3,025 / 3Q 2026 / $3,383 / Operating Profit Comparison / $485 / $120 / $51 / $12 / $10 / ($52) / $9 / $17 / ($30) / $622 / 3Q 2025 / Volume/ Mix / Price / Currency / Warranty / Production Costs / SA&G/ R&D / Special Items / Other / 3Q 2026 / 5 / John Deere | 3Q 2026 Earnings Call | August 20, 2026
Visuals: Left: column chart titled 'Net Sales' with an up-arrow icon and '12%', two columns with labelled values: 3Q 2025 $3,025 (grey #A6A6A6, bar height about 77% of the 3Q 2026 bar) and 3Q 2026 $3,383 (green #367C2B). No axis or legend shown; baseline is a thin grey rule. Right: waterfall chart titled 'Operating Profit Comparison' in $ millions, no axis or gridlines, category labels beneath the baseline. Bars in order: 3Q 2025 $485 (dark grey #595959 total bar, value inside in white bold); Volume/Mix $120 (green increase, floating, about from 485 to 605); Price $51 (green increase); Currency $12 (green increase); Warranty $10 (green increase); Production Costs ($52) (light grey #D9D9D9 decrease); SA&G/R&D $9 (green increase); Special Items $17 (green increase); Other ($30) (light grey #D9D9D9 decrease); 3Q 2026 $622 (dark grey #595959 total bar, value inside in white bold). Green is used for increases, light grey for decreases, dark grey for totals. Small circular arrow button between panels: grey circle with white right-pointing chevron, centred on the vertical divider. Up-arrow icon: thin grey arrow beside 'Net Sales'.
Slide 6
Ag and Turf
Industry Outlook (in units) – FY 2026
U.S. and CANADA
LARGE AG
Down 15-20%
U.S. and CANADA
SMALL AG and TURF
Flat to up 5%
EUROPE AG
Flat
SOUTH AMERICA AG
(tractors and combines)
Down 15-20%
ASIA AG
Flat
Source: Deere & Company forecast as of 20 August 2026
6
John Deere | 3Q 2026 Earnings Call | August 20, 2026
Visuals: Five panels, each with a dashed grey rounded-less frame, a square arrow tile, a globe-style continent map, and a caption. Panel 1 (U.S. and CANADA LARGE AG, top left): dark grey #5B6266 square with a white thin down arrow, caption 'Down 15-20%' in bold; a green #3A7D2C North America map on a light grey #D9D9D9 circle. Panel 2 (U.S. and CANADA SMALL AG and TURF, top middle): green #3A7D2C square with a white thin up arrow, caption 'Flat to up 5%' in bold; a lighter olive-green #9DB35A North America map on a light grey circle. Panel 3 (EUROPE AG, top right): black #000000 square with a white thin double-headed horizontal arrow, caption 'Flat' in bold; a green Europe map on a light grey circle, with a small piece of the map at the bottom right of the circle extending beyond it. Panel 4 (SOUTH AMERICA AG, (tractors and combines), bottom left): dark grey #5B6266 square with a white thin down arrow, caption 'Down 15-20%' in bold; a green South America map on a light grey circle. Panel 5 (ASIA AG, bottom middle): black #000000 square with a white thin double-headed horizontal arrow, caption 'Flat' in bold; a green Asia and Southeast Asia map on a light grey circle, with islands extending past the circle at the lower right. No photographs; no logos; no chart or table.
Slide 7
Production & Precision Ag / Business Segment Outlook / $ in millions / Net Sales / Operating Margin / $17,311 / ~10% / FY 2025 / FY 2026 Fcst / 15.4% / 11-12% / FY 2025 / FY 2026 Fcst / Source: Deere & Company forecast as of 20 August 2026 / 7 / John Deere | 3Q 2026 Earnings Call | August 20, 2026
Visuals: Two grouped vertical bar charts with no legend and no gridlines or value axis. Left chart titled Net Sales with categories FY 2025 and FY 2026 Fcst. Series FY 2025 is a single grey bar (#7F7F7F) labelled $17,311 in white bold text inside the bar, with no axis units printed; the bar top is at about 40.4% of slide height. Series FY 2026 Fcst is a single green bar (#367C2B) with no inside value and the label ~10% above it in dark grey bold; a thin grey down arrow (about #7F7F7F, roughly 1.5% of slide width, pointing down, from about y 39.7% to 46.7%) sits to the left of the label at about x 30.4% to 32.0%; the green bar top is at about 43.9%, so the bar is shorter than the grey bar, consistent with the stated decline of about 10%. Right chart titled Operating Margin with the same two categories. Series FY 2025 is a single grey bar (#7F7F7F) labelled 15.4% in white bold inside the bar, top at about 35.9%. Series FY 2026 Fcst is a stacked green bar (#367C2B) from about 47.2% down to the baseline, with a lighter olive segment (about #A3AD55, estimated) stacked on top from about y 44.6% to 47.2%, and the label 11-12% above it in dark grey bold; the olive segment represents the upper end of the range and is not labelled separately. Baselines are thin light grey horizontal lines under each chart at about y 75.5%. No highlighted points beyond the colour contrast of the forecast bars.
Slide 8
Small Ag & Turf
Business Segment Outlook $ in millions
Net Sales
~15%
$10,224
FY 2025
FY 2026 Fcst
Operating Margin
14.5-15.5%
11.8%
FY 2025
FY 2026 Fcst
8
John Deere | 3Q 2026 Earnings Call | August 20, 2026
Source: Deere & Company forecast as of 20 August 2026
Visuals: Two paired column charts, no printed axes, value scales or gridlines. Chart 1 (Net Sales, $ in millions): column FY 2025 grey #7F7F7F labelled $10,224 inside the bar in white bold; column FY 2026 Fcst green #367C2B with the label ~15% printed above it in bold dark grey, plus a thin grey upward arrow icon (about 4% wide, 9% tall) to the left of that label pointing up; the FY 2026 Fcst bar is about 15% taller than FY 2025 (bar heights about 34% and 39% of slide height; estimates). Chart 2 (Operating Margin): column FY 2025 grey #7F7F7F labelled 11.8% inside in white bold; column FY 2026 Fcst is a stacked column with a solid green #367C2B lower portion and a lighter olive #A3AD55 (about) cap segment on top (about 2.5% of slide height), labelled 14.5-15.5% above it in bold dark grey; the olive cap represents the top of the guided range. Both charts have a thin light grey baseline (#D9D9D9, about) under the columns. No legend, no highlighted points beyond the colour coding.
Slide 9
Construction & Forestry
3Q 2026 Results $ in millions
Net Sales 18%
$3,618
$3,059
3Q 2025
3Q 2026
Operating Profit Comparison
$244
$10
($35)
$21
($65)
$16
($14)
$436
$22
$237
3Q 2025
Volume/ Mix
Price
Currency
Warranty
Production Costs
SA&G/ R&D
Special Items
Other
3Q 2026
9
John Deere | 3Q 2026 Earnings Call | August 20, 2026
Visuals: Two charts. (1) Net Sales column chart, titled Net Sales with an up-arrow icon and 18%. Two columns: 3Q 2025 grey #A6A6A6 labelled $3,059 and 3Q 2026 yellow #F1A800 labelled $3,618; a thin light grey baseline sits beneath them. No axes are printed, so bar heights are relative. (2) Operating Profit Comparison waterfall, in $ in millions, with no printed axis. Bars left to right: 3Q 2025 $237 (dark grey #595959 total bar, value in white bold); Volume/Mix $22 (yellow increase); Price $244 (yellow increase, the tallest floating bar); Currency $10 (yellow increase); Warranty ($35) (light grey #D9D9D9 decrease); Production Costs $21 (yellow increase); SA&G/R&D ($65) (light grey decrease); Special Items $16 (yellow increase); Other ($14) (light grey decrease); 3Q 2026 $436 (dark grey total bar, value in white bold). Yellow marks increases, light grey marks decreases, and the two totals are dark grey. The category axis is a thin grey line at y 79.8%. A grey circular button with a white right-pointing chevron sits on the divider. A small grey up-arrow icon sits beside Net Sales.
Slide 10
Construction & Forestry / Industry Outlook (in units) – FY 2026 / U.S. and CANADA / CONSTRUCTION EQUIPMENT / Up 5-10% / U.S. and CANADA COMPACT / CONSTRUCTION EQUIPMENT / Up ~5% / GLOBAL FORESTRY / Down ~10% / GLOBAL ROADBUILDING / Up ~10% / Source: Deere & Company forecast as of 20 August 2026 / 10 / John Deere | 3Q 2026 Earnings Call | August 20, 2026
Visuals: Four icon pairs, one per dashed card, all flat vector style. Top-left card: a yellow (#F1A800) square with a black thin upward arrow, plus an orange (#F1A800) circle with a dark grey (#555555) North America silhouette that spills past the circle's left edge. Top-right card: the same yellow square with black upward arrow, and the same orange circle with dark grey North America silhouette. Bottom-left card: a dark slate grey (#5B6166) square with a white downward arrow, plus a light grey (#D9D9D9) globe with green (#387C2B) continents. Bottom-right card: a yellow (#F1A800) square with a black upward arrow, plus a light grey (#D9D9D9) globe with dark grey (#555555) continents. No charts, photographs or logos.
Slide 11
Construction & Forestry
Business Segment Outlook
$ in millions
Net Sales
~20%
$11,382
FY 2025
FY 2026 Fcst
Operating Margin
10.5-11.5%
9.0%
FY 2025
FY 2026 Fcst
Source: Deere & Company forecast as of 20 August 2026
11
John Deere | 3Q 2026 Earnings Call | August 20, 2026
Visuals: Two vertical column charts with no printed axes, scales or gridlines. Chart 1, title 'Net Sales', unit '$ in millions'. Categories 'FY 2025' and 'FY 2026 Fcst'. Series: FY 2025 grey column (#7F7F7F), labelled '$11,382' in white bold inside the column near its middle. FY 2026 Fcst amber column (#F1A800), no value printed; it is labelled '~20%' above the column in bold dark grey, with a thin grey up-arrow icon to the left of the label indicating growth. The amber column is about 1.2 times the height of the grey column (estimate; no value printed). Chart 2, title 'Operating Margin'. Categories 'FY 2025' and 'FY 2026 Fcst'. FY 2025 grey column (#7F7F7F) labelled '9.0%' in white bold inside the column. FY 2026 Fcst amber column (#F1A800) with a pale amber cap segment on top (about #FFDD88, estimated) representing the upper part of the range; the column is labelled '10.5-11.5%' in bold dark grey above it. The amber column is about 1.2 times the height of the grey column (estimate). No legend. No highlighted points beyond the pale amber cap. Columns are flat, no shadows. An up-arrow icon with grey thin stroke sits above the left chart's amber column.
Slide 12
Financial Services / Net Income – Results and Outlook / $ in millions / Quarter Results / Fiscal Year Outlook / $205 / $219 / 3Q 2025 / 3Q 2026 / $890 / ~$870 / FY 2025 / FY 2026 Fcst / Source: Deere & Company forecast as of 20 August 2026 / 12 / John Deere | 3Q 2026 Earnings Call | August 20, 2026
Visuals: Two vertical bar charts, each with no y-axis, no gridlines and no numeric scale; bars are drawn to a common baseline with a thin light grey horizontal axis line beneath them. Left chart titled Quarter Results with two bars: 3Q 2025 grey bar labelled $205 and 3Q 2026 green bar labelled $219, with the green bar about 6% taller than the grey bar. Right chart titled Fiscal Year Outlook with two bars: FY 2025 grey bar labelled $890 and FY 2026 Fcst green bar labelled ~$870, with the green bar about 2% shorter than the grey bar. Bar values are printed inside each bar near the upper-middle in bold white Arial. Units are dollars in millions as stated in the subtitle note. No legend; grey marks the 2025 actual and green marks the 2026 figure, with the highlighted points being the two green 2026 bars. The forecast bar is labelled with a tilde prefix.
Slide 13
Deere & Company Outlook
FY 2026 FORECAST
Net Income
(attributable to Deere & Co.)
Effective
Tax Rate*
Net Operating
Cash Flow*
$4.75-5.0B
24-26%
$5.0-5.5B
Other
Research and Development Expenses*
Up slightly
Capital Expenditures*
~$1.3B
*Equipment Operations
Source: Deere & Company forecast as of 20 August 2026
13
John Deere | 3Q 2026 Earnings Call | August 20, 2026
Visuals: None photographic. Three large KPI figures in bold green, each set under a black label: Net Income (attributable to Deere & Co.) $4.75-5.0B; Effective Tax Rate* 24-26%; Net Operating Cash Flow* $5.0-5.5B. A thin black horizontal rule runs under the FY 2026 FORECAST heading from about 6% to 94% of width. In the lower band a thin vertical grey divider sits left of the item list, and a thin light grey horizontal rule sits between the two rows, spanning about 24.6% to 80% of width. No charts, logos or icons.
Slide 14
Appendix
14
John Deere | 3Q 2026 Earnings Call | August 20, 2026
Visuals: Photograph, full-bleed across the whole slide and cropped at the bottom by the grey band. Subject: five John Deere turf and grounds machines parked on a red clay strip in front of a green chain-link fence, with tall corn behind the fence. From left to right: a green and yellow triplex-style mower with a front reel-cutting unit and a rollbar; a green aerator or verticutter unit with a drum and yellow wheels; a small green walk-behind mower with a rear handle; a green and yellow utility tractor with a yellow seat and a front mast or forklift attachment; and a green and yellow utility vehicle with a large yellow tank and a rollbar. Behind the fence is a dense field of tall green corn. Further back, a white two-storey farmhouse with a white picket fence and a dark grey roof, and a red barn with a dark grey standing-seam roof and a sign reading FIELD OF DREAMS, sit among tall dark green trees. Composition: wide, eye-level, subjects in the lower half, sky in the upper half. Lighting: soft, overcast daylight with some sun on the foreground. Dominant colours: green (corn, turf and machines), dark green trees, red barn and clay, white house, grey-blue sky. Overlay: none on the photo itself. The grey band is a separate shape on top of the photo.
Slide 15
July 2026 Retail Sales (Rolling 3 Months) and Dealer Inventories / Retail Sales / U.S. and Canada Ag / Industry* / Deere** / 2WD Tractors (< 40 PTO hp) / 20% / Down more than the industry / 2WD Tractors (40 < 100 PTO hp) / 11% / Down less than the industry / 2WD Tractors (100+ PTO hp) / 7% / Down less than the industry / 4WD Tractors / 34% / Down more than the industry / Combines / 20% / Down more than the industry / Deere Dealer Inventories*** / U.S. and Canada Ag / 2026 / 2025 / 2WD Tractors (100+ PTO hp) / 33% / 31% / Combines / 25% / 26% / * As reported by the Association of Equipment Manufacturers / ** As reported to the Association of Equipment Manufacturers / *** In units as a % of trailing 12 months retail sales, as reported to the Association of Equipment Manufacturers / 15 / John Deere | 3Q 2026 Earnings Call | August 20, 2026
Visuals: Two tables, no photographs or charts. Upper table: columns are row label (2WD Tractors (< 40 PTO hp); 2WD Tractors (40 < 100 PTO hp); 2WD Tractors (100+ PTO hp); 4WD Tractors; Combines), Industry arrow plus value (20%, 11%, 7%, 34%, 20%), and Deere arrow plus green text (Down more than the industry; Down less than the industry; Down less than the industry; Down more than the industry; Down more than the industry). Each Industry and Deere cell has a solid black downward block arrow, about 2.5% wide and 3.5% tall, centred in its column (Industry column arrows at x about 45.0%; Deere column arrows at x about 66.8%), one per row at y about 30.0%, 35.3%, 41.0%, 46.9% and 52.8%. Lower table: columns are row label, 2026 value and 2025 value. Rows: 2WD Tractors (100+ PTO hp) with 33% (2026, black bold) and 31% (2025, grey); Combines with 25% (2026, black bold) and 26% (2025, grey). No arrows in the lower table. The 2025 cells are on a light grey #F2F2F2 fill. Thin dark grey horizontal rules separate rows; a heavier dark rule closes the lower table at about y 80.8%.
Slide 16
July 2026 Retail Sales (Rolling 3 Months)
Retail Sales / Europe Ag
Deere*
Tractors
Down low double digits
Combines
Up high single digit
Retail Sales / U.S. and Canada
Deere*
Selected Turf and Utility Equipment
Down single digit
Earthmoving and Forestry
Up single digit
16
John Deere | 3Q 2026 Earnings Call | August 20, 2026
* Based on internal sales reports
Visuals: Two tables. Table 1, Retail Sales Europe Ag: rows Tractors with a solid black downward arrow and green text 'Down low double digits'; Combines with a solid black upward arrow and green text 'Up high single digit'. Table 2, Retail Sales U.S. and Canada: rows Selected Turf and Utility Equipment with a solid black downward arrow and green text 'Down single digit'; Earthmoving and Forestry with a solid black upward arrow and green text 'Up single digit'. Arrows are block-style black arrows centred in a column at about x 79% to 82%. No chart, photograph or logo.
Slide 17
Deere Use-of-Cash Priorities / CASH FROM OPERATIONS / Equipment Operations Cash Flow from Operating Activities / COMMITTED / TO “A” RATING / Manage the balance sheet, including liquidity, to support a rating that provides / access to low-cost and readily available short- and long-term funding / mechanisms (reflects the strategic nature of our financial services operation) / FUND OPERATING / & GROWTH NEEDS / Fund value-creating investments in our businesses, including organic / and inorganic activities. / COMMON STOCK / DIVIDEND / Consistently and moderately raise dividend targeting a 25-35% payout ratio of / mid-cycle earnings / SHARE / REPURCHASE / Repurchase shares to deploy remaining free cash flow to shareholders over / the business cycle / 17 / John Deere | 3Q 2026 Earnings Call | August 20, 2026
Visuals: Process diagram of five stacked rectangular labels connected top to bottom by downward-pointing triangular chevrons. Shape 1: grey #7F7F7F rectangle labelled CASH FROM OPERATIONS, with a grey downward chevron below it pointing to shape 2. Shape 2: green #367C2B rectangle labelled COMMITTED / TO “A” RATING, with a green downward chevron below it. Shape 3: green rectangle labelled FUND OPERATING / & GROWTH NEEDS, with a green downward chevron below it. Shape 4: green rectangle labelled COMMON STOCK / DIVIDEND, with a green downward chevron below it. Shape 5: green rectangle labelled SHARE / REPURCHASE, with no chevron below. Each label is white text centred in its box. The chevrons are about 4% of slide height tall and point down toward the next box. Each rectangle is a sharp-cornered flat fill with no outline and no shadow. No photographs, logos or icons. No chart or table.
Slide 18
Deere & Company’s 4Q 2026 earnings call / is scheduled for 9:00 a.m. Central Time on / Wednesday, 25 November 2026. / 18 / John Deere | 3Q 2026 Earnings Call | August 20, 2026
Slide 19
JOHN DEERE
Visuals: One logo: the John Deere lockup. On the left is a shield-shaped badge with a green (#367C2B) outer field, a thin yellow (#FFDE00) inner border line, and a yellow leaping deer with antlers in the centre. To the right is the wordmark 'JOHN DEERE' in capital letters set in a wide geometric sans-serif, coloured green (#367C2B), on one line with the badge's vertical centre. The logo is shown as a placed image, unboxed, with no shadow or overlay.
Download this deck
The hosted PDF of every library deck is free for readers of the SlideDeck Co newsletter. Join with your email and the viewer and download appear here.
Preparing a results presentation or business update of your own? The SlideDeck Co Standard Deck is a slide library for business reviews, updates and plans.







