
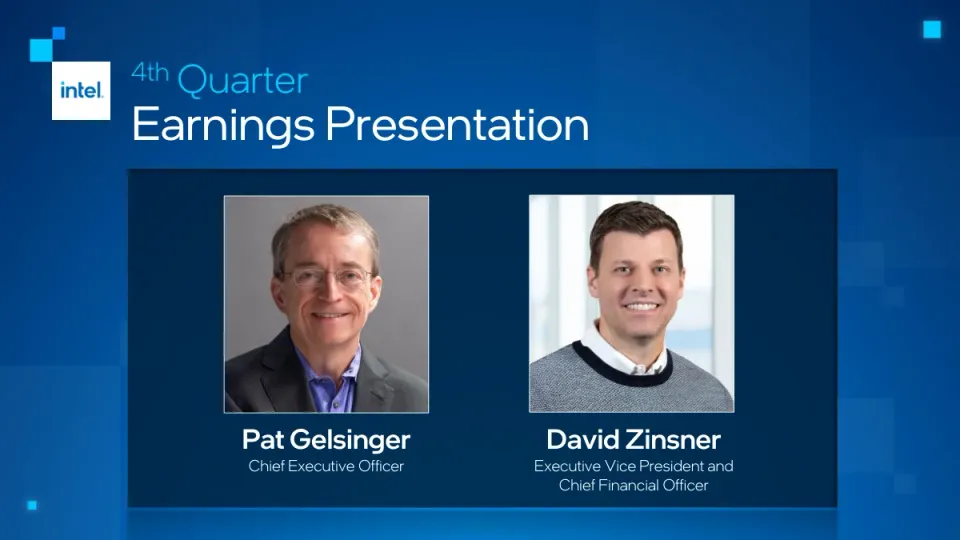
The deck is Intel's fourth-quarter 2023 earnings presentation, delivered by CEO Pat Gelsinger and CFO David Zinsner. It opens with a title slide naming both presenters, followed by a forward-looking statements and non-GAAP disclosure slide. An executive summary then sets out the quarter's beat on revenue, gross margin and EPS, along with themes on technology leadership and AI. A transformation slide lays out execution, system foundry and AI everywhere as three columns, with financial discipline as a base bar. Financial highlights follow, with three large number cards for revenue, gross margin and EPS, and then segment slides for the Client Computing, Data Center and AI, Network and Edge, Intel Foundry Services and Mobileye groups, each pairing a bar chart with short bullet commentary. An outlook slide gives Q1 2024 guidance in three cards, and the deck closes with an appendix of reconciliation tables between GAAP and non-GAAP figures. The layout is clean and consistent, with strong use of large numerals and simple charts.
Slides worth studying
- Slide 5: Three large number cards with a short subline each make the headline results readable at a glance.
- Slide 6: Paired bar charts with a bold headline and a short commentary column show the change in revenue and operating income clearly.
- Slide 11: The outlook uses the same card system as the highlights, so guidance reads as a continuation of the results.
- Slide 4: A three-column diagram with a base bar organises the strategy into one visual summary rather than a list of bullets.
Details
- Company: Intel
- Year: 2024
- Type: Investor presentation
- Industry: Semiconductors
- Pages: 15
The hosted copy of this deck is being prepared. Newsletter readers will find the download here.
Review score: 7 out of 10, Effective
Presentation quality, judged with the SlideDeck Co review heuristic. Ask, evidence and idea merit are not rated here.
The strength is a consistent segment template that separates cause from figure: slides 6 to 8 each show two charts with the change in the chart title and a side panel split into Revenue and Operating Income reasons, and the reasons include unfavourable ones, such as CPU TAM contraction and ongoing competitive pressure on slide 7 beside revenue down 10% and operating income down 38%. Slide 5 gives $15.4B, 48.8% and $0.54 against both prior year and the October outlook, and a divider on slide 10 separates the outlook. The bottleneck is thin coverage around that core. Slide 4 crowds three collages, a map, a product wheel and a footer band onto one page with labels too small and too many to follow, the charts compare only two quarters so no trend is visible, and slide 11 guides to 44.5% and $0.13 with no drivers even though that is a sharp step down from the quarter just reported. Each segment panel also gives a quarter of its space to a product photo.
Worth keeping: Keep the split Revenue and Operating Income reason panel beside the charts on slides 6 to 8.
Most useful repair: Add driver lines and the sequential comparison to slide 11, and cut slide 4 down to the three headings with two or three readable claims each.
What would change the score: If the audience only ever saw slide 4 with a speaker walking through it, its density would matter less, though the unexplained outlook would still hold the score at 7.
Confidence high. 15 of 15 pages inspected on contact sheets, 12 at readable size. Reviewed 2026-11-15. Model-assisted review (claude-fable-5-2, in session).
Full text of the slides (15 slides)
Every slide's words and a description of its charts and images, so the deck can be searched and rebuilt. Also available as Markdown.
Slide 1
intel
4th Quarter
Earnings Presentation
Pat Gelsinger
Chief Executive Officer
David Zinsner
Executive Vice President and
Chief Financial Officer
Visuals: Two head-and-shoulders portrait photographs of men, each boxed with a thin light border and no cropping shape. Left: Pat Gelsinger, grey-haired, wearing rimless glasses, a dark grey blazer and blue collared shirt, smiling, plain mid-grey studio backdrop, even frontal soft lighting. Right: David Zinsner, short dark-brown hair, smiling broadly showing teeth, navy-trimmed grey knit sweater over white collar, bright blurred window backdrop in pale blue and white, soft natural light. Both photos are square-cropped at about 21% of slide width by 40% of slide height. Also a decorative background of translucent blue square tiles and a small Intel logo mark (white square with blue 'intel' wordmark and registered mark) at top-left, plus small cyan squares at top-right and bottom-left.
Slide 2
Non-GAAP Financial Measures and Forward-Looking Statements
• This presentation contains non-GAAP financial measures. Intel gross margin, and earnings per share, including year-over-year comparisons, are presented on a non-GAAP basis. This presentation also includes a non-GAAP adjusted free cash flow (FCF) measure. The Appendix provides a reconciliation of these measures to the most directly comparable GAAP financial measure. The non-GAAP financial measures disclosed by Intel should not be considered a substitute for, or superior to, the financial measures prepared in accordance with GAAP. Please refer to “Explanation of Non-GAAP Measures” in our earnings released dated January 25, 2024 for a detailed explanation of the adjustments made to the comparable GAAP measures, the ways management uses the non-GAAP measures, and the reasons why management believes the non-GAAP measures provide investors with useful supplemental information.
• Statements in this presentation that refer to business outlook, plans, and expectations are forward-looking statements that involve risks and uncertainties. Such statements may include, but not be limited to, those regarding: our business plans and strategy and anticipated benefits therefrom; projections of our future financial performance, including future revenue, gross margins, capital expenditures, and cash flows; future cash requirements and the availability and sufficiency of funding; expected returns to stockholders, such as stock repurchases and dividends; future products, services and technologies, and the expected goals, timeline, ramps, progress, availability, production, regulation and benefits of such products, services and technologies, including future process nodes and packaging technology, product roadmaps, schedules, future product architectures, expectations regarding process performance, per-watt parity, and metrics and expectations regarding product and process leadership; investment plans, and impacts of investment plans; internal and external manufacturing plans; future production capacity and product supply; supply expectations; plans and goals related to Intel’s foundry business, including with respect to anticipated customers, future manufacturing capacity and service, technology and IP offerings; expected timing and impact of acquisitions, divestitures, and other significant transactions; expected completion and impacts of restructuring activities and cost-saving or efficiency initiatives; future social and environmental performance goals, measures, strategies and results; our anticipated growth, future market share, and trends in our businesses and operations; projected market trends; anticipated trends and impacts related to industry component, substrate, and foundry capacity utilization, shortages and constraints; expectations regarding government incentives; technology trends, such as AI; environmental and economic conditions; geopolitical tensions and conflicts and their potential impact on our business; tax- and accounting-related expectations; expectations regarding certain sanctioned parties; and other characterizations of future events or circumstances.
• Such statements involve many risks and uncertainties that could cause our actual results to differ materially from those expressed or implied, including: the high level of competition and rapid technological change in our industry; the significant long-term and inherently risky investments we are making in R&D and manufacturing facilities that may not realize a favorable return; the complexities and uncertainties in developing and implementing new semiconductor products and manufacturing process technologies; our ability to time and scale our capital investments appropriately and successfully secure favorable alternative financing arrangements and government grants; implementing new business strategies and investing in new business and technologies; changes in demand for our products; macroeconomic conditions and geopolitical tensions and conflicts, including geopolitical and trade tensions between the US and China, the impacts of Russia's war on Ukraine, tensions and conflict affecting Israel, and rising tensions between the US and Taiwan; the evolving market for products with AI capabilities; our complex global supply chain, including from disruptions, delays, trade tensions and conflicts, or shortages; product defects, errata and other product issues, particularly as we develop next-generation products and implement next-generation manufacturing process technologies; potential security vulnerabilities in our products; increasing and evolving cybersecurity threats and privacy risks; IP risks including related litigation and regulatory proceedings; the need to attract, retain, and motivate key talent; strategic transactions and investments; sales-related risks, including customer concentration and the use of distributors and other third parties; our significantly reduced return of capital in recent years; our debt obligations and our ability to access sources of capital; complex and evolving laws and regulations across many jurisdictions; fluctuations in currency exchange rates; changes in our effective tax rate; catastrophic events; environmental, health, safety, and product regulations; our initiatives and new legal requirements with respect to corporate responsibility matters; and other risks and uncertainties described in this presentation, our earnings release dated January 25, 2024, our 2023 Annual Report on Form 10-K and our other filings with the SEC
• Unless specifically indicated otherwise, the forward-looking statements in this presentation do not reflect the potential impact of any divestitures, mergers, acquisitions, or other business combinations that have not been completed as of the date of this presentation. All information in this presentation reflects management’s views as of January 25, 2024, unless an earlier date is specified. We do not undertake, and expressly disclaim any duty, to update such statements, whether as a result of new information, new developments, or otherwise, except to the extent that disclosure may be required by law.
2
Slide 3
Executive Summary
Q4 beat on Revenue, Gross Margin and EPS
Strong sequential revenue growth in client, server, network
Continued operating leverage and expense discipline, achieved FY $3B cost savings
Re-establishing technology leadership
Closing in on 5N4Y: Intel 3 mfg ready; entering angstrom era with Intel 20A & Intel 18A
2023 IFS momentum: 4 Intel 18A + 5 advanced packaging wins; >$10B lifetime deal value
Executing strategy to bring AI everywhere
Launched Core Ultra AI PC and 5th Gen Xeon, the unquestioned AI CPU leader
Enabling AI across the continuum, propelling $1T semi-industry revenue by 2030
3
Visuals: One photograph: an Intel Core processor (chip package) viewed straight on, its silver metallic integrated heat spreader centred, with the printed 'intel' wordmark in grey at upper left and 'CORE' in large grey-to-black letters with a trademark TM mark at upper right of the word. The green printed circuit board border surrounds the silver lid with small gold contact pads along the edges and a small pin-1 triangle at bottom left. Lighting is soft and diffuse from upper left, producing a diagonal sheen across the silver lid. Dominant colours are silver-grey, teal-green board and a deep blue surround. The photo is boxed, not full-bleed, with a soft dark drop shadow at its lower edge and no overlay. Corner logo: Intel wordmark in white at bottom right. Three translucent dark navy panels hold the body text; no charts, tables or icons.
Slide 4
Driving Our Transformation
Execution
System Foundry
AI Everywhere
Intel
7
Sapphire
Rapids
Emerald
Rapids
Intel
4
EUV
Meteor
Lake
Intel
3
Sierra
Forest
Granite
Rapids
Intel
20A
PowerVia, +
RibbonFET
Arrow
Lake
Intel
18A
Clearwater
Forest
Panther
Lake
Closing in on 5N4Y
At Scale, Geo Diverse, and Resilient
Transistor Leadership at Intel 18A
Unique Advanced Packaging IP
Collaborations with UMC and Tower Semi
Wafer & Advanced Packaging Wins,
expected >$10B lifetime deal value
intel
Cloud & Enterprise
AI
1 oneAPI
openVINO
GAUDI
XEON
GPU
XEON
GPU
AGILEX
intel CORE ULTRA
CORE
ARC
Edge
AI PC
Financial Discipline
Smart Capital
US/EU CHIPS, SCIPs, Customer Commitments
Operational Efficiencies
>$3B in FY'23, Internal Foundry Model
Value Unlock
Mobileye, PSG, IMS
4
Visuals: Execution column: five rows, each with an Intel process-node tag and a chip or technology image. Intel 7 tag (white-grey gradient square, navy text) beside a dark grey-black chip image labelled Sapphire Rapids, and a second chip labelled Emerald Rapids. Intel 4 tag beside a violet-lit EUV image labelled EUV, and a blue-grey chip labelled Meteor Lake. Intel 3 tag beside a dark grey chip labelled Sierra Forest, and a small chip with a blue centre labelled Granite Rapids. Intel 20A tag beside a blue-lit transistor cross-section labelled PowerVia, + RibbonFET, and a layered stacked chip labelled Arrow Lake. Intel 18A tag beside a dark grey chip labelled Clearwater Forest, and a blue glossy chip labelled Panther Lake. A tall cyan-blue bar at the bottom reads Closing in on 5N4Y. The column background is a blue circuit-board and chip photograph with a bright blue glow at the lower left. System Foundry column: a light-blue world map with white location dots (about 12 dots over North America, Europe, Asia and Oceania, with one white star over the western United States) and a white intel logo at the left over the Americas. Behind the lower part is a darkened cleanroom photograph of workers in white bunny suits and masks, tinted blue. Five stacked cyan-blue rectangular bars list the statements. AI Everywhere column: a deep blue and purple circuit-board background. A large cyan-blue circle with a thin white outer ring and a thinner light-blue inner ring forms a loop. Top node: a cyan circle with a white cloud-and-server icon labelled Cloud & Enterprise. Right node: a cyan circle with a cloud-network icon labelled Edge. Bottom node: a cyan circle with a monitor and devices icon labelled AI PC. Centre: a larger cyan circle with a white AI chip icon. Around the loop are product logos: Intel Gaudi, Intel Xeon, Intel GPU (top row); Intel Xeon, Intel GPU, Intel Agilex (right column); Intel Core Ultra, Intel Core, Intel Arc (bottom row); and a white 1 oneAPI logo and openVINO logo at the left edge. Financial Discipline band: a bright cyan-to-blue gradient strip with a thin white double arrow across the title line, and three outlined boxes with cyan-white borders. Intel logo bottom right in white with a small registered mark.
Slide 5
Q4 Financial Highlights
$15.4B
Revenue
Up 10% YoY
$0.3B above Oct outlook 1
48.8%
Gross Margin
Up 5 ppt YoY
2.3 ppt above Oct outlook 1
$0.54
EPS
Up 260% YoY
$0.10 above Oct outlook 1
1 Comparisons are based on the mid-point of revenue outlook
intel
5
Visuals: Three stat panels, no chart, table, photograph or icon. Panel 1 (left): large figure $15.4B, label Revenue, sub-line Up 10% YoY (bold), then $0.3B above Oct outlook with superscript 1. Panel 2 (centre): 48.8%, label Gross Margin, Up 5 ppt YoY (bold), then 2.3 ppt above Oct outlook with superscript 1. Panel 3 (right): $0.54, label EPS, Up 260% YoY (bold), then $0.10 above Oct outlook with superscript 1. Each panel is a flat dark navy rectangle with a soft reflection shadow fading downward beneath it. Faint lighter translucent rectangles and squares sit in the background at lower left, lower right and upper left, partly behind the panels.
Slide 6
Client Computing Group (CCG)
Revenue up 33%
$6.6B
$8.8B
Q4'22
Q4'23
Operating Income up 451%
Operating
Margin 8%
$0.5B
Operating
Margin 33%
$2.9B
Q4'22
Q4'23
Revenue
• Healthier alignment of sell-in and sell-
through
Operating Income
• Increased revenue and sell through of
reserved inventory
6
Visuals: Left panel, chart 1: vertical bar chart titled 'Revenue up 33%', x-axis categories Q4'22 and Q4'23, no axis values or units printed. Series 'Revenue' with labelled values: Q4'22 $6.6B (bar top about 49% of slide height), Q4'23 $8.8B (bar top about 38%). Bars are about 9.8% wide, with cyan-to-blue gradient fill from about #00C8FF at the top to about #0068B8 at the bottom. No legend. No highlighted points. Left panel, chart 2: vertical bar chart titled 'Operating Income up 451%', categories Q4'22 and Q4'23, no axis values printed. Series 'Operating Income' with labelled values: Q4'22 $0.5B, callout 'Operating Margin 8%' above it; Q4'23 $2.9B, callout 'Operating Margin 33%' above it. Bars are solid green #8BAE46 with a slight darker gradient toward the base (about #6E8A36). Q4'22 bar is about 9.8% wide and 2.6% tall; Q4'23 bar is about 9.9% wide and 13% tall. Right panel: photograph of an Intel Core processor chip (vertical card-shaped package, teal-cyan die with a black 'intel CORE' label) standing upright on a glowing surface of fine circuit-board lines. Composition: chip centred, slightly right of centre, seen from the front at a slight angle, with the surface receding into the lower part of the frame. Lighting: a soft white-blue glow from behind the chip and a rim of light on its edges. Dominant colours: near-black background, teal #1FB5C9 and cyan on the chip, icy blue-white on the surface. The photograph is boxed (rectangular, not cropped, not full-bleed) and sits directly under the 'Operating Income' text. No overlay or tint on the photo. Footer: Intel logo, white, lower right.
Slide 7
Data Center and AI Group (DCAI)
Revenue down 10%
Operating Income down 38%
$4.4B
$4.0B
Q4'22
Q4'23
$0.1B
Operating
Margin 3%
Q4'22
$0.1B
Operating
Margin 2%
Q4'23
Revenue
• CPU TAM contraction, ongoing competitive
pressure and PSG inventory correction
Operating Income
• Ramp of higher cost next gen products &
lower revenue offset by reduced spending
and sell through of reserved inventory
intel
7
Visuals: Two bar charts and one photograph. Chart 1: vertical bar chart titled 'Revenue down 10%'. Categories on the horizontal axis: Q4'22, Q4'23. No visible vertical axis, gridlines or units axis; bars are scaled proportionally. Series values labelled above each bar: Q4'22 $4.4B (tallest bar, about 413 px high on the 1125 px slide); Q4'23 $4.0B (about 376 px high, about 91% of the first bar). Bars are vertical gradient fills from bright cyan #00C8FF at the top to deeper blue #0070B8 at the bottom, with a thin pale horizontal baseline (#FFFFFF at about 60% opacity) under them. No legend. No highlighted points. Chart 2: vertical bar chart titled 'Operating Income down 38%'. Categories: Q4'22, Q4'23. Values labelled above each bar: Q4'22 $0.1B with 'Operating Margin 3%' above it; Q4'23 $0.1B with 'Operating Margin 2%' above it. Bars are flat olive-green #8BAE46, very short (about 36 px and 22 px high), sitting on a thin white baseline. No axis scale or legend. No highlighted points. Photograph: a product shot of an Intel Xeon Scalable Processor (5th Gen). Subject: a silver metal integrated heat spreader with the text 'intel' and 'xeon' in white-grey embossed letters, '5th Gen' and 'Intel Xeon Scalable Processor' in small print, lying at an angled three-quarter view on a green-gold circuit substrate edge. Composition: centred in the lower panel, about 80% of the frame width, not cropped, boxed (rectangular, sharp corners). Lighting: studio-style, soft highlights on the metal top, a diffuse blue glow at upper right, dark shadow beneath. Dominant colours: silver-grey, near-black #0A1A2A, navy blue #1B3F6B, with a bronze-gold edge. No overlay or tint on the photo.
Slide 8
Network and Edge Group (NEX)
Revenue down 24%
Operating Income down 110%
$1.9B
$1.5B
Q4'22
Q4'23
Operating
Margin 7%
$0.1B
Q4'22
Operating
Margin (1%)
($0.0B)
Q4'23
Revenue
• Continued demand softness and elevated
customer inventory
Operating Income
• Lower revenue offset by reduced spending
8
Visuals: Two bar-chart groups and one photograph. Chart 1: a column chart titled 'Revenue down 24%', with categories Q4'22 and Q4'23 on a shared baseline. Q4'22 is labelled $1.9B and drawn as a tall cyan column (about 49 percent of the chart height), Q4'23 is labelled $1.5B and drawn about 21 percent shorter. No axis scale or units are printed; bar heights are proportional to the labelled values. Columns use a vertical gradient from bright cyan at the top to deeper blue at the bottom. Chart 2: a column chart titled 'Operating Income down 110%' with categories Q4'22 and Q4'23. Q4'22 is a small green column labelled 'Operating Margin 7%' above the value $0.1B. Q4'23 is a near-zero green sliver labelled 'Operating Margin (1%)' above the value ($0.0B). Both green bars sit on the same baseline, colour #8BAE46. No axis or legend is printed. No highlighted points. Photograph: a close view of an Intel Xeon processor (white heatsink-free package with 'intel XEON' printed in blue-black type and the small line 'Xeon Scalable Processor') seated in a socket on a dark green circuit board. A blue glow and cool blue light come from the upper left, while heatsink fins fill the top and left of the frame. The photo is cropped to a rectangle and boxed, not full-bleed, with a slight blue tint. Dominant colours: deep navy, cyan-blue, dark green. Intel logo: small wordmark at bottom right, white.
Slide 9
Intel Foundry Services (IFS) / Revenue / Operating Income / $291M / $178M / Operating / Margin (19%) / ($34M) / Operating / Margin (39%) / ($113M) / Q4'22 / Q4'23 / Q4'22 / Q4'23 / • Revenue up 63% on accelerated traditional / packaging purchases / • Operating loss increased due to higher / investment to support long-term growth / Mobileye / Revenue / Operating Income / $565M / $637M / Operating / Margin 37% / $210M / Operating / Margin 38% / $242M / Q4'22 / Q4'23 / Q4'22 / Q4'23 / • Revenue up 13% YoY on EyeQ shipment growth / • Operating income up on stronger revenue / intel / 9
Visuals: Four bar charts in two panels, no legend and no axis lines or scale values. Left panel IFS Revenue (bar chart, no axis labels): Q4'22 $178M bar and Q4'23 $291M bar, both blue. Left panel IFS Operating Income (bar chart, values below baseline): Q4'22 ($34M) small green bar hanging down from the baseline, Q4'23 ($113M) larger green bar hanging down, with margin labels Operating Margin (19%) and Operating Margin (39%) above the values. Right panel Mobileye Revenue: Q4'22 $565M and Q4'23 $637M blue bars, values printed inside the bar tops. Right panel Mobileye Operating Income: Q4'22 $210M green bar with Operating Margin 37% above, Q4'23 $242M green bar with Operating Margin 38% above. Bars are vertical rectangles with a vertical gradient, blue bars from light cyan #00C2FF at top to deeper blue #0070C0 at bottom, green bars from olive-green #8DB544 at top to darker #5E8A30 at bottom. Baseline is a thin light grey-white line under each chart. Quarter labels Q4'22 and Q4'23 sit under each bar group. Background is a blue gradient with faint darker rectangles, no photographs.
Slide 10
Outlook
Visuals: Decorative translucent rectangles and squares float across the background, mostly at the edges: a large faint rectangle at top-left (about x 3 to 28, y 0 to 13), a small square below it (x 4 to 7, y 13 to 18), a tall rectangle at left-bottom (x 0 to 12.5, y 68 to 100), a square at x 12.5 to 17 and y 60 to 70, a small square at x 21 to 24 and y 90 to 95, a large rectangle at right (x 89 to 100, y 26 to 50), a small square at x 87 to 89 and y 45 to 50, a small square at x 92 to 94 and y 55 to 59, a square at x 85.5 to 93 and y 74 to 88, and a small square at x 93 to 95 and y 88 to 93. All are a slightly lighter or darker blue at low opacity. No photographs, charts or diagrams.
Slide 11
Q1 2024 Outlook / $12.2-13.2B / Revenue / Up 8% YoY 1 / 44.5% / Gross Margin 1 / Up 6.1 ppt YoY / $0.13 / EPS 1 / Up 425% YoY / 1 Revenue growth comparison, gross margin outlook and EPS outlook based on the mid-point of the revenue range / intel / 11
Visuals: Three identical dark navy rectangular panels (#002543 at 82% opacity), sharp corners, each with a soft dark reflection or shadow below its bottom edge, sitting on the blue background. Faint translucent blue square tiles appear at the corners and edges of the background, and the backdrop is a blue geometric pattern. No charts, photographs or photographic subjects. Logo: the intel wordmark in white at bottom right.
Slide 12
Appendix
Visuals: Decorative background only: a full-bleed blue radial gradient with faint, low-opacity translucent squares and rectangles, mostly slightly lighter or darker than the blue, clustered at the top-left, right edge and bottom-left corners. No photograph, chart, logo or icon. The word 'Appendix' is a picture of text with a white-to-lavender gradient fill, occupying the centre of the slide.
Slide 13
Reconciliation of Non-GAAP Actuals
Three Months Ended
Dec 30, 2023
Dec 31, 2022
GAAP gross margin percentage
45.7%
39.2%
Acquisition-related adjustments
1.9%
2.3%
Share-based compensation
1.1%
1.1%
Optane inventory impairment
--%
1.2%
Non-GAAP gross margin percentage
48.8%
43.8%
GAAP earnings (loss) per share attributable to Intel—diluted
$0.63
$(0.16)
Acquisition-related adjustments
0.08
0.09
Share-based compensation
0.18
0.18
Optane inventory impairment
--
0.04
Restructuring and other charges
(0.27)
0.11
(Gains) losses on equity investments, net
(0.02)
(0.04)
(Gains) losses from divestiture
(0.01)
(0.01)
Adjustments attributable to non-controlling interest
--
--
Income tax effects1
(0.05)
(0.06)
Non-GAAP earnings per share attributable to Intel—diluted
$0.54
$0.15
1 Contemplates a fixed long-term projected non-GAAP tax rate
intel
13
Visuals: Table titled 'Reconciliation of Non-GAAP Actuals' with a spanning header 'Three Months Ended' over two columns, 'Dec 30, 2023' and 'Dec 31, 2022'. Thin white horizontal rules sit under the spanning header, under the date headers, above and below the 'Non-GAAP gross margin percentage' values, and above and below the final 'Non-GAAP earnings per share' values. Rows, label then Dec 30, 2023 then Dec 31, 2022: GAAP gross margin percentage 45.7% 39.2%; Acquisition-related adjustments 1.9% 2.3%; Share-based compensation 1.1% 1.1%; Optane inventory impairment --% 1.2%; Non-GAAP gross margin percentage 48.8% 43.8%; GAAP earnings (loss) per share attributable to Intel—diluted $0.63 $(0.16); Acquisition-related adjustments 0.08 0.09; Share-based compensation 0.18 0.18; Optane inventory impairment -- 0.04; Restructuring and other charges (0.27) 0.11; (Gains) losses on equity investments, net (0.02) (0.04); (Gains) losses from divestiture (0.01) (0.01); Adjustments attributable to non-controlling interest -- --; Income tax effects1 (0.05) (0.06); Non-GAAP earnings per share attributable to Intel—diluted $0.54 $0.15. No charts, photographs or logos other than the Intel wordmark.
Slide 14
Reconciliation of Non-GAAP Q1 Outlook / Q1 2024 Outlook¹ / Q1 2023 Actuals / Approximately / GAAP gross margin percentage / 40.7% / 34.2% / Acquisition-related adjustments / 1.8% / 2.8% / Share-based compensation / 2.0% / 1.4% / Non-GAAP gross margin percentage / 44.5% / 38.4% / GAAP earnings (loss) per share attributable to Intel—diluted / $(0.25) / $(0.66) / Acquisition-related adjustments / 0.06 / 0.09 / Share-based compensation / 0.28 / 0.18 / Restructuring and other charges / -- / 0.01 / (Gains) losses on equity investments, net / (0.01) / (0.04) / (Gains) losses from divestiture / (0.01) / (0.01) / Adjustments attributable to non-controlling interest / -- / -- / Income tax effects² / 0.06 / 0.39 / Non-GAAP earnings (loss) per share attributable to Intel—diluted / $0.13 / $(0.04) / 1 Non-GAAP gross margin percentage and non-GAAP earnings (loss) per share attributable to Intel outlook based on the mid-point of the revenue range / 2 Contemplates a fixed long-term projected non-GAAP tax rate / 14 / intel.
Visuals: No charts, photographs or icons. The only data visual is a single financial reconciliation table, drawn as text on a dark navy panel. Columns: row label (left-aligned, indented for sub-items), 'Q1 2024 Outlook¹ / Approximately' (about x 58 to 71% of slide width, right-aligned figures), and 'Q1 2023 Actuals' (about x 72 to 84%, right-aligned figures). Rows, in order: GAAP gross margin percentage 40.7% | 34.2% (bold); Acquisition-related adjustments 1.8% | 2.8%; Share-based compensation 2.0% | 1.4%; Non-GAAP gross margin percentage 44.5% | 38.4% (bold, with a white rule above and below the figures); blank gap; GAAP earnings (loss) per share attributable to Intel—diluted $(0.25) | $(0.66) (bold); Acquisition-related adjustments 0.06 | 0.09; Share-based compensation 0.28 | 0.18; Restructuring and other charges -- | 0.01; (Gains) losses on equity investments, net (0.01) | (0.04); (Gains) losses from divestiture (0.01) | (0.01); Adjustments attributable to non-controlling interest -- | --; Income tax effects² 0.06 | 0.39; Non-GAAP earnings (loss) per share attributable to Intel—diluted $0.13 | $(0.04) (bold, with white rules above and below the figures). Rules: thin white horizontal lines under the column headers and above the two subtotal rows, spanning each figure column. No highlighted points and no legend.
Slide 15
intel®
Visuals: Logo: the white Intel wordmark 'intel' in lowercase bold geometric sans-serif letterforms with a small registered-trademark symbol (®) at the lower right of the 'l'. The wordmark is a single flat white image, about 36% of slide width and 25% of slide height, placed at x 32.0%, y 37.3%. Behind it, a full-bleed photographic-style background image (1920 by 1080 pixels) with a soft radial gradient from deep navy at the top corners to bright cerulean at the bottom centre, overlaid with faint translucent rectangular and square tiles in lighter and darker blue, plus a few small bright cyan squares at the top-right corner (about x 96%, y 4%), at the lower-left (about x 3%, y 94%), and a few tiles at the right edge. No people, no text other than the logo, no chart.
Download this deck
The hosted PDF of every library deck is free for readers of the SlideDeck Co newsletter. Join with your email and the viewer and download appear here.
Preparing a results presentation or business update of your own? The SlideDeck Co Standard Deck is a slide library for business reviews, updates and plans.







