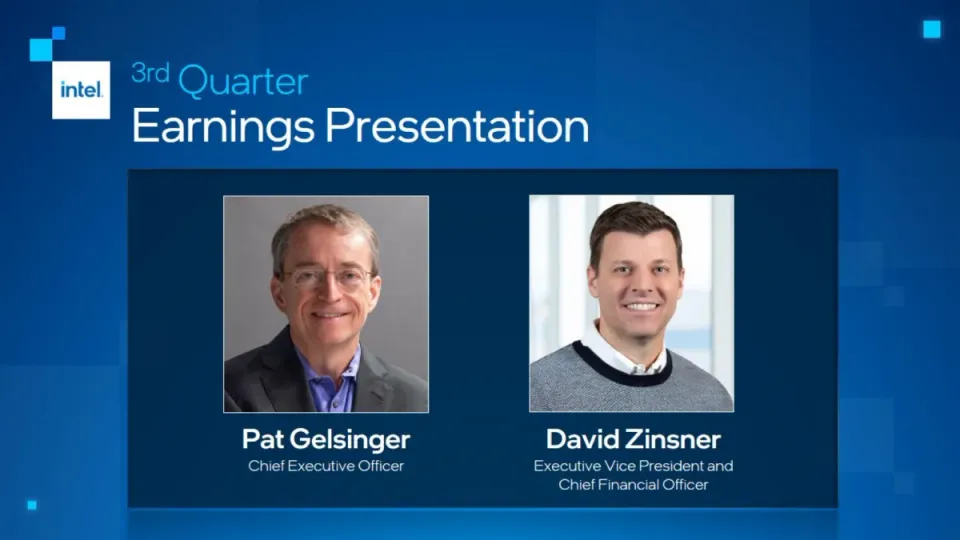
The deck opens with a title slide naming CEO Pat Gelsinger and CFO David Zinsner, followed by a disclaimer covering non-GAAP measures and forward-looking statements. The executive summary then lists three headline points: a third-quarter beat on revenue, gross margin and earnings per share; a push to re-establish technology leadership through process nodes and foundry wins; and an AI-everywhere strategy. Next, a transformation slide lays out execution milestones, foundry positioning and AI, framed by a financial discipline band. Third-quarter financial highlights follow. A series of segment slides covers Client Computing, Data Center and AI, Network and Edge, Intel Foundry Services and Mobileye. Each pairs two bar charts with two short bullets on revenue and operating income. The deck closes with a Q4 2023 outlook shown as three large figures for revenue, gross margin and EPS, and an appendix reconciling GAAP to non-GAAP measures in tables. Section dividers for Outlook and Appendix separate the parts. The executive summary and transformation slide compress much information into clear grids, and the segment slides use a consistent chart-plus-commentary layout that makes comparison easy.
The hosted copy of this deck is being prepared. Newsletter readers will find the download here.
Full text of the slides (15 slides)
Every slide's words and a description of its charts and images, so the deck can be searched and rebuilt. Also available as Markdown.
Slide 1
intel.
3rd Quarter
Earnings Presentation
Pat Gelsinger
Chief Executive Officer
David Zinsner
Executive Vice President and
Chief Financial Officer
Visuals: Two rectangular head-and-shoulders portrait photographs of men, boxed with a thin light-grey border, of equal size and aligned on the same top edge inside the dark panel. Left photo: Pat Gelsinger, a smiling older man with glasses, grey short hair, dark grey suit jacket and blue open-collared shirt, plain mid-grey backdrop, soft even studio lighting, centred framing, not cropped beyond the shoulders. Right photo: David Zinsner, a smiling man with short brown hair, white collar and navy-and-grey knit sweater, blurred bright window background in white and pale blue, soft natural lighting, centred framing. Also an Intel logo (white square with blue 'intel.' wordmark) at top-left, and small decorative blue square tiles at the top-left and top-right corners and one at bottom-left.
Slide 2
Non-GAAP Financial Measures and Forward-Looking Statements / • This presentation contains non-GAAP financial measures. Intel gross margin, and earnings per share, including year-over-year comparisons, are presented on a non-GAAP basis. This presentation / also includes a non-GAAP adjusted free cash flow (FCF) measure. The Appendix provides a reconciliation of these measures to the most directly comparable GAAP financial measure. The non- / GAAP financial measures disclosed by Intel should not be considered a substitute for, or superior to, the financial measures prepared in accordance with GAAP. Please refer to “Explanation of Non- / GAAP Measures” in our earnings released dated October 26, 2023 for a detailed explanation of the adjustments made to the comparable GAAP measures, the ways management uses the non- / GAAP measures, and the reasons why management believes the non-GAAP measures provide investors with useful supplemental information. / • Statements in this presentation that refer to business outlook, plans, and expectations are forward-looking statements that involve risks and uncertainties. Words such as “accelerate”, “achieve”, / “aim”, “ambitions”, “anticipate”, “believe”, “committed”, “continue”, “could”, “designed”, “estimate”, “expect”, “forecast”, “future”, “goals”, “grow”, “guidance”, “intend”, “likely”, “may”, “might”, “milestones”, / “next generation”, “objective”, “on track”, “opportunity”, “outlook”, “pending”, “plan”, “position”, “potential”, “possible”, “predict”, “progress”, “ramp”, “roadmap”, “seeks”, “should”, “strive”, “targets”, “to / be”, “upcoming”, “will”, “would”, and variations of such words and similar expressions are intended to identify such forward-looking statements, which may include statements regarding: our business / plans and strategy and benefits therefrom; projections of our future financial performance, including future revenue, gross margins, capital expenditures, and cash flows; future cash requirements and / the availability and sufficiency of funding; expected returns to stockholders, such as stock repurchases and dividends; future products, services and technologies, and the expected goals, timeline, / ramps, progress, availability, production, regulation and benefits of such products, services and technologies, including future process nodes and packaging technology, product roadmaps, / schedules, future product architectures, expectations regarding process performance, per-watt parity, and metrics and expectations regarding product and process leadership; investment plans, / and impacts of investment plans; internal and external manufacturing plans; future production capacity and product supply; supply expectations; plans and goals related to Intel’s foundry business, / including with respect to anticipated customers, future manufacturing capacity and service, technology and IP offerings; expected timing and impact of acquisitions, divestitures, and other significant / transactions; expected completion and impacts of restructuring activities and cost-saving or efficiency initiatives; future social, and environmental performance goals, measures, strategies and / results; our anticipated growth, future market share, and trends in our businesses and operations; projected market trends; anticipated trends and impacts related to industry component, substrate, / and foundry capacity utilization, shortages and constraints; expectations regarding government incentives; technology trends; environmental and economic conditions; COVID-19; geopolitical / conditions; tax- and accounting-related expectations; expectations regarding certain sanctioned parties; and other characterizations of future events or circumstances. / • Such statements involve many risks and uncertainties that could cause our actual results to differ materially from those expressed or implied, including: changes in demand for our products; changes / in product mix; the complexity and fixed cost nature of our manufacturing operations; the high level of competition and rapid technological change in our industry; the significant upfront investments / in R&D and our business, products, technologies, and manufacturing capabilities; vulnerability to new product development and manufacturing-related risks, including product defects or errata; risks / associated with a highly complex global supply chain; sales-related risks; potential security vulnerabilities in our products; cybersecurity and privacy risks; investment and transaction risk; IP risks and / risks associated with litigation and regulatory proceedings; evolving regulatory and legal requirements across many jurisdictions; geopolitical and international trade conditions; our debt obligations; / risks of large scale global operations; macroeconomic conditions; impacts of the COVID-19 or similar such pandemic; other risks and uncertainties described in this presentation, our earnings release / dated October 26, 2023, our 2022 Annual Report on Form 10-K and our other filings with the SEC. / • Unless specifically indicated otherwise, the forward-looking statements in this presentation do not reflect the potential impact of any divestitures, mergers, acquisitions, or other business / combinations that have not been completed as of the date of this presentation. All information in this presentation reflects management’s views as of October 26, 2023, unless an earlier date is / specified. We do not undertake, and expressly disclaim any duty, to update such statements, whether as a result of new information, new developments, or otherwise, except to the extent that / disclosure may be required by law. / intel. / 2
Visuals: Non-text elements: (1) a full-slide blue gradient background, lighter cobalt at the top fading to deep navy at the bottom; (2) a dark navy rectangle panel behind the body text, flat, with square corners, slightly darker than the background and with a subtle inner shadow along its top edge; (3) the Intel logo, the lowercase wordmark “intel” followed by a period, in a bright blue (#0068B5) at the bottom right, followed by the page number 2 in white. No photographs, charts, tables or icons.
Slide 3
Executive Summary
Chip image: intel. CORE TM
Q3 beat on Revenue, Gross Margin and EPS
Strong sequential revenue growth in client, edge, foundry; server revenue up QoQ
Operating leverage and expense discipline driving improved profitability
Re-establishing technology leadership
5N4Y nearing completion; 0.9 PDK on Intel 18A; wafer & adv packaging customer wins
EUV production in US/Europe; 1st High-NA EUV; glass substrate innovation
On a mission to deliver AI everywhere
Enabling AI across the continuum, propelling $1T semi-industry revenue by 2030
Ushering in the age of the AI PC; leadership TCO on Gaudi and Xeon
intel.
3
Visuals: One photograph of an Intel Core processor chip, shown at a slight front-on angle with no perspective distortion. It has a green printed circuit board border (#1C8F6A) with gold contact pads along the top and bottom edges, and a large brushed silver metal heat spreader (#C9D1D9 to #7F8C98) in the centre, with rounded corners and a bevelled inset. The spreader carries the black and grey wordmark 'intel.' above the larger word 'CORE' with a small TM. Lighting comes from the upper left, producing a soft highlight on the metal. The image is fully visible, not cropped, boxed with a small drop shadow, and has no tint. Three dark navy translucent rectangles sit to the right with no icons or charts. A faint, blurred line of text sits under the bottom panel, barely legible.
Slide 4
Driving Our Transformation / Execution / Foundry / Artificial Intelligence / Intel 7 / Sapphire Rapids / Emerald Rapids / Intel 4 / EUV / Meteor Lake / Intel 3 / Sierra Forest / Granite Rapids / Intel 20A / PowerVia + RibbonFET / Arrow Lake / Intel 18A / Clearwater Forest / Panther Lake / On-Track or Ahead / intel / Wafer & Advanced Packaging Wins / At Scale, Geo Diverse, and Resilient / Open System Foundry / Transistor Leadership at Intel 18A / Unique Advanced Packaging IP / Cloud & Enterprise / Gaudi / Xeon / GPU / Xeon / 1 oneAPI / OpenVINO / AI / GPU / Edge / Agilex / Core Ultra / Core / Arc / AI PC / Financial Discipline / Smart Capital / US/EU CHIPS, SCIPs, Customer Commitments / Operational Efficiencies / $3B in FY'23, Internal Foundry Model / Value Unlock / Mobileye, IMS, PSG / intel / 4
Visuals: Execution panel: five stacked process tiles labelled Intel 7, Intel 4, Intel 3, Intel 20A and Intel 18A, each beside a chip render. Chip renders are Sapphire Rapids, Emerald Rapids, EUV (a purple-lit lithography image), Meteor Lake, Sierra Forest, Granite Rapids, PowerVia + RibbonFET (a blue cross-section of a transistor), Arrow Lake, Clearwater Forest and Panther Lake. Foundry panel: a light-blue world map with dots marking fab sites, over a faded photo of a semiconductor cleanroom, with five stacked labelled bars. Artificial Intelligence panel: a hub diagram with a large AI circle at the centre, two thin concentric white rings, and four satellite circles: Cloud & Enterprise (top), Edge (right), AI PC (bottom) and oneAPI/OpenVINO (left). Icons of Gaudi, Xeon, GPU, Agilex, Core Ultra, Core and Arc sit inside the rings. The Financial Discipline band carries a double-headed arrow line behind its heading, with three outlined boxes below.
Slide 5
Q3 Financial Highlights
$14.2B
Revenue
Down 8% YoY
$0.8B above July outlook1
45.8%
Gross Margin
Flat YoY
2.8 ppt above July outlook1
$0.41
EPS
Up 11% YoY
$0.21 above July outlook1
1 Comparisons are based on the mid-point of revenue outlook
intel.
5
Visuals: No charts, photographs, icons or illustrations. Three dark navy rectangular stat panels, each with a soft drop shadow and faint reflection beneath its lower edge, displaying the figures $14.2B (Revenue), 45.8% (Gross Margin) and $0.41 (EPS). Bottom-right Intel wordmark logo with blue dot.
Slide 6
Client Computing Group (CCG)
Revenue down 3%
$8.1B
$7.9B
Q3'22
Q3'23
Operating Income up 43%
Operating Margin 18%
$1.4B
Operating Margin 26%
$2.1B
Q3'22
Q3'23
Revenue
Lower on overall TAM, partially offset by stabilizing OEM inventory
Operating Income
Higher on reduced inventory reserves and spending discipline
intel.
6
Visuals: Two bar charts on dark navy panels, with no axes, gridlines or legend. Chart 1 'Revenue down 3%': vertical bars in cyan-blue, Q3'22 labelled $8.1B (about tall) and Q3'23 labelled $7.9B (slightly shorter), x-axis labels Q3'22 and Q3'23, no units beyond $B. Chart 2 'Operating Income up 43%': vertical bars in lime green, Q3'22 labelled Operating Margin 18% and $1.4B, Q3'23 labelled Operating Margin 26% and $2.1B; bars are scaled so the Q3'23 bar is about 1.5 times the height of the Q3'22 bar; x-axis labels Q3'22 and Q3'23. Bars sit on thin light grey baselines. Right-hand photograph: an illustration of a glowing blue circuit board with a central chip package bearing the Intel CORE logo in white on a dark blue rectangle; the chip is centred, lines of light run horizontally and vertically, the image is boxed in a rectangle with straight edges, full-width of its panel, not cropped, lit by blue glow, with dark blue vertical bars at the left and right edges. Intel logo bottom right in white.
Slide 7
Data Center and AI Group (DCAI)
Revenue down 10%
$4.3B
$3.8B
Q3'22
Q3'23
Operating Income up 151%
Operating Margin (3%)
($0.1B)
Operating Margin 2%
$0.1B
Q3'22
Q3'23
Revenue
• Lower on reduced CPU TAM and competitive pressure
Operating Income
• Higher on spending discipline and lower start-up costs
intel.
7
Visuals: Left panel contains two bar charts sharing the Q3'22 and Q3'23 categories. Chart 1: titled 'Revenue down 10%', vertical bars in bright cyan-blue gradient, baseline at bottom, no axis values printed. Q3'22 bar labelled $4.3B (about tallest bar); Q3'23 bar labelled $3.8B (about 88% of the height of the Q3'22 bar). Category labels Q3'22 and Q3'23 below the bars. Chart 2: titled 'Operating Income up 151%', vertical bars in olive-green (#7DA33A approx.) horizontal bars on a baseline, both below zero: Q3'22 bar labelled 'Operating Margin (3%)' and '($0.1B)' extending slightly below the baseline; Q3'23 bar labelled 'Operating Margin 2%' and '$0.1B' sitting just above the baseline. No axes, no legend, no gridlines. Right panel photo: close-up of an Intel Xeon Scalable processor chip on a glowing blue printed circuit board with traces, shown in a rectangle with a blue tint and slight dark vignette; the chip is centre-right, silver-white, with 'intel XEON' printed on top; framing is cropped at the edges.
Slide 8
Network and Edge Group (NEX)
Revenue down 32%
$2.1B
$1.5B
Q3'22
Q3'23
Operating Income down 91%
Operating Margin 9%
$0.2B
Operating Margin 1%
$0.0B
Q3'22
Q3'23
Revenue
• Lower on TAM softness and elevated customer inventories
Operating Income
• Lower on reduced revenue, partially offset by expense discipline
intel.
8
Visuals: Two bar charts on the left panel, with no printed axes or gridlines. Chart 1 is titled 'Revenue down 32%' with bars for Q3'22 at $2.1B (tall, light blue) and Q3'23 at $1.5B (shorter, light blue), labelled above each bar, category labels below. Chart 2 is titled 'Operating Income down 91%' with bars for Q3'22 at $0.2B labelled 'Operating Margin 9%' (green bar, short) and Q3'23 at $0.0B labelled 'Operating Margin 1%' (very thin green bar). No legend; no highlighted points. Right panel bottom: a photograph of an Intel Xeon processor chip, a silver-grey chip with blue glowing edges, sitting on a blue printed circuit board pattern, centred and in full-width box, with a dark blue overlay tint; the chip is slightly right of centre, viewed from above at an angle, lit from the side with blue light.
Slide 9
Intel Foundry Services (IFS)
Mobileye
Revenue
Operating Income
$78M
$311M
Operating Margin (115%)
($90M)
Operating Margin (28%)
($86M)
Q3'22
Q3'23
Q3'22
Q3'23
Revenue
Operating Income
$450M
$530M
Operating Margin 32%
$142M
Operating Margin 32%
$170M
Q3'22
Q3'23
Q3'22
Q3'23
• Revenue up 299% YoY on higher packaging and IMS tool sales
• Operating loss improved on higher revenue, partially offset by increased investment to support long-term growth
• Revenue up 18% YoY on higher demand for EyeQ products
• Operating income up 20% YoY on higher revenue
intel
9
Visuals: Four vertical bar charts in two panels, all with the same structure: category labels Q3'22 and Q3'23 along the horizontal baseline, no visible value axis, no gridlines, no legend. Left panel, Revenue (blue bars, gradient from bright cyan #1AC3F0 at top to deeper blue #1576C9 at base): Q3'22 bar labelled $78M, short; Q3'23 bar labelled $311M, about four times taller. Left panel, Operating Income (green bars #7AB648 with a darker base, plotted below a baseline, showing losses): Q3'22 labelled Operating Margin (115%) and ($90M); Q3'23 labelled Operating Margin (28%) and ($86M); both bars are short and nearly equal in height, the Q3'22 bar slightly longer. Right panel, Revenue (blue gradient bars): Q3'22 labelled $450M, Q3'23 labelled $530M, Q3'23 about 15% taller. Right panel, Operating Income (green bars): Q3'22 labelled Operating Margin 32% and $142M; Q3'23 labelled Operating Margin 32% and $170M, slightly taller than Q3'22. No bars are highlighted. Intel logo in white at bottom-right, lowercase wordmark with a small blue accent dot over the i.
Slide 10
Outlook
intel.
10
Visuals: Decorative background of faint translucent blue squares and rectangles scattered at the top-left, right edge, lower-left and lower-right, slightly lighter than the field, forming a subtle tiled pattern. Plus the Intel wordmark logo in white at bottom right. No photographs or charts.
Slide 11
Q4 2023 Outlook
$14.6-15.6B
Revenue
Up 8% YoY1
46.5%
Gross Margin1
Up 2.7 ppt YoY
$0.44
EPS1
Up 193% YoY
1 Revenue growth comparison, gross margin outlook and EPS outlook based on the mid-point of the revenue range
intel.
11
Visuals: Three dark navy rectangular panels (no visual photograph or chart) arranged side by side as big-number KPI cards. Panel 1 contains '$14.6-15.6B' over 'Revenue' and 'Up 8% YoY1'; panel 2 contains '46.5%' over 'Gross Margin1' and 'Up 2.7 ppt YoY'; panel 3 contains '$0.44' over 'EPS1' and 'Up 193% YoY'. Each panel has a faint soft shadow beneath it and slightly darker edges, suggesting a subtle raised block. Small Intel logo bottom-right in white. No chart, no icons other than the logo.
Slide 12
Appendix
Visuals: Faint translucent square and rectangular tiles are scattered at the edges: a rectangle across the top left (about x 6.8%, y 0%, 20% x 12.9%), a small square below it at about x 4.3%, y 13%, a tall rectangle down the bottom left (about x 0%, y 67.6%, 12.4% x 32.4%), a square at about x 12.5%, y 59.1%, a rectangle at the right edge (about x 89.8%, y 25.3%, 10.3% x 24%), a smaller square at about x 93%, y 46%, a square at about x 85.3%, y 73.8%, 7.8% x 13.8%, a small square at about x 93.2%, y 88%, and a small square at about x 21.1%, y 89.6%. Each tile is a slightly lighter or darker blue at low opacity, with no outlines.
Slide 13
Reconciliation of Non-GAAP Actuals
Three Months Ended
Sep 30, 2023
Oct 1, 2022
GAAP gross margin percentage
Acquisition-related adjustments
Share-based compensation
Non-GAAP gross margin percentage
GAAP earnings (loss) per share attributable to Intel—diluted
Acquisition-related adjustments
Share-based compensation
Restructuring and other charges
(Gains) losses on equity investments, net
(Gains) losses from divestiture
Adjustments attributable to non-controlling interest
Income tax effects1
Non-GAAP earnings (loss) per share attributable to Intel—diluted
42.5%
42.6%
2.1%
2.2%
1.2%
1.1%
45.8%
45.9%
$0.07
$0.25
0.08
0.09
0.18
0.19
0.19
0.16
0.05
0.03
(0.01)
(0.01)
--
--
(0.15)
(0.34)
$0.41
$0.37
1 Contemplates a fixed long-term projected non-GAAP tax rate
intel
13
Visuals: Table: columns are (1) row label, (2) Sep 30, 2023, (3) Oct 1, 2022, with a 'Three Months Ended' spanning header above the two value columns. Rows in order: GAAP gross margin percentage 42.5% / 42.6%; Acquisition-related adjustments 2.1% / 2.2%; Share-based compensation 1.2% / 1.1%; Non-GAAP gross margin percentage 45.8% / 45.9%; (blank spacer row); GAAP earnings (loss) per share attributable to Intel—diluted $0.07 / $0.25; Acquisition-related adjustments 0.08 / 0.09; Share-based compensation 0.18 / 0.19; Restructuring and other charges 0.19 / 0.16; (Gains) losses on equity investments, net 0.05 / 0.03; (Gains) losses from divestiture (0.01) / (0.01); Adjustments attributable to non-controlling interest -- / --; Income tax effects1 (0.15) / (0.34); Non-GAAP earnings (loss) per share attributable to Intel—diluted $0.41 / $0.37. Thin white horizontal rules sit above the Sep 30 and Oct 1 value columns: under the column headers, above the 45.8%/45.9% subtotal, and above and below the final $0.41/$0.37 total. No charts, photographs or icons other than the Intel logo.
Slide 14
Reconciliation of Non-GAAP Q4 Outlook
Q4 2023 Outlook1 / Q4 2022 Actuals
Approximately
GAAP gross margin percentage / 43.3% / 39.2%
Acquisition-related adjustments / 2.0% / 2.3%
Share-based compensation / 1.2% / 1.1%
Optane inventory impairment / -- / 1.2%
Non-GAAP gross margin percentage / 46.5% / 43.8%
GAAP earnings (loss) per share attributable to Intel-diluted / $0.23 / $(0.16)
Acquisition-related adjustments / 0.08 / 0.09
Share-based compensation / 0.19 / 0.18
Optane inventory impairment / -- / 0.04
Restructuring and other charges / 0.01 / 0.11
(Gains) losses on equity investments, net / -- / (0.04)
(Gains) losses from divestiture / (0.01) / (0.01)
Adjustments attributable to non-controlling interest / (0.01) / --
Income tax effects2 / (0.05) / (0.06)
Non-GAAP earnings (loss) per share attributable to Intel-diluted / $0.44 / $0.15
1 Non-GAAP gross margin percentage and non-GAAP earnings (loss) per share outlook based on the mid-point of the revenue range
2 Contemplates a fixed long-term projected non-GAAP tax rate
intel. 14
Visuals: A table, with no chart, photograph or illustration. Columns: row label (left, no header), Q4 2023 Outlook1 Approximately (values right-aligned), Q4 2022 Actuals (values right-aligned). Rows: GAAP gross margin percentage 43.3% / 39.2%; Acquisition-related adjustments 2.0% / 2.3%; Share-based compensation 1.2% / 1.1%; Optane inventory impairment -- / 1.2%; Non-GAAP gross margin percentage 46.5% / 43.8% (bold, with rules above and below); GAAP earnings (loss) per share attributable to Intel-diluted $0.23 / $(0.16) (bold); Acquisition-related adjustments 0.08 / 0.09; Share-based compensation 0.19 / 0.18; Optane inventory impairment -- / 0.04; Restructuring and other charges 0.01 / 0.11; (Gains) losses on equity investments, net -- / (0.04); (Gains) losses from divestiture (0.01) / (0.01); Adjustments attributable to non-controlling interest (0.01) / --; Income tax effects2 (0.05) / (0.06); Non-GAAP earnings (loss) per share attributable to Intel-diluted $0.44 / $0.15 (bold, with rules above and below). Column headers are underlined by thin white rules.
Slide 15
intel®
Visuals: Logo: the Intel wordmark 'intel' in lowercase, set in a bold geometric sans-serif, with a small ® registered mark at the lower right of the 'l'. It is white and fills about one third of the slide width. Decorative elements: faint, slightly lighter blue translucent rectangles and squares at the top left, top centre-right, right edge, lower right, and lower left, plus two small bright cyan (#00B4F0) squares, one at the top right corner and one at the lower left corner. No photograph, chart or diagram.