
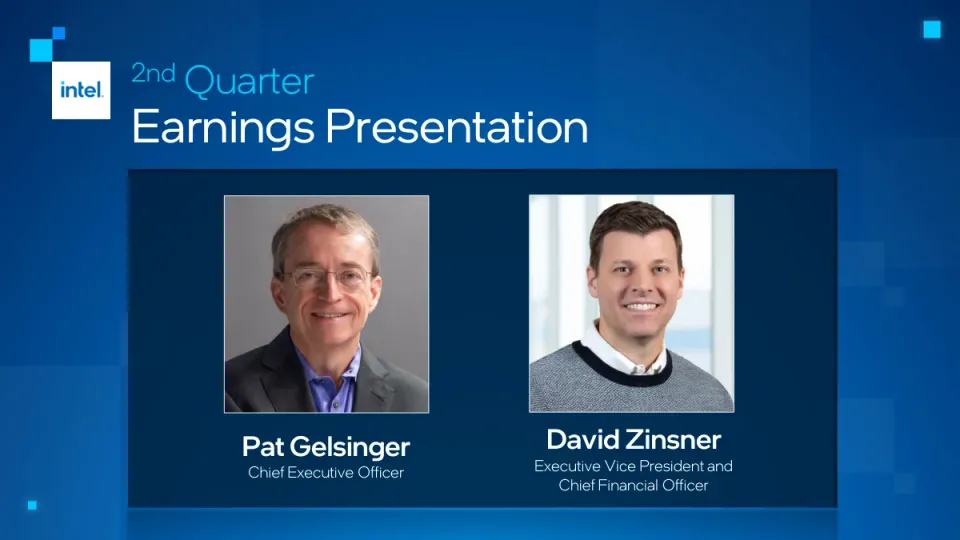
The deck is Intel's second-quarter 2023 earnings presentation, delivered by CEO Pat Gelsinger and CFO David Zinsner. It opens with a title slide naming both speakers, then a slide of non-GAAP and forward-looking statement disclosures. An executive summary follows, listing the quarter's beats on revenue, gross margin and EPS, along with priorities around compute demand, AI and supply chain. The strategy section covers process and manufacturing milestones and product updates across the client, data center and edge businesses. The financial section walks through quarterly highlights, then each operating group (Client Computing, Data Center and AI, Network and Edge, Mobileye and Intel Foundry Services), with a bar chart and short cause-and-effect bullets per segment. It closes with a Q3 2023 outlook showing revenue, gross margin and EPS ranges, followed by an appendix with GAAP to non-GAAP reconciliations. Slides worth seeing are the executive summary, which reduces the quarter to three headline statements, and the segment slides, which pair one large bar chart with two or three short reasons for each change.
Slides worth studying
- Slide 5: Three large headline numbers in equal tiles, each with a one-line comparison underneath, make the quarter readable at a glance.
- Slide 6: Paired revenue and operating income bars with a short cause list beside them show the change and its drivers on one slide.
- Slide 3: The executive summary groups its points under three bold headlines with short supporting lines, a clear hierarchy for a summary slide.
Details
- Company: Intel
- Year: 2023
- Type: Investor presentation
- Industry: Semiconductors
- Pages: 15
The hosted copy of this deck is being prepared. Newsletter readers will find the download here.
Review score: 7 out of 10, Effective
Presentation quality, judged with the SlideDeck Co review heuristic. Ask, evidence and idea merit are not rated here.
The deck is clean and honest about a weak quarter, and a reader can find each headline number at once. Slide 5 states revenue $12.9B down 15% YoY, gross margin 39.8% down 5.0 ppts and EPS $0.13 down 54%, each with its distance from the April outlook, and slide 11 gives the Q3 revenue range $12.9-13.9B with a footnote that margin and EPS are at the mid-point. The bottleneck is how little each segment page says. Slides 6 and 7 use a full page for two pairs of bars, one bullet per measure and a decorative chip image, and the segment tables of earlier years (volume, price, sub-segment) are gone. Slide 7 headlines 'Operating Income down 101%' over bars of ($0.1B) and ($0.2B) that are barely visible, and the deck has no cash flow page and no full-year view.
Worth keeping: Keep the three-tile layout on slides 5 and 11, where each figure carries its YoY change and its position against the prior outlook.
Most useful repair: On slides 6 and 7 replace the product image with a short table of volume, price and sub-segment movement, and add a cash flow page before slide 10.
What would change the score: Slide 8 (Network and Edge Group) and slide 13 were seen only on contact sheets; a fuller explanation there would not change the pattern on slides 6, 7 and 9, so the score would move only if a cash or full-year exhibit exists outside this file.
Confidence high. 15 of 15 pages inspected on contact sheets, 12 at readable size. Reviewed 2026-11-15. Model-assisted review (claude-fable-5-2, in session).
Full text of the slides (15 slides)
Every slide's words and a description of its charts and images, so the deck can be searched and rebuilt. Also available as Markdown.
Slide 1
2nd Quarter / Earnings Presentation / Pat Gelsinger / Chief Executive Officer / David Zinsner / Executive Vice President and / Chief Financial Officer
Visuals: Two boxed head-and-shoulders portrait photographs. Left: Pat Gelsinger, a smiling man with grey hair and thin wire-rimmed glasses, wearing a dark grey suit jacket over a blue collared shirt, against a plain mid-grey backdrop, centred in the frame, square-cropped, shown with a thin white border. Lighting is soft and even from the front. Dominant colours are grey, charcoal and muted blue. Right: David Zinsner, a smiling man with short dark brown hair, wearing a white collared shirt under a grey knit sweater with a navy crew-neck trim, against a bright, out-of-focus window backdrop in white and pale blue. Lighting is soft and even. Dominant colours are white, pale blue, grey and navy. Both photos are square-cropped and boxed with thin white outlines, not full-bleed, and have no overlay. Other visuals: an Intel logo in a white square at the top-left (blue lowercase wordmark 'intel' with a small registered mark) with a cluster of cyan and bright-blue squares above and beside it; a small cyan square at the top right; a small cyan square at the bottom left; a translucent blue glow strip along the bottom edge beneath the panel; faint translucent blue square tiles on the right and left edges.
Slide 2
Non-GAAP Financial Measures and Forward-Looking Statements
• This presentation contains non-GAAP financial measures. Intel gross margin, and earnings per share, including year-over-year comparisons, are presented on a non-GAAP basis. This presentation also includes a non-GAAP adjusted free cash flow (FCF) measure. The Appendix provides a reconciliation of these measures to the most directly comparable GAAP financial measure. The non-GAAP financial measures disclosed by Intel should not be considered a substitute for, or superior to, the financial measures prepared in accordance with GAAP. Please refer to “Explanation of Non-GAAP Measures” in our earnings released dated July 27, 2023 for a detailed explanation of the adjustments made to the comparable GAAP measures, the ways management uses the non-GAAP measures, and the reasons why management believes the non-GAAP measures provide investors with useful supplemental information.
• Statements in this presentation that refer to business outlook, plans, and expectations are forward-looking statements that involve risks and uncertainties. Words such as “accelerate,” “achieve,” "aim, "ambitions," "anticipate," "believe," “committed,” "continue," “could,” “designed,” "estimate," "expect," “forecast,” “future,” "goals," ”grow,” “guidance,” "intend," “likely,” “may,” "might," "milestones," "next generation," "objective," “on track,” "opportunity," "outlook,” "pending," "plan," ”position,” “potential,” "possible," "predict," “progress,” “ramp,” “roadmap,” “seeks,” “should,” “strive,” "targets," "to be," "upcoming," "will," “would,” and variations of such words and similar expressions are intended to identify such forward-looking statements, which may include statements regarding: our business plans and strategy and benefits therefrom; projections of our future financial performance, including future revenue, gross margins, capital expenditures, and cash flows; future cash requirements and the availability and sufficiency of funding; expected returns to stockholders, such as stock repurchases and dividends; future products, services and technologies, and the expected goals, timeline, ramps, progress, availability, production, regulation and benefits of such products, services and technologies, including future process nodes and packaging technology, product roadmaps, schedules, future product architectures, expectations regarding process performance, per-watt parity, and metrics and expectations regarding product and process leadership; investment plans, and impacts of investment plans; internal and external manufacturing plans; future production capacity and product supply; supply expectations; plans and goals related to Intel’s foundry business; expected timing and impact of acquisitions, divestitures, and other significant transactions; expected completion and impacts of restructuring activities and cost-saving or efficiency initiatives; future social, and environmental performance goals, measures, strategies and results; our anticipated growth, future market share, and trends in our businesses and operations; projected growth and trends in markets relevant to our businesses; anticipated trends and impacts related to industry component, substrate, and foundry capacity utilization, shortages and constraints; expectations regarding government incentives; future technology trends; future macro environmental and economic conditions; future responses to and effects of COVID-19; geopolitical conditions; tax- and accounting-related expectations; expectations regarding our relationships with certain sanctioned parties; and other characterizations of future events or circumstances.
• Such statements involve many risks and uncertainties that could cause our actual results to differ materially from those expressed or implied, including: changes in demand for our products; changes in product mix; the complexity and fixed cost nature of our manufacturing operations; the high level of competition and rapid technological change in our industry; the significant upfront investments in R&D and our business, products, technologies, and manufacturing capabilities; vulnerability to new product development and manufacturing-related risks, including product defects or errata; risks associated with a highly complex global supply chain; sales-related risks; potential security vulnerabilities in our products; cybersecurity and privacy risks; investment and transaction risk; IP risks and risks associated with litigation and regulatory proceedings; evolving regulatory and legal requirements across many jurisdictions; geopolitical and international trade conditions; our debt obligations; risks of large scale global operations;. macroeconomic conditions; impacts of the COVID-19 or similar such pandemic; other risks and uncertainties described in this presentation, our earnings release dated July 27, 2023, our 2022 Annual Report on Form 10-K and our other filings with the SEC.
• Unless specifically indicated otherwise, the forward-looking statements in this presentation do not reflect the potential impact of any divestitures, mergers, acquisitions, or other business combinations that have not been completed as of the date of this presentation. All information in this presentation reflects management’s views as of July 27, 2023, unless an earlier date is specified. We do not undertake, and expressly disclaim any duty, to update such statements, whether as a result of new information, new developments, or otherwise, except to the extent that disclosure may be required by law.
2
Slide 3
Executive Summary
intel
CORe
TM
Q2 beat on Revenue, Gross Margin and EPS
Return to profitability; expecting modest 2H’23 recovery
Effective execution across process and products is rebuilding customer confidence
Executing to capture the insatiable demand for compute
Positioned to democratize AI across the continuum of workloads and usage models
Deploying Smart Capital to create a secure, diversified, and resilient global supply chain
Delivering on long-term shareholder value
On track to deliver $3B of cost savings in 2023, $8-10B exiting 2025
EU CHIPS, US CHIPS application, IMS investment, MBLY secondary, NUC agreement
intel
3
Visuals: One photograph and one logo. Photograph: a close-up, front-on product shot of an Intel Core desktop processor (a silver integrated heat spreader inside a green-edged printed circuit board). The heat spreader carries the word intel in lowercase grey (#7A8088) at upper left, with CORe in large grey and black letters below it and a small TM at the upper right of the word. The chip is lit from upper left with soft studio light producing a brushed-metal highlight running diagonally from upper left to lower right; the metal ranges from pale silver #D9DFE3 to mid grey #6E7A84. The PCB border is teal green #1FA58A with gold contact pads and small white component markings along the left and bottom edges. Framing is centred and fully visible, boxed rather than full-bleed, with a soft dark drop shadow beneath it. Logo: the Intel wordmark in white at the bottom right corner. No charts, tables or diagrams.
Slide 4
Executing our Strategy
Process and Manufacturing
5 nodes in 4 years:
Intel 7 done, Intel 4 production ramping
Intel 3, Intel 20A, Intel 18A on track
RibbonFet and PowerVia on 20A and 18A
CCG
Meteor Lake PRQ in Q3’23
bringing AI to the PC at scale
Arrow Lake and Lunar Lake
in 2024
NUC agreement with ASUS
DCAI
Emerald Rapids in Q4’23
Sierra Forest in 1H’24 followed
by Granite Rapids both on Intel 3
Clearwater Forest on 18A in ’25
Gaudi3 in 1H’24
NEX
Ericsson partnering on Industry
Scale Open RAN and next gen
5G infrastructure on Intel 18A
mobileye
SuperVision design win with
Porsche
Mobility-as-a-Service
collaboration with VW Group
intel. foundry services
Added RAMP-C partnerships
with Boeing and Northrop
Grumman
intel
4
Visuals: Photograph in the left panel (about x 3.7, y 32.9, w 29.2, h 34.9, boxed, not cropped to a circle): a cleanroom technician in a white hooded bunny suit and safety glasses leaning over a machine, a pink-lit silicon wafer in the foreground, dark grey equipment at left, soft neutral lighting, dominant colours white, grey and magenta-pink. CCG panel: about x 43.4, y 27.0, w 8.6, h 8.0 image of a Meteor Lake package die, teal and blue with dark chiplets, shown in a thin light-grey frame. DCAI panel: about x 63.9, y 25.9, w 11.3, h 9.0 image of a dark grey Emerald Rapids processor package with gold-tinted heat spreader, angled slightly. NEX panel: about x 86.2, y 21.1, w 9.6, h 18.1 image of an Intel Xeon Scalable Processor box, silver with blue Intel XEON wordmark, angled. mobileye panel: about x 51.6, y 58.9, w 10.5, h 12.4 photograph of a white sedan with a roof-mounted sensor unit driving on a city street lined with stone buildings and trees, daylight, neutral tones. Intel Foundry Services panel: about x 76.7, y 59.3, w 10.5, h 12.4 photograph of a person in a white shirt holding a round dark red-brown silicon wafer in front of a blurred bright background, boxed. Logos: Mobileye logo (blue wordmark with stylised m) in tile; Intel Foundry Services logo (blue intel. wordmark over foundry services in cyan) in tile; Intel logo bottom right in white.
Slide 5
Q2 Financial Highlights
$12.9B
Revenue
Down 15% YoY
$0.9B above April outlook
1
39.8%
Gross Margin
Down 5.0 ppts YoY
2.3 ppt above April outlook
1
$0.13
EPS
Down 54% YoY
$0.17 above April outlook
1
1 Comparisons are based on the mid-point of revenue outlook
5
Visuals: Three dark navy rectangular cards with the figures and labels shown in the text, all in white. Under each card is a faint, blurred reflection of the card on the blue background, about 27% wide and 27% tall. A faint, translucent square-tile pattern appears at the edges of the background. The Intel logo is a white wordmark with a small cyan accent dot, placed bottom right. No charts, tables or photographs.
Slide 6
Client Computing Group (CCG)
Revenue down 12%
Operating Income up 19%
$7.7B
$6.8B
Q2'22
Q2'23
Operating
Margin 11%
$0.9B
Operating
Margin 15%
$1.0B
Q2'22
Q2'23
Revenue
• Lower on overall TAM contraction and OEM
inventory reductions
Operating Income
• Higher on reduced spending and inventory
reserves
intel. CORE
intel.
6
Visuals: Left panel, chart 1: column chart titled 'Revenue down 12%'. Columns: Q2'22 labelled $7.7B, Q2'23 labelled $6.8B. Both columns are blue vertical gradients (top about #00C8FF to bottom about #0070C0), about 9.8% of slide width each, bottoms on a white baseline at about 84.8% of slide height; heights are about 40.9% and 36.1% of slide height. No value axis, no axis ranges, no gridlines, no legend, no highlighted points. Category labels below baseline: Q2'22, Q2'23. Left panel, chart 2: column chart titled 'Operating Income up 19%'. Columns: Q2'22 labelled $0.9B with 'Operating Margin 11%' above the value; Q2'23 labelled $1.0B with 'Operating Margin 15%' above the value. Both columns are olive green #8BAE46 flat fills, about 9.9% of slide width, heights about 4.1% (Q2'22) and 4.8% (Q2'23) of slide height, bottoms on the same baseline. No value axis, no legend, no highlighted points. Category labels: Q2'22, Q2'23. Right panel: a photograph-like rendered illustration of an Intel Core processor package, boxed in a rectangle at x 66.8 y 61.7 w 30.5 h 29.1 with no crop. The subject is a dark square chip package with silver-grey edges, centred, bearing the blue 'intel.' and white 'CORE' logo, sitting in a glowing cyan circuit board. Composition: symmetrical, chip centred, traces radiating outward to the frame edges, vertical blue light streaks on left and right edges. Lighting: internal cyan glow, dark surroundings. Dominant colours: cyan #00A8E0, deep navy #0B2A4A, near-black #050F1F, white highlights on chip. No overlay or tint.
Slide 7
Data Center and AI Group (DCAI)
Revenue down 15%
$4.7B
$4.0B
Q2'22
Q2'23
Operating Income down 101%
Operating
Margin (2%)
($0.1B)
Operating
Margin (4%)
($0.2B)
Q2'22
Q2'23
Revenue
• Lower on CPU TAM contraction and competitive pressure
Operating Income
• Lower on higher unit costs driven by factory utilization and product mix
intel
7
Visuals: Chart 1, titled 'Revenue down 15%', is a vertical bar chart with two gradient bars: Q2'22 labelled $4.7B and Q2'23 labelled $4.0B. The bars are light cyan #00C8FF at the top fading to deeper blue #0068B8 at the base, sitting on a thin white baseline. No axes, gridlines or legend are shown; the Q2'22 bar is about 42% of slide height tall and the Q2'23 bar about 36%. Chart 2, titled 'Operating Income down 101%', has no bars of visible height; it shows two thin olive-green #8DB83A bars sitting on the white baseline, one under Q2'22 labelled Operating Margin (2%) and ($0.1B), and one under Q2'23 labelled Operating Margin (4%) and ($0.2B). No axes or legend are shown. Photograph: a close-up of an Intel Xeon 4th Gen Intel Xeon Scalable Processor chip, silver-grey heatsink with the intel XEON logo, seated on a blue printed circuit board with bright white and blue traces; the chip sits diagonally in the centre-left, lit by cool blue light with a glow on the right edge. It is a rectangular boxed image, not cropped to a shape, with no overlay. Logo: the intel wordmark in light grey-blue at bottom right.
Slide 8
Network and Edge Group (NEX) / Revenue down 38% / Operating Income down 164% / $2.2B / $1.4B / Operating / Margin 13% / $0.3B / Operating / Margin (14%) / ($0.2B) / Q2'22 / Q2'23 / Q2'22 / Q2'23 / Revenue / • Lower on edge and telco demand softness / and elevated network inventories / Operating Income / • Lower on reduced revenue / 8
Visuals: Chart 1, titled 'Revenue down 38%': vertical bar chart, with axis unit in US dollars (billions) and no visible axis scale. Series 'Revenue': Q2'22 bar labelled $2.2B, tallest bar; Q2'23 bar labelled $1.4B, about 64% of the Q2'22 bar height. Bars are cyan-to-blue vertical gradients (top about #00C8FF, bottom about #0065B3) with a thin white baseline. Category labels Q2'22 and Q2'23 sit below the baseline. Chart 2, titled 'Operating Income down 164%': vertical bar chart with a zero baseline and no scale. Series 'Operating Income': Q2'22 bar labelled $0.3B with the text 'Operating Margin 13%' above it, a green bar (#8BAE46) rising above the baseline (about 0.3B, drawn small). Q2'23 bar labelled ($0.2B) with 'Operating Margin (14%)' above it, a green bar (#8BAE46) hanging below the baseline (about 0.2B, drawn small). No legend and no highlighted points. Photograph in the right panel's lower third: a close-up of an Intel Xeon Processor chip, silver-grey metal lid with 'XEON' and small black print, seen at an angle, sitting on a blue printed circuit board with glowing cyan light at its edges. Lighting is cool and bright with a blue dominant tone (#1A4F8A to #0B2A55). The image is boxed, not cropped, full width of the panel, with square corners. Intel logo in the bottom-right corner: white lowercase 'intel' wordmark with a small blue-cyan dot over the i and a small registered mark.
Slide 9
Other Business Segments
Mobileye
Revenue
Operating Income
$460M
$454M
Operating / Margin 41%
$190M
Operating / Margin 28%
$129M
Q2'22
Q2'23
Q2'22
Q2'23
• Revenue roughly flat YoY
• Operating income down 32% YoY on / increased investments in leadership products
Intel Foundry Services (IFS)
Revenue
Operating Income
$57M
$232M
Operating / Margin (235%)
($134M)
Operating / Margin (62%)
($143M)
Q2'22
Q2'23
Q2'22
Q2'23
• IFS revenue up 307% YoY
• Operating loss driven by increased spending / to support strategic growth
9
intel
Visuals: Four bar charts in two panels, all with white value labels and quarter labels. Left panel (Mobileye): Revenue chart, vertical bars, blue gradient (top about #00C7FD to bottom about #0068B8), categories Q2'22 and Q2'23 with labelled values $460M (Q2'22, about 33% to 60% of slide height bar) and $454M (Q2'23). Operating Income chart, green gradient bars (top about #8DB84A to bottom about #5F8035), categories Q2'22 $190M with 'Operating Margin 41%' above it, and Q2'23 $129M with 'Operating Margin 28%' above it. No axes, gridlines or legend are printed; bar heights are proportional to the printed values, with the baseline at about y 60%. Right panel (IFS): Revenue chart, blue gradient bars, Q2'22 $57M (short bar) and Q2'23 $232M (tall bar). Operating Income chart, green bars drawn below a baseline into negative territory: Q2'22 ($134M) with 'Operating Margin (235%)' above it, and Q2'23 ($143M) with 'Operating Margin (62%)' above it; the Q2'23 bar is the slightly longer one. Thin white horizontal baselines under each chart group. Photographic background is not present; background is a blue gradient with faint rectangular tonal shapes.
Slide 10
Outlook
10
Visuals: Full-slide background image of a blue radial gradient with faint translucent square tiles. Lighter blue glow at top centre, darker navy toward the bottom corners. Translucent darker-blue squares and rectangles sit at top-left (a wide block near the top edge and a small square below it), left edge (a tall block at the bottom-left and a square above it), right edge (a large block near upper right, a small square below it, and a square block at lower right with a small square beneath), and a small square near bottom centre-left. Tiles are soft, low-contrast, with no outlines. The title 'Outlook' is a white-to-pale-lavender wordmark rendered as an image, with no photograph or chart. Intel logo is a white wordmark with a small cyan accent over the 'i' and a registration mark.
Slide 11
Q3 2023 Outlook
$12.9-13.9B
Revenue
Down 13% YoY
43.0%
Gross Margin1
Down 2.9 ppt YoY
$0.20
EPS1
Down 46% YoY
1 Gross Margin and EPS outlook based on the mid-point of the revenue range
intel
11
Visuals: Three equal rectangular panels, each a dark navy card (#002543 at 82% opacity) with sharp corners and a faint dark drop shadow beneath. Each card holds a large white figure, a light-weight label and a bold change line, left-aligned. Below each card is a faint blurred reflection of the card on the blue background. No chart, table or photograph. Left card: $12.9-13.9B, Revenue, Down 13% YoY. Middle card: 43.0%, Gross Margin with superscript 1, Down 2.9 ppt YoY. Right card: $0.20, EPS with superscript 1, Down 46% YoY. The background is a blue gradient with faint translucent rectangular tiles at the top left, right edge and lower left.
Slide 12
Appendix
Visuals: Decorative pattern of semi-transparent rectangles and small squares in slightly lighter blue, placed at the top-left, left edge, right edge and bottom-right, all low opacity. The title 'Appendix' is set as a rasterised image (281 by 59 px), not live text. No photographs, charts or logos.
Slide 13
Reconciliation of Non-GAAP Actuals / Three Months Ended / Jul 1, 2023 / Jul 2, 2022 / GAAP gross margin percentage 35.8% 36.5% / Acquisition-related adjustments 2.4% 2.2% / Share-based compensation 1.6% 1.2% / Patent settlement -- 1.3% / Optane inventory impairment -- 3.6% / Non-GAAP gross margin percentage 39.8% 44.8% / GAAP earnings (loss) per share attributable to Intel—diluted $0.35 $(0.11) / Acquisition-related adjustments 0.08 0.09 / Share-based compensation 0.22 0.22 / Patent settlement -- 0.05 / Optane inventory impairment -- 0.14 / Restructuring and other charges 0.05 0.02 / (Gains) losses on equity investments, net 0.01 0.02 / (Gains) losses from divestiture (0.01) -- / Adjustments attributable to non-controlling interest -- -- / Income tax effects1 (0.57) (0.15) / Non-GAAP earnings (loss) per share attributable to Intel—diluted $0.13 $0.28 / 1 Contemplates a fixed long-term projected non-GAAP tax rate / intel / 13
Visuals: No photograph or chart. One table, titled by a spanning header 'Three Months Ended' over two columns 'Jul 1, 2023' and 'Jul 2, 2022'. Rows in order: GAAP gross margin percentage 35.8% / 36.5% (bold); Acquisition-related adjustments 2.4% / 2.2%; Share-based compensation 1.6% / 1.2%; Patent settlement -- / 1.3%; Optane inventory impairment -- / 3.6%; a thin rule; Non-GAAP gross margin percentage 39.8% / 44.8% (bold, rules above and below). Blank gap. GAAP earnings (loss) per share attributable to Intel—diluted $0.35 / $(0.11) (bold); Acquisition-related adjustments 0.08 / 0.09; Share-based compensation 0.22 / 0.22; Patent settlement -- / 0.05; Optane inventory impairment -- / 0.14; Restructuring and other charges 0.05 / 0.02; (Gains) losses on equity investments, net 0.01 / 0.02; (Gains) losses from divestiture (0.01) / --; Adjustments attributable to non-controlling interest -- / --; Income tax effects with superscript 1, (0.57) / (0.15), rule above; Non-GAAP earnings (loss) per share attributable to Intel—diluted $0.13 / $0.28 (bold, rules above and below). Thin white horizontal rules sit under the column headers and above each subtotal. No chart and no photographs. Background is a blue gradient with faint square tiles, described under background.
Slide 14
Reconciliation of Non-GAAP Q3 Outlook
Q3 2022 Actuals
Q3 2023 Outlook1
Approximately
GAAP gross margin percentage
42.6%
39.1%
Acquisition-related adjustments
2.2%
2.5%
Share-based compensation
1.1%
1.4%
Non-GAAP gross margin percentage
45.9%
43.0%
GAAP earnings (loss) per share attributable to Intel—diluted
$0.25
$0.04
Acquisition-related adjustments
0.09
0.10
Share-based compensation
0.19
0.20
Restructuring and other charges
0.16
--
(Gains) losses on equity investments, net
0.04
(0.03)
(Gains) losses from divestiture
(0.01)
(0.01)
Adjustments attributable to non-controlling interest
--
(0.01)
Income tax effects2
(0.35)
(0.09)
Non-GAAP earnings (loss) per share attributable to Intel—diluted
$0.37
$0.20
1 Non-GAAP gross margin percentage and non-GAAP earnings (loss) per share outlook based on the mid-point of the revenue range
2 Contemplates a fixed long-term projected non-GAAP tax rate
14
Visuals: None photographic. Table rendered as text inside a dark rectangular panel with horizontal white rules. Columns: row label, Q3 2022 Actuals (about 60.6 to 70.7 percent of the width), Q3 2023 Outlook Approximately (about 71.8 to 83.8 percent of the width). Rows: GAAP gross margin percentage 42.6% / 39.1%; Acquisition-related adjustments 2.2% / 2.5%; Share-based compensation 1.1% / 1.4%; Non-GAAP gross margin percentage 45.9% / 43.0%; GAAP earnings (loss) per share attributable to Intel—diluted $0.25 / $0.04; Acquisition-related adjustments 0.09 / 0.10; Share-based compensation 0.19 / 0.20; Restructuring and other charges 0.16 / --; (Gains) losses on equity investments, net 0.04 / (0.03); (Gains) losses from divestiture (0.01) / (0.01); Adjustments attributable to non-controlling interest -- / (0.01); Income tax effects (0.35) / (0.09); Non-GAAP earnings (loss) per share attributable to Intel—diluted $0.37 / $0.20. Thin white horizontal rules sit under the 1.1% and 1.4% row at about 39.8 percent of the height, under the 45.9% and 43.0% row at about 42.7 percent, under the (0.35) and (0.09) row at about 67.7 percent, and under the $0.37 and $0.20 row at about 70.3 percent, each spanning its value column. A background illustration of a blue gradient with translucent square tiles fills the whole slide behind everything.
Slide 15
intel®
Visuals: Full-bleed background illustration: a radial gradient from deep navy blue at the top corners to brighter azure at the bottom centre, overlaid with faint, low-opacity translucent squares and rectangles of slightly lighter and darker blue, mostly at the top-left, top-right, right edge and bottom-left. Two small solid bright cyan (#00C2FF) squares sit at the top-right corner and bottom-left corner. The logo is the white Intel wordmark, lowercase bold sans-serif letters 'intel' with a small registered mark (®) at the lower right of the 'l'. No photograph, chart, table or other content.
Download this deck
The hosted PDF of every library deck is free for readers of the SlideDeck Co newsletter. Join with your email and the viewer and download appear here.
Preparing a results presentation or business update of your own? The SlideDeck Co Standard Deck is a slide library for business reviews, updates and plans.







