
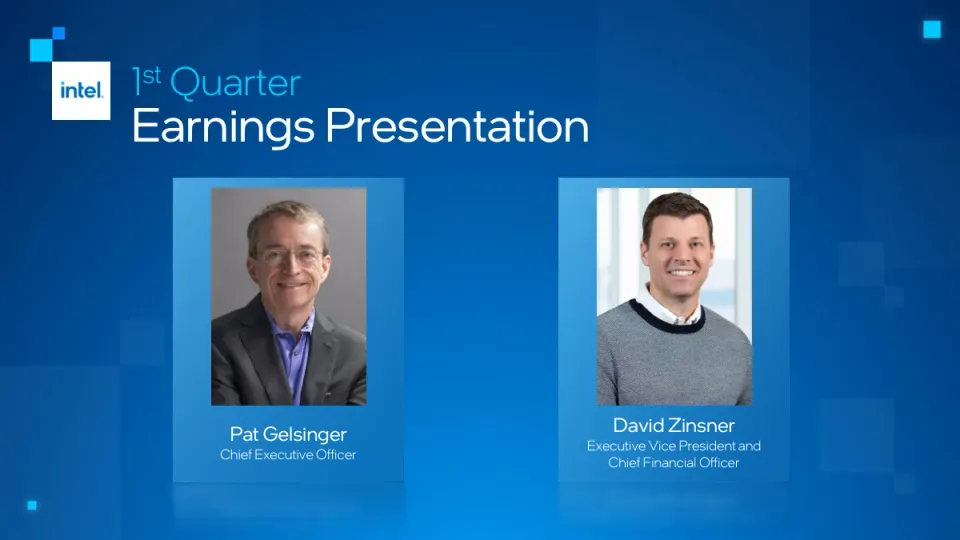
This deck is Intel's Q1 2022 earnings presentation, delivered by CEO Pat Gelsinger and CFO David Zinsner. It opens with a title slide, followed by a lengthy disclosures slide covering non-GAAP measures and forward-looking statements. An executive summary then highlights the quarter's beats and strategic milestones. The main sections follow in order: an industry outlook, progress on strategy with a roadmap of process nodes and product launches, and Q1 financial highlights. Segment reviews come next for Client Computing, Datacenter and AI, and Network and Edge. A page on emerging business segments covers Accelerated Computing Systems and Graphics, Mobileye, and Intel Foundry Services. The deck ends with a full-year outlook. The appendix contains reconciliation tables from GAAP to non-GAAP revenue, operating income, gross margin, and earnings per share for 2019 through Q2 2022. The deck closes on its outlook and appendix tables rather than a call to action.
Slides worth studying
- Slide 3: Three short headline statements each backed by two lines of detail make the quarter's takeaways scannable in seconds.
- Slide 6: Three big-number tiles with a small comparison line beneath each give the headline results a clear hierarchy.
- Slide 10: Three emerging-business panels share one chart style and one bullet pattern, so the three units are easy to compare side by side.
Details
- Company: Intel
- Year: 2022
- Type: Investor presentation
- Industry: Semiconductors
- Pages: 24
The hosted copy of this deck is being prepared. Newsletter readers will find the download here.
Review score: 7 out of 10, Effective
Presentation quality, judged with the SlideDeck Co review heuristic. Ask, evidence and idea merit are not rated here.
The deck is clean and easy to move through: slide 6 gives $18.4B, 53.1% and $0.87 each with the year-over-year change and the gap to January guidance, slides 7 and 9 pair two bar charts with short cause notes, and an Outlook divider at slide 11 separates guidance from results. The appendix does useful work for a quarter with new segments, with historical segment tables on slides 16 and 18 set in large type. The bottleneck is that company-level change goes unexplained: gross margin 'Down 5.7 ppt YoY' and EPS 'Down 35% YoY' appear on slide 6 with no bridge or cause, and the executive summary on slide 3 says only 'Beat expectations on revenue, GM, and EPS'. There is no cash or balance sheet slide in the main run, and slides 4 and 5 are image-led strategy panels that add little a reader can check. On slide 10 the quarter labels collide with the negative bars in the AXG panel.
Worth keeping: Keep the slide 6 format of figure, year-over-year change and gap to prior guidance in one tile.
Most useful repair: Add a gross margin or EPS bridge after slide 6 and put the year-over-year declines into the slide 3 summary.
What would change the score: If the reconciliation pages on slides 22 and 23, seen only on the contact sheet, proved unreadable at full size the appendix strength would weaken; a readable margin bridge elsewhere would lift the score to 8.
Confidence high. 24 of 24 pages inspected on contact sheets, 12 at readable size. Reviewed 2026-11-15. Model-assisted review (claude-fable-5-2, in session).
Full text of the slides (24 slides)
Every slide's words and a description of its charts and images, so the deck can be searched and rebuilt. Also available as Markdown.
Slide 1
intel
1st Quarter
Earnings Presentation
Pat Gelsinger
Chief Executive Officer
David Zinsner
Executive Vice President and
Chief Financial Officer
Visuals: Two portrait headshot photographs, each inside a lighter blue card. Left: Pat Gelsinger, older man with short grey hair and wire-rimmed glasses, smiling, wearing a dark grey suit jacket and a blue-violet collared shirt, against a plain mid-grey backdrop, head and shoulders framed, full-colour, cropped to a rectangle. Right: David Zinsner, smiling man with short brown hair, wearing a white collared shirt under a grey knit sweater with navy crew-neck trim, against a soft bright window background in white and pale blue, head and shoulders framed, rectangle crop. Both photographs have a soft reflection beneath each card. Small intel logo: white square box with the blue lowercase intel wordmark and registered mark, with a stacked cluster of cyan and blue squares at its upper left as decorative icon.
Slide 2
Disclosures
This presentation contains non-GAAP financial measures. Intel revenue, gross margin, and earnings per share, including year-over-year comparisons, are presented on a
non-GAAP basis except with respect to our Q1 2022 revenue, Q2 and full-year 2022 revenue outlook, or as otherwise indicated. This presentation also includes a non-
GAAP adjusted free cash flow (FCF) measure. The Appendix provides a reconciliation of these measures to the most directly comparable GAAP financial measure. The
non-GAAP financial measures disclosed by Intel should not be considered a substitute for, or superior to, the financial measures prepared in accordance with GAAP.
Please refer to “Explanation of Non-GAAP Measures” in Intel's quarterly earnings release for a detailed explanation of the adjustments made to the comparable GAAP
measures, the ways management uses the non-GAAP measures, and the reasons why management believes the non-GAAP measures provide investors with useful
supplemental information.
Statements in this presentation that refer to business outlook, plans, and expectations are forward-looking statements that involve risks and uncertainties. Words such as
“achieve,” "aim," "anticipate," "believe," "continue,“ “committed,” “could,” "estimate," "expect," “forecast,” “future,” "goal,"”grow,” “guide,” "intend," “likely,” “may,” "milestones,"
“momentum,” "objective," “on-track,” "opportunity," "outlook,” “pipeline,” "plans," “possible,” “potential,” “progress,” ”positioned,” “ramp,” “roadmap,” "seek," “should,” "strive,"
"targets," “to be,” "will," “would," and variations of such words and similar expressions are intended to identify such forward-looking statements. Statements that refer to or
are based on estimates, forecasts, projections, uncertain events or assumptions, including statements relating to Intel’s strategy and its anticipated benefits, including
updates to our reporting structure; Intel’s process and packaging technology, roadmap and schedules, including future node performance and other metrics;
manufacturing expansion, financing and investment plans, including the impacts of such plans, such as our announced investments in the U.S. and abroad; financial
projections; future dividends; plans and goals related to Intel’s foundry business; future responses to and effects of COVID-19,including manufacturing, transportation,
and operational restrictions or disruptions, such as the recent Shanghai port shutdown; future legislation, including any expectations regarding anticipated financial and
other benefits or incentives thereunder; future products, technology, and services, and the expected regulation, availability, production and benefits of such products,
technology, and services, including product ramps, and manufacturing plans, goals, timelines, and future progress; projected costs and yield trends; pending transactions,
including the acquisitions of Tower Semiconductor Ltd. and Granulate Cloud Solutions Ltd, the sale of our NAND memory business, and the proposed Mobileye IPO;
supply expectations, including regarding industry shortages, constraints, limitations, pricing and sufficiency of future supply; future external foundry usage; expectations
regarding customers; projections regarding competitors; business plans and financial expectations; future business, social, and environmental performance, goals,
measures and strategies; future economic conditions, including related to interest rates and inflation; geopolitical conditions,including the impacts of Russia's war on
Ukraine and the suspension of our operations; the future purchase, use, and availability of products, components and services supplied by third parties, including third-
party IP and manufacturing services; tax-and accounting-related expectations; uncertain events or assumptions, including statements relating to total addressable
market, product or customer demand or market opportunity; and anticipated growth trends in our businesses or the markets relevant to them, including future demand
and industry growth, also identify forward-looking statements. Unless specifically indicated otherwise, the forward-looking statements in this presentation do not reflect
the potential impact of any divestitures, mergers, acquisitions, or other business combinations that have not been completed as of the date of this presentation. Such
statements involve many risks and uncertainties that could cause actual results to differ materially from those expressed or implied in these forward-looking statements.
Important factors that could cause actual results to differ materially are set forth in Intel's earnings release dated April 28,2022, which is included as an exhibit to Intel’s
Form 8-K furnished to the SEC on such date, and in Intel's SEC filings, including the company's most recent reports on Forms 10-K and 10-Q. Copies of Intel’s SEC filings
may be obtained by visiting our Investor Relations website at www.intc.com or the SEC's website at www.sec.gov.
All information in this presentation reflects management’s views as of April 28, 2022. Intel does not undertake, and expressly disclaims any duty, to update any statement
made in this presentation, whether as a result of new information, new developments or otherwise, except to the extent that disclosure may be required by law.
Intel
2
Visuals: none. The only non-text graphic is the full-bleed blue background, which carries faint lighter rectangular tile shapes and no photograph, chart or icon. The title is a raster picture of the word 'Disclosures' and the Intel wordmark logo is bottom-right.
Slide 3
Executive Summary / Beat expectations on revenue, GM, and EPS / Reaffirming full year revenue and GM outlook, raising EPS / Executing on our strategy / Shipping initial SKUs of Sapphire Rapids to select customers / Launched ARC A-Series and newest Xeon D processors / Creating more globally balanced semi manufacturing / Announced new R&D and fab investment in Europe / Unveiled latest leading-edge factory in Oregon / 3
Visuals: Photograph of an Intel Core desktop processor, front view, centred in the left column. The chip is a green printed-circuit-board package with a silver brushed-metal integrated heat spreader. The heat spreader carries a dark grey intel wordmark at upper left with a small registered mark, the word CORE in large dark grey letters (the O is black, the rest grey), and a small TM at upper right of CORE. The package has small gold contact pads along its top and bottom edges and four small black components on its left edge. Lighting is from upper left, giving soft highlights on the metal. The chip is shown whole, not cropped, on a boxed rectangle with a soft dark drop shadow beneath it. Dominant colours are teal-green #1E8C6E for the PCB, silver #C8CDD2 for the metal, and dark grey #3A3F45 for the lettering. Three rectangular cards with a blue gradient stack in the right column, each holding a bold headline and light sub-lines. Below the third card is a faint mirrored reflection of it, fading to the background, with text too faint to read. No charts or tables.
Slide 4
Industry Outlook
Long-Term, Sustainable
Semiconductor Demand
Continued Need for Resilient
and Balanced Supply Chain
Government Action Required to
Accelerate Pace
intel
XEON
A FUTURE
MADE IN
AMERICA
4
Visuals: Three photographs, one per card, all boxed (rectangular, no rounded corners, no border). Card 1 (left): a close-up of blue-lit data-centre server racks with glowing cyan light strips and floating icons (bar charts, dollar signs, clouds, target, magnifier, monitor). A dark-navy rectangular badge reading 'intel' (small) above 'XEON' (larger) in white sits over the lower-left of the image at about x 8.5% to 12.8%, y 52.7% to 60.5%. Dominant colours are electric blue, cyan and dark navy; lighting is dark with glowing rim light; framing is a frontal, slightly angled view filling the box. Card 2 (centre): a wide view down a corridor of stacked shipping containers, red, blue and grey, receding to a vanishing point at the centre; a small white passenger aircraft flies in a pale grey overcast sky near the top centre. Lighting is flat, overcast daylight; dominant colours are rust red, slate blue and grey; the photo fills its box. Card 3 (right): a press event with five people in front of a blue backdrop reading 'A FUTURE MADE IN AMERICA' with circuit-board motifs; a man in a dark suit stands at a navy podium with a gold presidential seal; a woman in a grey checked jacket and black mask stands left of centre; other men in suits and masks stand at the left and right edges; an American flag and a dark blue flag stand behind the podium. Lighting is bright stage light; dominant colours are navy, royal blue, white and wood brown; the photo fills its box with a wooden floor in the lower part. Overall the photos are not cropped beyond their boxes and none is full-bleed.
Slide 5
Executing on our Strategy
Delivering 5 Nodes in 4 Years
CCG
DCAI
NEX
Alder Lake shipped 15 Mu
Raptor Lake sampling now
Shipping initial SKUs of
Sapphire Rapids
to select customers
Launched newest Xeon D
10 vRAN engagements
with major global operators
AXG
On-track to >$1B rev
Launched ARC A-Series
>$5B deal value across
10 qualified opportunities
30 test chips on Intel 16/3
L4 driving system demo
BMW / EyeQ5 Launch
IPO progressing
Intel 7: Alder Lake ramping
Intel 4: Meteor Lake booted Windows
Intel 3: Sierra Forest pre-prod wafers in 2022
intel. foundry services
mobileye An Intel Company
intel
5
Visuals: Seven photographs and several logos. (1) Left tall card: photograph of a technician in a white cleanroom bunny suit and safety glasses behind a window, working on a large black semiconductor wafer-handling or lithography stage; a blue and violet light beam crosses the frame; warm orange light on the right edge, violet-magenta cast on the left; full-bleed inside the card, rectangular, not cropped to a shape. (2) CCG card: an upright rectangular Alder Lake processor module in dark grey with a grid of blue and dark square tiles, shown at a slight angle, no label. (3) DCAI card: a near-flat Sapphire Rapids processor package, dark grey substrate with a gold-tinted heat spreader, shown at a diagonal angle on a blue background. (4) NEX card: an Intel Xeon D-2700 Processor chip in a silver metal heat spreader with the text 'intel. XEON Intel Xeon D-2700 Processor' printed on it, in a dark green-grey substrate frame. (5) AXG card: two dark graphics cards with blue-and-white die-shaped displays, one overlapping the other diagonally. (6) Foundry card: a person in a white lab coat and blue gloves holding a round reddish-brown silicon wafer up toward the camera, with a blurred light grey background; rectangular, not cropped. (7) Mobileye card: a white sedan driving on a city street past a stone building with trees; rectangular photograph, white car in centre. Logos: 'intel. foundry services' in blue (#0068B5) at top-left of the foundry card in a white tile; 'mobileye An Intel Company' in blue (#1A9BD7) at top-left of the Mobileye card in a white tile; Intel logo bottom right in white with a light blue i-dot.
Slide 6
Q1 Financial Highlights¹
$18.4B
Revenue
Down 1% YoY
$0.1B above Jan guidance
53.1%
Gross Margin
Down 5.7 ppt YoY
1.1 ppt above Jan guidance
$0.87
EPS
Down 35% YoY
$0.07 above Jan guidance
¹ YoY comparisons exclude share-based compensation and gains/losses on equity investments.
6
Visuals: Three rectangular translucent glass-style panels (cards), each with a soft lighter blue gradient from upper-left to darker blue at lower-right, with a faint reflection beneath each card. Each card holds a large bold white figure, a light white metric label, and a two-line caption (bold line above a light line). Card 1: $18.4B, Revenue, Down 1% YoY, $0.1B above Jan guidance. Card 2: 53.1%, Gross Margin, Down 5.7 ppt YoY, 1.1 ppt above Jan guidance. Card 3: $0.87, EPS, Down 35% YoY, $0.07 above Jan guidance. No chart axes or legend. Faint tonal square tiles are scattered in the background at the top-left, right and lower-left. The intel wordmark logo sits bottom-right in white with a small cyan accent dot over the i.
Slide 7
Client Computing Group (CCG)
Revenue down 13%
Operating Income down 34%
$10.7B
$9.3B
Revenue
• Lower revenue on ramp down of Apple / CPU/modem business, lower entry / consumer/education demand and OEM / inventory burn
Operating Income
• Lower operating income on ramp of / 10nm/Intel 7 and investment in product and / process roadmap
$4.3B
$2.8B
Q1'21
Q1'22
Operating Margin 40%
Q1'21
Q1'22
Operating Margin 30%
7
Visuals: Two bar charts in the left panel. Chart 1: title 'Revenue down 13%'. Columns in cyan #00C7FD: Q1'21 at $10.7B and Q1'22 at $9.3B, with values printed above each bar. Category axis labels Q1'21 and Q1'22 sit below a thin white baseline. No value axis or gridlines are shown; bar heights are proportional to the printed values. Chart 2: title 'Operating Income down 34%'. Columns in olive green #8BAE46: Q1'21 at $4.3B with 'Operating Margin 40%' written inside the bar, and Q1'22 at $2.8B with 'Operating Margin 30%' written inside the bar. Category labels Q1'21 and Q1'22 sit below a white baseline. No legend and no highlighted points. Photo bottom right of the right panel: a teal Intel Core processor chip with a white and black 'intel CORE' badge at its centre, set on a dark blue circuit-board background with glowing cyan traces and vertical light-blue pulses. The chip is centred and framed straight on, with dark blue shadows at the edges and cool blue lighting. Dominant colours are deep blue, cyan and teal. The photo is boxed, not cropped, with square corners and sits inside the right panel. Intel logo: the white lowercase 'intel' wordmark with a small blue registered mark, bottom right.
Slide 8
Datacenter and AI Group (DCAI)
Revenue up 22%
Operating Income down 1%
Revenue
•
Revenue growth on Xeon demand strength
from hyperscale and enterprise customers
$6.0B
Operating Income
$4.9B
•
Lower operating income on 10nm ramp and
increased product investment, offset by
higher revenue
$1.7B
$1.7B
Q1'21
Q1'22
Q1'21
Q1'22
Operating
Margin 35%
Operating
Margin 28%
8
Visuals: Bar chart, left panel, with two bar groups. Group 1 'Revenue up 22%': Q1'21 bar labelled $4.9B and Q1'22 bar labelled $6.0B, both cyan #00C7FD, baseline white at about 84.7% of slide height; no axis, no axis numbers, no legend; bar heights are proportional to the labelled values (Q1'22 about 22% taller than Q1'21). Group 2 'Operating Income down 1%' (sits beside group 1 in the same panel): Q1'21 and Q1'22 bars both labelled $1.7B, both green #8BAE46 with white text inside reading 'Operating Margin 35%' (Q1'21) and 'Operating Margin 28%' (Q1'22); the two bars are equal height; baseline white. No highlighted points. Photograph, right side below text: a woman in a white lab coat over a dark navy hijab and dark top, standing centred in a manufacturing line with glass partitions, ceiling lights, and metal machinery with white and grey tubing; a dark blue rectangular 'intel. XEON' badge with white text sits on the left at about 69.8% x, 68.6% y, about 4% wide and 7% high. Composition is a medium shot, landscape crop, full rectangle with sharp corners; lighting is bright overhead fluorescent; dominant colours white, silver grey and light cyan; a faint cyan tint and small translucent blue square graphic overlays float over the scene. Photo box spans about 66.8% to 97.3% of width and 57% to 84.5% of height.
Slide 9
Network and Edge Group (NEX) / Revenue up 23% / Operating Income up 51% / $2.2B / $1.8B / Q1'21 / Q1'22 / $366M / $243M / Operating Margin 14% / Operating Margin 17% / Q1'21 / Q1'22 / Revenue / Record quarterly revenue on cloud networking demand and post-COVID transformation of the edge / Operating Income / Higher operating income on increased demand, partially offset by increased technology and product investment / 9
Visuals: Chart 1 (left group): vertical bar chart titled 'Revenue up 23%'. Categories Q1'21 and Q1'22 with labels printed above the bars. No axis lines, tick labels or y-axis scale are printed. Series: Revenue, bars in #00C7FD. Q1'21 bar labelled $1.8B (about 38% of slide height tall). Q1'22 bar labelled $2.2B (about 47% of slide height tall, about 23% taller than the Q1'21 bar). Bars are 9.75% of slide width wide, with a white baseline (about 0.2% of slide height thick) running under both bars from x 4.0% to 33.2% at y 84.8%. Chart 2 (right group): vertical bar chart titled 'Operating Income up 51%'. Categories Q1'21 and Q1'22. Series: Operating Income, bars in #8BAE46 (olive green), each with the label 'Operating Margin' and a percentage printed inside the bar in white. Q1'21 bar labelled $243M above, with 'Operating Margin 14%' inside (about 5.2% of slide height tall). Q1'22 bar labelled $366M above, with 'Operating Margin 17%' inside (about 7.8% of slide height tall). Bar width 9.75% of slide width; white baseline from x 34.3% to 63.5% at y 84.8%. No axis, scale or legend. Highlighted points: none. Photograph (right panel, lower part): a silver Intel Xeon D processor chip with the printed label 'intel XEON' and 'Intel Xeon D Processor', seen at an angle at the centre of a dark blue printed circuit board with bright blue and white traces radiating outward. Cyan glow light leaks from the chip edges. Composition is a wide landscape frame showing the chip as the central subject with the board filling the rest. Lighting is a soft spot glow from the chip with the board in deep blue shadow. Dominant colours: deep blue #0A3D7A, cyan #3FC8F0 and silver #B8BCC4. The photo is boxed, not full-bleed, with square corners and no overlay. Intel logo: white 'intel' wordmark with a small registered mark, bottom right.
Slide 10
Emerging Business Segments
Accelerated Computing / Systems and Graphics / Group (AXG)
Mobileye
Intel Foundry Services / (IFS)
$181M
$219M
Q1'21
Q1'22
-$176M
-$390M
Revenue
Op Income (Loss)
Revenue up 21% on Alchemist / and Super Compute product / ramps
Higher operating loss on / product pre-qualification / reserves, production ramp / charges, & roadmap investment
$377M
$171M
$394M
$148M
Q1'21
Q1'22
Revenue
Op Income (Loss)
Record quarterly revenue up 5% / YoY
Operating income down 13% / YoY on increased investment in / next generation products
$103M
$283M
-$34M
-$31M
Q1'21
Q1'22
Revenue
Op Income (Loss)
Record quarterly revenue up / 175% YoY on increased tool / deliveries and increased / automotive revenue
Operating loss approximately / flat on higher revenue offset by / investments in custom foundry
10
Visuals: Three grouped vertical bar charts, one per panel, each with a white baseline and two bars per quarter. Revenue bars are cyan #00C7FD and Op Income (Loss) bars are olive green #8BAE46, with no axes or gridlines drawn. Left chart (Accelerated Computing Systems and Graphics Group, AXG): Q1'21 revenue $181M (positive bar), Q1'21 Op Income (Loss) -$176M (bar below baseline), Q1'22 revenue $219M, Q1'22 Op Income (Loss) -$390M (longest negative bar, labelled below it). Middle chart (Mobileye): Q1'21 revenue $377M, Q1'21 Op Income $171M, Q1'22 revenue $394M, Q1'22 Op Income $148M, all positive bars. Right chart (Intel Foundry Services, IFS): Q1'21 revenue $103M, Q1'21 Op Income -$34M (short bar below baseline), Q1'22 revenue $283M, Q1'22 Op Income -$31M (short bar below baseline). Each chart has a legend in its lower left with a cyan square for Revenue and a green square for Op Income (Loss). No highlighted points. Dividers are white vertical lines. No photographs or logos other than the intel logo at bottom right.
Slide 11
Outlook / 11
Visuals: Full-bleed blue radial gradient background with faint translucent square tiles scattered around the edges (ten tiles, listed under elements). A word image 'Outlook' in a light sans-serif, white to pale lavender, centred. An Intel logo in white at bottom right. No photographs, charts or diagrams.
Slide 12
FY 2022 Outlook1
$76B
Revenue
Up 2% YoY
Flat to prior outlook
52%
Gross Margin
Down 6.1 ppt YoY
Flat to prior outlook
$3.60
EPS
Down 32% YoY
Up $0.10 from prior outlook
Net CapEx $27B
Adjusted Free Cash Flow2 ($1-2B)
1 Outlook and YoY comparisons exclude share-based compensation and gains/losses on equity investments.
2 Reflects Q1 2022 proceeds from the McAfee equity sale, which are included to facilitate a better, more consistent comparison to past presentations of liquidity and historical treatment of McAfee equity distributions and sales.
12
Visuals: None of the visuals are charts, tables or photographs. There are three identical rectangular KPI cards, each a translucent light-to-mid blue gradient panel: card 1 at x 7.1% to 33.6%, card 2 at x 36.9% to 63.4%, card 3 at x 66.3% to 92.9%, all spanning y 27.5% to 72.4%. Each card holds a large white numeral in the upper part: $76B (Revenue), 52% (Gross Margin) and $3.60 (EPS). Beneath each card a soft faint blue glow or reflection of the card sits on the background, from about y 72% to 82%, spanning x 6.2% to 93.8%. The Intel logo (blue and white wordmark with a small blue dot over the i, registered mark) sits at about x 92.2%, y 95.1%, width about 4.3%, height about 2.8%. No photographs or icons are present apart from these.
Slide 13
Q2 2022 Outlook1
Revenue
Down 3% YoY
$18B
Gross Margin
Down 8.8 ppt YoY
51%
EPS
Down 49% YoY
$0.70
1 Outlook and YoY comparisons exclude share-based compensation and gains/losses on equity investments.
13
Visuals: Three rectangular cards, each a light-blue gradient panel (lighter top-left, deeper bottom-right) with a faint soft reflection beneath them. Card 1 contains a large silver-white '$18B' numeral over the label 'Revenue' and the bold line 'Down 3% YoY'. Card 2 contains '51%' over 'Gross Margin' and 'Down 8.8 ppt YoY'. Card 3 contains '$0.70' over 'EPS' and 'Down 49% YoY'. No chart, table or photograph. The Intel logo sits bottom right. A faint reflection band runs under the three cards across about 87.6% of the width. Faint translucent square tiles are scattered in the background at the edges. No data points are highlighted.
Slide 14
Appendix
Visuals: Full-bleed background image of a blue radial gradient with faint translucent square tiles. Larger, slightly lighter tiles sit in the upper left, lower left, upper right and lower right corners, and small squares are scattered among them. No photograph, chart, logo or icon. The word Appendix is a placed image of text, not live text, and is listed as an element.
Slide 15
Historical Segment Revenue (2019 – 2021)
(In Millions, unaudited) / FY 2021 / FY 2020 / FY 2019
CCG / $41,067 / $40,535 / $37,938
DCAI / 22,691 / 23,413 / 21,696
NEX / 7,976 / 7,132 / 6,829
AXG / 774 / 651 / 606
Mobileye / 1,386 / 967 / 879
IFS / 786 / 715 / 461
All Other / 5,019 / 5,091 / 4,150
Total operating segment revenue / 79,699 / 78,504 / 72,559
Less: Intersegment revenue / (675) / (637) / (594)
GAAP Revenue / 79,024 / 77,867 / 71,965
Less: NAND memory business / (4,306) / (4,967) / (4,059)
Non-GAAP Revenue / $74,718 / $72,900 / $67,906
15
Visuals: A table with four columns: row label, FY 2021, FY 2020, FY 2019, under the heading (In Millions, unaudited). Rows, values in order: CCG $41,067 / $40,535 / $37,938; DCAI 22,691 / 23,413 / 21,696; NEX 7,976 / 7,132 / 6,829; AXG 774 / 651 / 606; Mobileye 1,386 / 967 / 879; IFS 786 / 715 / 461; All Other 5,019 / 5,091 / 4,150; Total operating segment revenue 79,699 / 78,504 / 72,559 (bold); Less: Intersegment revenue (675) / (637) / (594), indented; GAAP Revenue 79,024 / 77,867 / 71,965 (bold); Less: NAND memory business (4,306) / (4,967) / (4,059), indented; Non-GAAP Revenue $74,718 / $72,900 / $67,906 (bold). Thin white horizontal rules sit above the header row, under the FY headers, under All Other, under Less: Intersegment revenue, under Less: NAND memory business and under Non-GAAP Revenue, spanning the three numeric columns only. No photographs or logos other than the Intel logo.
Slide 16
Historical Segment Operating Income (2019 – 2021)
(In Millions, unaudited) / FY 2021 / FY 2020 / FY 2019
CCG / $15,704 / $15,800 / $16,160
DCAI / 8,439 / 11,076 / 9,927
NEX / 1,711 / 846 / 1,739
AXG / (1,207) / (403) / (353)
Mobileye / 554 / 323 / 318
IFS / (23) / 45 / (213)
All Other / (5,722) / (4,009) / (5,543)
GAAP operating income / 19,456 / 23,678 / 22,035
Acquisition-related adjustments / 1,492 / 1,416 / 1,324
Restructuring and other charges / 2,626 / 198 / 393
Share-based compensation / 2,036 / 1,854 / 1,717
NAND memory business / (1,369) / (937) / 600
Non-GAAP operating income / $24,241 / $26,209 / $26,069
16
Visuals: A single data table, no chart. Columns: row label, FY 2021, FY 2020, FY 2019 (values in millions, unaudited, as printed). Rows, in order: CCG $15,704 / $15,800 / $16,160; DCAI 8,439 / 11,076 / 9,927; NEX 1,711 / 846 / 1,739; AXG (1,207) / (403) / (353); Mobileye 554 / 323 / 318; IFS (23) / 45 / (213); All Other (5,722) / (4,009) / (5,543); GAAP operating income (bold) 19,456 / 23,678 / 22,035; indented Acquisition-related adjustments 1,492 / 1,416 / 1,324; indented Restructuring and other charges 2,626 / 198 / 393; indented Share-based compensation 2,036 / 1,854 / 1,717; indented NAND memory business (1,369) / (937) / 600; Non-GAAP operating income (bold) $24,241 / $26,209 / $26,069. Negative values are shown in parentheses. Horizontal rules: a thin white line above the header row and under each header, a rule under All Other, a rule under NAND memory business and a rule under the final Non-GAAP row. No charts, photographs or icons other than the Intel logo.
Slide 17
Historical Segment Revenue (Q1'21 – Q4'21)
(In Millions, unaudited) Q1 2021 Q2 2021 Q3 2021 Q4 2021
CCG $10,723 $10,253 $9,788 $10,303
DCAI 4,940 5,547 5,778 6,426
NEX 1,799 2,105 1,986 2,086
AXG 181 177 171 245
Mobileye 377 327 326 356
IFS 103 264 174 245
All Other 1,724 1,129 1,133 1,033
Total operating segment revenue 19,847 19,802 19,356 20,694
Less: Intersegment revenue (174) (171) (164) (166)
GAAP Revenue 19,673 19,631 19,192 20,528
Less: NAND memory business (1,107) (1,098) (1,105) (996)
Non-GAAP Revenue $18,566 $18,533 $18,087 $19,532
17
Visuals: Table: 4 numeric columns (Q1 2021, Q2 2021, Q3 2021, Q4 2021) plus a row-label column headed '(In Millions, unaudited)'. Rows in order: CCG $10,723 / $10,253 / $9,788 / $10,303; DCAI 4,940 / 5,547 / 5,778 / 6,426; NEX 1,799 / 2,105 / 1,986 / 2,086; AXG 181 / 177 / 171 / 245; Mobileye 377 / 327 / 326 / 356; IFS 103 / 264 / 174 / 245; All Other 1,724 / 1,129 / 1,133 / 1,033; Total operating segment revenue (bold) 19,847 / 19,802 / 19,356 / 20,694; Less: Intersegment revenue (indented) (174) / (171) / (164) / (166); GAAP Revenue (bold) 19,673 / 19,631 / 19,192 / 20,528; Less: NAND memory business (indented) (1,107) / (1,098) / (1,105) / (996); Non-GAAP Revenue (bold) $18,566 / $18,533 / $18,087 / $19,532. Values in millions of US dollars, unaudited. Thin white rules: a double rule above the column headers, a single underline beneath each Q header, and rules above the Total, GAAP Revenue, and Non-GAAP Revenue rows and beneath the Less rows, spanning the numeric columns only. No chart, no highlighted points, no legend. Background has faint translucent square tiles at the left and right edges.
Slide 18
Historical Segment Operating Income (Q1’21 – Q4’21)
(In Millions, unaudited)
Q1 2021
Q2 2021
Q3 2021
Q4 2021
CCG
$4,288
$4,029
$3,592
$3,795
DCAI
1,706
2,090
2,293
2,350
NEX
243
605
511
352
AXG
(176)
(168)
(222)
(641)
Mobileye
171
133
127
123
IFS
(34)
52
(44)
3
All Other
(2,504)
(1,195)
(1,030)
(993)
GAAP operating income
3,694
5,546
5,227
4,989
Acquisition-related adjustments
364
366
375
387
Restructuring and other charges
2,209
346
42
29
Share-based compensation
425
619
543
449
NAND memory business
(171)
(402)
(442)
(354)
Non-GAAP operating income
$6,521
$6,475
$5,745
$5,500
18
Visuals: A boxed financial table, no chart, no photograph. Columns: row label, Q1 2021, Q2 2021, Q3 2021, Q4 2021. Header row: (In Millions, unaudited) with the four quarter headers. Rows in order, values listed in Q1 / Q2 / Q3 / Q4 order: CCG $4,288 / $4,029 / $3,592 / $3,795. DCAI 1,706 / 2,090 / 2,293 / 2,350. NEX 243 / 605 / 511 / 352. AXG (176) / (168) / (222) / (641). Mobileye 171 / 133 / 127 / 123. IFS (34) / 52 / (44) / 3. All Other (2,504) / (1,195) / (1,030) / (993). GAAP operating income (bold) 3,694 / 5,546 / 5,227 / 4,989. Indented sub-rows: Acquisition-related adjustments 364 / 366 / 375 / 387; Restructuring and other charges 2,209 / 346 / 42 / 29; Share-based compensation 425 / 619 / 543 / 449; NAND memory business (171) / (402) / (442) / (354). Non-GAAP operating income (bold) $6,521 / $6,475 / $5,745 / $5,500. Thin white horizontal rules: one above the quarter headers spanning the four columns, one under the quarter headers, one under All Other, one under NAND memory business, and one under the Non-GAAP row. No highlighted points and no legend. Logo: the Intel wordmark in white, lowercase bold sans-serif, with a small blue dot over the i and a small registered mark, at bottom-right.
Slide 19
Reconciliation of Non-GAAP Actuals
Three Months Ended
(In Billions, Except Per Share Amounts)
Apr 2, 2022
Mar 27, 2021
GAAP revenue
$18.4
$19.7
NAND memory business
--
(1.1)
Non-GAAP revenue
$18.4
$18.6
GAAP gross margin percentage
50.4%
55.2%
Acquisition-related adjustments
1.9%
1.6%
Share-based compensation
0.8%
0.4%
NAND memory business
--%
1.7%
Non-GAAP gross margin percentage
53.1%
58.8%
GAAP earnings per share—diluted
$1.98
$0.82
Acquisition-related adjustments
0.10
0.09
Restructuring and other charges
(0.30)
0.54
Share-based compensation
0.17
0.10
(Gains) losses from divestiture
(0.27)
--
(Gains) losses on equity investments, net
(1.05)
(0.09)
NAND memory business
--
(0.04)
Tax Reform
(0.09)
--
Income tax effects
0.33
(0.08)
Non-GAAP earnings per share—diluted
$0.87
$1.34
19
Visuals: A single table, no chart, photograph or diagram. Title: 'Reconciliation of Non-GAAP Actuals'. Column headers: under a spanning label 'Three Months Ended', the columns are 'Apr 2, 2022' and 'Mar 27, 2021', with a row label column titled '(In Billions, Except Per Share Amounts)'. Rows in order with values for Apr 2, 2022 / Mar 27, 2021: GAAP revenue $18.4 / $19.7; NAND memory business -- / (1.1) (indented); Non-GAAP revenue $18.4 / $18.6 (bold, rules above and below); GAAP gross margin percentage 50.4% / 55.2% (bold); Acquisition-related adjustments 1.9% / 1.6% (indented); Share-based compensation 0.8% / 0.4% (indented); NAND memory business --% / 1.7% (indented); Non-GAAP gross margin percentage 53.1% / 58.8% (bold, rules); GAAP earnings per share—diluted $1.98 / $0.82 (bold); Acquisition-related adjustments 0.10 / 0.09; Restructuring and other charges (0.30) / 0.54; Share-based compensation 0.17 / 0.10; (Gains) losses from divestiture (0.27) / --; (Gains) losses on equity investments, net (1.05) / (0.09); NAND memory business -- / (0.04); Tax Reform (0.09) / --; Income tax effects 0.33 / (0.08); Non-GAAP earnings per share—diluted $0.87 / $1.34 (bold, rules above and below). Table panel: a rectangular translucent light-blue box with a soft lighter edge at top-left, no photograph. Background tile motifs: faint translucent squares at the right edge and lower left, very low contrast. The Intel logo is a white wordmark with a small blue-light accent dot over the i, and no other logos appear.
Slide 20
Reconciliation of Non-GAAP Q2 Outlook / Q2 2021 Actuals / Q2 2022 Outlook / (In Billions, Except Per Share Amounts) / Approximately / GAAP revenue | $19.6 | $18.0 / NAND memory business | (1.1) | -- / Non-GAAP revenue | $18.5 | $18.0 / GAAP gross margin | 57.1% | 48.1% / Acquisition-related adjustments | 1.6% | 1.8% / Share-based compensation | 0.5% | 1.1% / NAND memory business | 0.5% | -- / Non-GAAP gross margin | 59.8% | 51.0% / GAAP earnings per share—diluted | $1.24 | $0.50 / Acquisition-related adjustments | 0.09 | 0.09 / Restructuring and other charges | 0.08 | 0.01 / Share-based compensation | 0.15 | 0.23 / (Gains) losses from divestiture | -- | (0.01) / (Gains) losses on equity investments, net | (0.07) | (0.05) / NAND memory business | (0.09) | -- / Tax Reform | -- | (0.03) / Income tax effects | (0.04) | (0.04) / Non-GAAP earnings per share—diluted | $1.36 | $0.70 / 20
Visuals: A financial reconciliation table, not a chart, with three columns: row labels, 'Q2 2021 Actuals' and 'Q2 2022 Outlook' (subheader 'Approximately'). Rows top to bottom: header row; '(In Billions, Except Per Share Amounts)'; GAAP revenue $19.6 and $18.0; NAND memory business (1.1) and --; Non-GAAP revenue $18.5 and $18.0; GAAP gross margin 57.1% and 48.1%; Acquisition-related adjustments 1.6% and 1.8%; Share-based compensation 0.5% and 1.1%; NAND memory business 0.5% and --; Non-GAAP gross margin 59.8% and 51.0%; GAAP earnings per share—diluted $1.24 and $0.50; Acquisition-related adjustments 0.09 and 0.09; Restructuring and other charges 0.08 and 0.01; Share-based compensation 0.15 and 0.23; (Gains) losses from divestiture -- and (0.01); (Gains) losses on equity investments, net (0.07) and (0.05); NAND memory business (0.09) and --; Tax Reform -- and (0.03); Income tax effects (0.04) and (0.04); Non-GAAP earnings per share—diluted $1.36 and $0.70. White horizontal rules, about 0.1% thick, sit under the two column headers (y about 22.4%), under the NAND row (y about 31.2%), under Non-GAAP revenue values (y about 34.0%), under the NAND gross-margin row (y about 48.0%), under Non-GAAP gross margin values (y about 50.8%), under Income tax effects (y about 78.6%) and under Non-GAAP earnings per share values (y about 81.3%); the first column rule spans about x 58.3% to 70.4% and the second about x 71.6% to 83.5%. The panel is a translucent blue rectangle with a soft shadow beneath; no photographs, icons or chart elements. Highlighted totals are the Non-GAAP rows.
Slide 21
Reconciliation of Non-GAAP FY Outlook
Full-year 2021 Actuals
Full-year 2022 Outlook
(In Billions, Except Per Share Amounts)
Approximately
GAAP revenue
$79.0
$76.0
NAND memory business
(4.3)
--
Non-GAAP revenue
$74.7
$76.0
GAAP gross margin
55.4%
49.3%
Acquisition-related adjustments
1.6%
1.8%
Share-based compensation
0.4%
0.9%
NAND memory business
0.6%
--
Non-GAAP gross margin
58.1%
52.0%
GAAP earnings per share—diluted
$4.86
$4.19
Acquisition-related adjustments
0.36
0.36
Restructuring and other charges
0.65
(0.27)
Share-based compensation
0.49
0.82
(Gains) losses from divestiture
--
(0.30)
(Gains) losses on equity investments, net
(0.67)
(1.12)
NAND memory business
(0.33)
--
Tax Reform
--
(0.22)
Income tax effects
(0.06)
0.14
Non-GAAP earnings per share—diluted
$5.30
$3.60
(In Billions)
Full-year 2022 Outlook
GAAP cash flow from operations
$21.3
Net additions to property, plant and equipment
(27.0)
Payments on finance leases
(0.4)
Sale of equity investment1
4.6
Adjusted free cash flow
$(1.5)
1
Reflects Q1 2022 proceeds from the McAfee equity sale, which are included to facilitate a better, more consistent
comparison to past presentations of liquidity and historical treatment of McAfee equity distributions and sales.
intel
21
Visuals: Table with 3 columns: row labels, Full-year 2021 Actuals, Full-year 2022 Outlook (second header row 'Approximately' above the outlook values). Section 1 (In Billions): GAAP revenue $79.0 / $76.0; NAND memory business (4.3) / --; Non-GAAP revenue $74.7 / $76.0. Section 2 (percentages): GAAP gross margin 55.4% / 49.3%; Acquisition-related adjustments 1.6% / 1.8%; Share-based compensation 0.4% / 0.9%; NAND memory business 0.6% / --; Non-GAAP gross margin 58.1% / 52.0%. Section 3 (per share, diluted): GAAP earnings per share $4.86 / $4.19; Acquisition-related adjustments 0.36 / 0.36; Restructuring and other charges 0.65 / (0.27); Share-based compensation 0.49 / 0.82; (Gains) losses from divestiture -- / (0.30); (Gains) losses on equity investments, net (0.67) / (1.12); NAND memory business (0.33) / --; Tax Reform -- / (0.22); Income tax effects (0.06) / 0.14; Non-GAAP earnings per share $5.30 / $3.60. Section 4 (In Billions, Full-year 2022 Outlook only): GAAP cash flow from operations $21.3; Net additions to property, plant and equipment (27.0); Payments on finance leases (0.4); Sale of equity investment1 4.6; Adjusted free cash flow $(1.5). Horizontal white rules sit above subtotal rows and above the column headers; no chart, photograph or icon is present apart from the small intel logo and faint background squares.
Slide 22
Non-GAAP Changes: SBC and ICAP Portfolio Gains/Losses1 / (In Billions, Except Per Share Amounts) FY 2021 FY 2020 FY 2019 / GAAP net revenue $79.0 $77.9 $72.0 / NAND memory business (4.3) (5.0) (4.1) / Non-GAAP net revenue $74.7 $72.9 $67.9 / GAAP gross margin $43.8 $43.6 $42.1 / Acquisition-related adjustments 1.3 1.2 1.1 / Share-based compensation 0.3 0.3 0.3 / NAND memory business (2.0) (1.5) 0.0 / Non-GAAP gross margin $43.4 $43.6 $43.5 / GAAP gross margin percentage 55.4% 56.0% 58.6% / Acquisition-related adjustments 1.6% 1.6% 1.6% / Share-based compensation 0.4% 0.4% 0.3% / NAND memory business 0.6% 1.8% 3.5% / Non-GAAP gross margin percentage 58.1% 59.8% 64.1% / GAAP operating income $19.5 $23.7 $22.0 / Acquisition-related adjustments 1.5 1.4 1.3 / Restructuring and other charges 2.6 0.2 0.4 / Share-based compensation 2.0 1.9 1.7 / NAND memory business (1.4) (0.9) 0.6 / Non-GAAP operating income $24.2 $26.2 $26.1 / GAAP operating margin 24.6% 30.4% 30.6% / Acquisition-related adjustments 1.9% 1.8% 1.8% / Restructuring and other charges 3.3% 0.3% 0.5% / Share-based compensation 2.7% 2.4% 2.4% / NAND memory business (0.1)% 0.9% 2.9% / Non-GAAP operating margin 32.4% 36.0% 38.4% / GAAP earnings per share—diluted $4.86 $4.94 $4.71 / Acquisition-related adjustments 0.36 0.33 0.29 / Restructuring and other charges 0.65 0.05 0.09 / Share-based compensation 0.49 0.44 0.39 / (Gain)/loss on divestiture -- -- (0.16) / (Gain) loss on equity investments, net 2 (0.67) (0.45) (0.35) / NAND memory business (0.33) (0.22) 0.13 / Income tax effects (0.06) (0.03) (0.07) / Non-GAAP earnings per share—diluted $5.30 $5.06 $5.03 / 1 Changes effective beginning Q1 2022 / 2 The adjustment for gains and losses on equity investments includes the ongoing mark-to-market adjustments previously excluded from our non-GAAP results. / intel / 22
Visuals: Table, no chart. Columns: row label, FY 2021, FY 2020, FY 2019. The title row reads (In Billions, Except Per Share Amounts). Rows in order: GAAP net revenue $79.0 / $77.9 / $72.0; NAND memory business (4.3) / (5.0) / (4.1); Non-GAAP net revenue $74.7 / $72.9 / $67.9; GAAP gross margin $43.8 / $43.6 / $42.1; Acquisition-related adjustments 1.3 / 1.2 / 1.1; Share-based compensation 0.3 / 0.3 / 0.3; NAND memory business (2.0) / (1.5) / 0.0; Non-GAAP gross margin $43.4 / $43.6 / $43.5; GAAP gross margin percentage 55.4% / 56.0% / 58.6%; Acquisition-related adjustments 1.6% / 1.6% / 1.6%; Share-based compensation 0.4% / 0.4% / 0.3%; NAND memory business 0.6% / 1.8% / 3.5%; Non-GAAP gross margin percentage 58.1% / 59.8% / 64.1%; GAAP operating income $19.5 / $23.7 / $22.0; Acquisition-related adjustments 1.5 / 1.4 / 1.3; Restructuring and other charges 2.6 / 0.2 / 0.4; Share-based compensation 2.0 / 1.9 / 1.7; NAND memory business (1.4) / (0.9) / 0.6; Non-GAAP operating income $24.2 / $26.2 / $26.1; GAAP operating margin 24.6% / 30.4% / 30.6%; Acquisition-related adjustments 1.9% / 1.8% / 1.8%; Restructuring and other charges 3.3% / 0.3% / 0.5%; Share-based compensation 2.7% / 2.4% / 2.4%; NAND memory business (0.1)% / 0.9% / 2.9%; Non-GAAP operating margin 32.4% / 36.0% / 38.4%; GAAP earnings per share—diluted $4.86 / $4.94 / $4.71; Acquisition-related adjustments 0.36 / 0.33 / 0.29; Restructuring and other charges 0.65 / 0.05 / 0.09; Share-based compensation 0.49 / 0.44 / 0.39; (Gain)/loss on divestiture -- / -- / (0.16); (Gain) loss on equity investments, net 2 (0.67) / (0.45) / (0.35); NAND memory business (0.33) / (0.22) / 0.13; Income tax effects (0.06) / (0.03) / (0.07); Non-GAAP earnings per share—diluted $5.30 / $5.06 / $5.03. Section labels GAAP and Non-GAAP rows are white and bold-looking; the Share-based compensation rows and the equity investments row are yellow. Subtotal rows are underlined with thin white rules above the totals, and the column headers FY 2021, FY 2020 and FY 2019 are underlined. Highlighted points: the share-based compensation rows and the (Gain) loss on equity investments row are in yellow #FEC91B. Footnote superscript 2 sits beside the equity investments label. Apart from the table, the slide has a translucent blue panel behind the table, faint decorative square tiles in the background and a logo; no photographs or charts.
Slide 23
Non-GAAP Changes: SBC and ICAP Portfolio Gains/Losses
(In Billions, Except Per Share Amounts) | Q1 2021 Actuals | Q2 2021 Actuals | Q3 2021 Actuals | Q4 2021 Actuals
GAAP net revenue | $19.7 | $19.6 | $19.2 | $20.5
NAND memory business | (1.1) | (1.1) | (1.1) | (1.0)
Non-GAAP net revenue | $18.6 | $18.5 | $18.1 | $19.5
GAAP gross margin | $10.9 | $11.2 | $10.7 | $11.0
Acquisition-related adjustments | 0.3 | 0.3 | 0.3 | 0.3
Share-based compensation | 0.1 | 0.1 | 0.1 | 0.1
NAND memory business | (0.3) | (0.5) | (0.6) | (0.5)
Non-GAAP gross margin | $10.9 | $11.1 | $10.5 | $10.9
GAAP gross margin percentage | 55.2% | 57.1% | 56.0% | 53.6%
Acquisition-related adjustments | 1.6% | 1.6% | 1.7% | 1.6%
Share-based compensation | 0.4% | 0.5% | 0.5% | 0.4%
NAND memory business | 1.7% | 0.5% | 0.1% | 0.2%
Non-GAAP gross margin percentage | 58.8% | 59.8% | 58.3% | 55.8%
GAAP operating income | $3.7 | $5.5 | $5.2 | $5.0
Acquisition-related adjustments | 0.4 | 0.4 | 0.4 | 0.4
Restructuring and other charges | 2.2 | 0.3 | 0.0 | 0.0
Share-based compensation | 0.4 | 0.6 | 0.5 | 0.4
NAND memory business | (0.2) | (0.4) | (0.4) | (0.4)
Non-GAAP operating income | $6.5 | $6.5 | $5.7 | $5.5
GAAP operating margin | 18.8% | 28.3% | 27.2% | 24.3%
Acquisition-related adjustments | 1.9% | 1.9% | 2.0% | 1.9%
Restructuring and other charges | 11.2% | 1.8% | 0.2% | 0.1%
Share-based compensation | 2.2% | 3.2% | 2.8% | 2.2%
NAND memory business | 1.0% | (0.3)% | (0.6)% | (0.5)%
Non-GAAP operating margin | 35.1% | 34.9% | 31.8% | 28.2%
GAAP earnings per share—diluted | $0.82 | $1.24 | $1.67 | $1.13
Acquisition-related adjustments | 0.09 | 0.09 | 0.09 | 0.09
Restructuring and other charges | 0.54 | 0.08 | 0.01 | 0.01
Share-based compensation | 0.10 | 0.15 | 0.13 | 0.11
(Gain) loss on equity investments, net | (0.09) | (0.07) | (0.42) | (0.09)
NAND memory business | (0.04) | (0.09) | (0.10) | (0.08)
Income tax effects | (0.08) | (0.04) | 0.07 | (0.02)
Non-GAAP earnings per share—diluted | $1.34 | $1.36 | $1.45 | $1.15
23
Visuals: Table: a financial data table with 5 columns: row label, Q1 2021 Actuals, Q2 2021 Actuals, Q3 2021 Actuals, Q4 2021 Actuals. Heading line '(In Billions, Except Per Share Amounts)' sits above the rows in the label column. Rows, in order: GAAP net revenue $19.7 $19.6 $19.2 $20.5; NAND memory business (1.1) (1.1) (1.1) (1.0), indented; Non-GAAP net revenue $18.6 $18.5 $18.1 $19.5, bold with rules above the figures; blank row; GAAP gross margin $10.9 $11.2 $10.7 $11.0; Acquisition-related adjustments 0.3 0.3 0.3 0.3; Share-based compensation 0.1 0.1 0.1 0.1 (yellow); NAND memory business (0.3) (0.5) (0.6) (0.5); Non-GAAP gross margin $10.9 $11.1 $10.5 $10.9, bold with rule above; blank row; GAAP gross margin percentage 55.2% 57.1% 56.0% 53.6%; Acquisition-related adjustments 1.6% 1.6% 1.7% 1.6%; Share-based compensation 0.4% 0.5% 0.5% 0.4% (yellow); NAND memory business 1.7% 0.5% 0.1% 0.2%; Non-GAAP gross margin percentage 58.8% 59.8% 58.3% 55.8%, bold with rule above; blank row; GAAP operating income $3.7 $5.5 $5.2 $5.0; Acquisition-related adjustments 0.4 0.4 0.4 0.4; Restructuring and other charges 2.2 0.3 0.0 0.0; Share-based compensation 0.4 0.6 0.5 0.4 (yellow); NAND memory business (0.2) (0.4) (0.4) (0.4); Non-GAAP operating income $6.5 $6.5 $5.7 $5.5, bold with rule above; blank row; GAAP operating margin 18.8% 28.3% 27.2% 24.3%; Acquisition-related adjustments 1.9% 1.9% 2.0% 1.9%; Restructuring and other charges 11.2% 1.8% 0.2% 0.1%; Share-based compensation 2.2% 3.2% 2.8% 2.2% (yellow); NAND memory business 1.0% (0.3)% (0.6)% (0.5)%; Non-GAAP operating margin 35.1% 34.9% 31.8% 28.2%, bold with rule above; blank row; GAAP earnings per share—diluted $0.82 $1.24 $1.67 $1.13; Acquisition-related adjustments 0.09 0.09 0.09 0.09; Restructuring and other charges 0.54 0.08 0.01 0.01; Share-based compensation 0.10 0.15 0.13 0.11 (yellow); (Gain) loss on equity investments, net (0.09) (0.07) (0.42) (0.09) (yellow); NAND memory business (0.04) (0.09) (0.10) (0.08); Income tax effects (0.08) (0.04) 0.07 (0.02); Non-GAAP earnings per share—diluted $1.34 $1.36 $1.45 $1.15, bold with rule above. Yellow #FEC91B rows highlight share-based compensation and the equity-investment gain/loss line. Logo: the Intel wordmark 'intel' in white with a small registered mark, bottom right. No charts or photographs.
Slide 24
intel®
Visuals: A white Intel wordmark logo, lowercase bold geometric sans-serif letters 'intel' with a small registered trademark symbol ® at the lower right of the 'l'. Behind it, a subtle abstract background of translucent darker-blue rectangles and squares of varying sizes at the top, left and right edges, plus small bright cyan (#00C7FD) square accents at the top right corner and lower left corner. A soft radial glow brightens toward the bottom centre. The logo is the only foreground element; no photograph, chart or table.
Download this deck
The hosted PDF of every library deck is free for readers of the SlideDeck Co newsletter. Join with your email and the viewer and download appear here.
Preparing a results presentation or business update of your own? The SlideDeck Co Standard Deck is a slide library for business reviews, updates and plans.







