
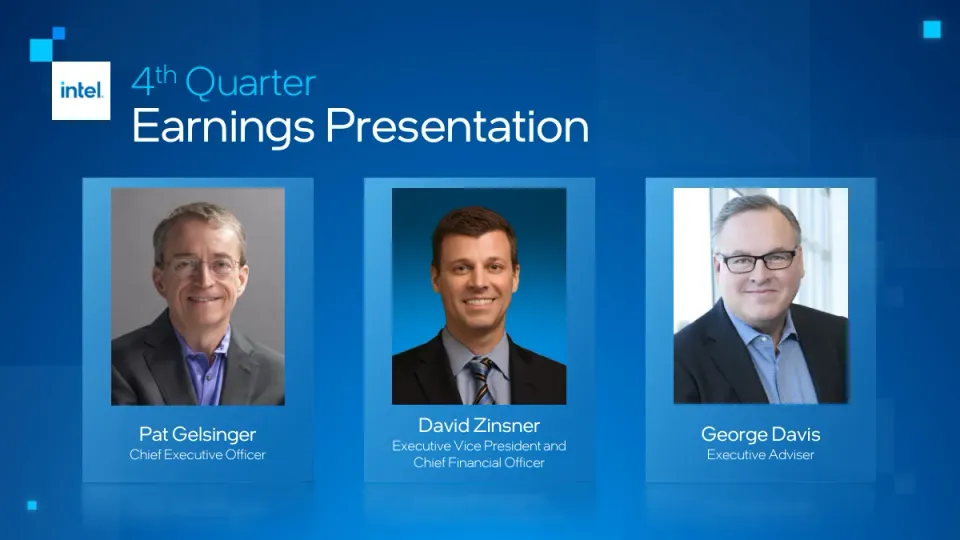
The deck opens with a title slide naming CEO Pat Gelsinger, CFO David Zinsner and adviser George Davis, followed by a disclosures slide covering non-GAAP measures and forward-looking statements. An executive summary then lists the quarter's headline results and strategic moves, including the Ohio fab announcement and the planned Mobileye public listing. The middle section covers an industry outlook and the strategy in three pillars: IDM 2.0, leadership products and shareholder value. A best-year-ever results slide follows, with large figures for revenue, gross margin and EPS. Segment slides come next for the Client Computing Group, Data Center Group, and other businesses such as IOTG, Mobileye and PSG. Each pairs a headline with a short bullet list and a bar or stacked chart. The deck closes with a Q1 2022 outlook slide showing three large numbers, then an appendix of reconciliation tables translating GAAP results into non-GAAP figures across several years. The visual style is consistent, with blue backgrounds, one sans-serif typeface and a sentence-style conclusion line under each chart.
Slides worth studying
- Slide 3: The executive summary uses three bold headline statements, each with a smaller supporting line, to make the quarter's story scannable in seconds.
- Slide 6: Large KPI tiles with a small caption for change versus guidance and prior year present the results at a glance, with a bar chart of five-year revenue as the anchor.
- Slide 7: The segment slide pairs a stacked bar chart with a compact YoY table and a one-line takeaway, a clear and repeatable pattern for business-unit reviews.
- Slide 11: The Q1 outlook uses three equal blocks with one large figure each, keeping the forward guidance visually simple and easy to compare.
Details
- Company: Intel
- Year: 2022
- Type: Investor presentation
- Industry: Semiconductors
- Pages: 17
The hosted copy of this deck is being prepared. Newsletter readers will find the download here.
Review score: 7 out of 10, Effective
Presentation quality, judged with the SlideDeck Co review heuristic. Ask, evidence and idea merit are not rated here.
The strength is that the numbers are easy to find and the segment pages explain themselves: slide 6 pairs Q4'21 and 2021 in two columns with each figure measured against October guidance, and slides 7 and 8 state causes under the charts, including the one-time Intel Federal charge behind operating income down 17% on revenue up 20%. Results and outlook are separated by a divider on slide 10 and the appendix reconciles the five-year revenue series used on slide 6. The bottleneck is a celebratory frame that sits awkwardly on the figures: slide 6 is headed Best Year Ever with a list of six records, while its own cards show quarterly gross margin Down 4.6 ppt YoY and EPS Down 26% YoY in the smallest type on the slide. Slide 11 then guides to 52% gross margin, Down 6.8 ppt YoY, and $0.80 EPS, Down 40% YoY, with no explanation, and a footnote there changes the non-GAAP basis without saying so in the body. Slide 4 is three stock photos under one-line captions.
Worth keeping: Keep the two-column quarter and full-year layout on slide 6 with the guidance gap under each figure.
Most useful repair: Retitle slide 6 neutrally and give the gross margin and EPS declines the same weight as the records, then add driver lines and the basis change to the body of slide 11.
What would change the score: If slides 15 and 16, read only at contact-sheet size, clearly restate prior periods on the new basis in a way the outlook slide points to, the basis-change concern would ease but the score would stay at 7.
Confidence high. 17 of 17 pages inspected on contact sheets, 12 at readable size. Reviewed 2026-11-15. Model-assisted review (claude-fable-5-2, in session).
Full text of the slides (17 slides)
Every slide's words and a description of its charts and images, so the deck can be searched and rebuilt. Also available as Markdown.
Slide 1
4th Quarter
Earnings Presentation
Pat Gelsinger
Chief Executive Officer
David Zinsner
Executive Vice President and
Chief Financial Officer
George Davis
Executive Adviser
Visuals: Three head-and-shoulders portrait photographs, each set in a rectangular, unrounded, uncropped frame of about 18% by 40% of slide width and height, sitting inside a larger translucent blue panel. Left: Pat Gelsinger, a smiling man with short greying hair and wire-rimmed glasses, wearing a dark grey suit and a purple-blue checked open-collar shirt, against a flat mid-grey studio backdrop, soft even front lighting. Centre: David Zinsner, a smiling man with short brown hair, wearing a navy suit, light blue shirt and a blue-and-gold striped tie, against a deep navy-to-bright-blue vertical gradient backdrop, soft front lighting. Right: George Davis, a smiling man with grey hair and dark rectangular glasses, wearing a navy suit and light blue shirt, against a bright, out-of-focus window background of white and pale grey, soft natural light. Each photo is boxed, not full-bleed. Also an Intel logo in a white square (dark blue wordmark 'intel' with a small registered mark), and decorative square motifs: a cluster of cyan and blue squares at top-left, a single cyan square at top-right and a small cyan square at bottom-left, plus faint translucent tile shapes across the background.
Slide 2
Disclosures
This presentation contains non-GAAP financial measures. Intel revenue, gross margin, and earnings per share are presented on a non-GAAP basis except with respect to our Q1 2022 revenue outlook or as otherwise indicated. This presentation also includes a non-GAAP free cash flow (FCF) measure. The Appendix provides a reconciliation of these measures to the most directly comparable GAAP financial measure. The non-GAAP financial measures disclosed by Intel should not be considered a substitute for, or superior to, the financial measures prepared in accordance with GAAP. Please refer to “Explanation of Non-GAAP Measures” in Intel's quarterly earnings release for a detailed explanation of the adjustments made to the comparable GAAP measures, the ways management uses the non-GAAP measures, and the reasons why management believes the non-GAAP measures provide investors with useful supplemental information.
Statements in this presentation that refer to business outlook, plans, and expectations are forward-looking statements that involve risks and uncertainties. Words such as "anticipate," "expect," "intend," "goal," "plans," "believe," "seek," "estimate," "continue," “committed,” “on-track,” ”positioned,” “ramp,” “momentum,” “roadmap,” “pipeline,” “progress,” “forecast,” “likely,” “guide,” “potential,” “future,” "may," "will," “would,” "should," “could,” and variations of such words and similar expressions are intended to identify such forward-looking statements. Statements that refer to or are based on estimates, forecasts, projections, uncertain events or assumptions, including statements relating to Intel’s strategy; manufacturing expansion and investment plans, including our planned Ohio investments; financial projections; future dividends; plans and goals related to Intel’s foundry business; total addressable market (TAM) and market opportunity; future impacts of the COVID-19 pandemic; future legislation; future products, technology, and services, and the expected availability and benefits of such products, technology, and services, including product ramps, and manufacturing plans, goals, timelines, and future progress, including expectations regarding process performance parity and leadership and process technology timelines issued in July 2021; pending transactions; the proposed Mobileye IPO; supply expectations, including regarding industry shortages and sufficiency of future supply; future EUV tools; future external foundry usage; expectations regarding customers; projections regarding competitors; business plans and financial expectations; and anticipated trends in our businesses or the markets relevant to them, including future demand and industry growth, also identify forward-looking statements. Such statements involve many risks and uncertainties that could cause actual results to differ materially from those expressed or implied in these forward-looking statements. Important factors that could cause actual results to differ materially are set forth in Intel's earnings release dated January 26, 2022, which is included as an exhibit to Intel’s Form 8-K furnished to the SEC on such date, and in Intel's SEC filings, including the company's most recent reports on Forms 10-K and 10-Q. Copies of Intel’s SEC filings may be obtained by visiting our Investor Relations website at www.intc.com or the SEC's website at www.sec.gov.
All information in this presentation reflects management’s views as of January 26, 2022. Intel does not undertake, and expressly disclaims any duty, to update any statement made in this presentation, whether as a result of new information, new developments or otherwise, except to the extent that disclosure may be required by law.
2
Visuals: No charts, tables, or photographs. Full-bleed background image of a blue gradient, lighter at top centre and darker toward the bottom corners, with faint translucent lighter square tiles, mainly in the upper left and along the left and right edges. The Intel logo, the white 'intel' wordmark with a small blue-white tittle over the i and a small registered mark, sits at bottom right at about x 92.2%, y 95.1%, w 4.2%, h 2.9%.
Slide 3
Executive Summary
Beat expectations on revenue, GM, and EPS in Q4
Highest quarterly and full year revenue ever
Advancing our IDM 2.0 advantage
Announced U.S. manufacturing site in Ohio
Demonstrating superior agility in a supply-constrained environment
Optimizing investments; unlocking shareholder value
Completed first close of NAND sale; announced intent to take Mobileye public
Raising the dividend 5%
3
Visuals: One photograph of an Intel Core processor (a boxed-style CPU package, rendered as a product photo). Subject: a green printed-circuit substrate with gold contact pads along its top and bottom edges and small notches, carrying a brushed-silver metal heat spreader. The spreader has rounded corners and a chamfered outline. The spreader shows the printed text 'intel' in small grey lettering above a large 'CORE' wordmark in dark grey and charcoal, with a small TM mark at the top right of 'CORE'. The image is lit from the upper left with soft studio lighting; the spreader shows a diagonal light sheen. Dominant colours: green #1E8C6E substrate, silver #C8CDD2 to #8E959C metal, charcoal #3A3F45 lettering. Framing: full package shown straight-on, not cropped, with a soft drop shadow beneath it. Three blue rectangular panels with white text overlay the right side (see elements). Faint translucent tinted square shapes are scattered over the background at the upper left and lower left. The Intel logo is shown in white at bottom right.
Slide 4
Industry Outlook
Unprecedented Market
Demand Continues
Ecosystem Constraints Improve
but Persist into 2023
Continued Need for
Resilient Supply Chain
intel CORE
intel
4
Visuals: Three photographs in boxed rectangles, no rounded corners, no borders. (1) Left column, a close-up render of a yellow-highlighted Intel Core processor package on a dark circuit board with glowing blue traces; the chip label reads intel CORE; the chip is centred, viewed from above at an angle, lit by blue and yellow light against a near-black background; the image fills its box and is not cropped at the edges. (2) Centre column, a flat-lay product photograph on a white background of PC computer components: a black graphics card at upper left, a black ATX motherboard with heatsinks and a black power supply at upper right, two black RAM sticks in the centre-left, a small clear acrylic water block, clear tubing, black clamps, a black pump or fan housing, and two black case fans with red centres at lower right; soft even studio lighting; dominant colours black, grey and white; the image fills its box and is slightly cropped at the right and top edges. (3) Right column, an overhead aerial photograph of a container port: a container ship with stacked containers in red, orange, blue and white along its deck, yellow-green gantry cranes running vertically across the frame, dark teal sea at upper left; daylight; dominant colours teal, red, yellow-green and grey; full-height framing with the image fully inside its box. The three photos have faint reflections beneath them that fade into the background.
Slide 5
Executing on our Strategy
IDM 2.0
Leadership Products
Shareholder Value
Alder Lake
Sapphire Rapids
Alchemist
Ponte Vecchio
Intel 7 shipping in volume
Announced new U.S. fab site in Ohio
Industry’s first production high-NA EUV tool
Robust lineup of leadership products
driving momentum in 2022
Announced intent to take Mobileye public
First close of NAND sale
5
Visuals: Three photographs and a grid of four chip images. Left panel: a full-width photograph of a large modern Intel fab building seen from an elevated angle, with a glass-and-grey multi-storey facade, a flat roof, trees and a large parking lot in the foreground, under a pale blue sky with a few clouds; daylight, cool and natural tones dominated by grey, white, green and blue; boxed, not cropped in its own frame. Middle panel: four product images in a 2 by 2 grid with labels beneath each. Top-left Alder Lake: a tall vertical dark package with blue tiles and a thin stripe. Top-right Sapphire Rapids: a flat rectangular dark package with four large gold-brown tiles on a black substrate, lit from above. Bottom-left Alchemist: two dark GPU dies side by side, each with a blue-violet screen-like tile. Bottom-right Ponte Vecchio: an exploded stack of small gold and dark tiles above a dark base. Right panel: a photograph of many white Mobileye-branded sport-utility vehicles parked in rows on an asphalt lot, with one car centred in the foreground facing the camera; a beige multi-storey building with rows of windows and a glass curved section behind, palm and pine trees to the right, a partly cloudy sky with warm light; boxed, not cropped.
Slide 6
Best Year Ever
Q4’21
2021
Consistently Growing Revenue
$59.3B
$66.7B
$67.9B
$72.9B
$74.7B
2017
2018
2019
2020
2021
Records
• Highest FY revenue ever
• Highest quarterly revenue ever
• Record FY CCG revenue
• Record Quarterly DCG revenue
• Record Quarterly and FY IOTG revenue
• Record FY Mobileye revenue
$19.5B
Revenue
$1.2B above Oct guidance
Up 4% YoY
$74.7B
Revenue
$1.2B above Oct guidance
Up 2% YoY
55.4%
Gross Margin
1.9 ppt above Oct guidance
Down 4.6 ppt YoY
57.7%
Gross Margin
0.7 ppt above Oct guidance
Down 1.7 ppt YoY
$1.09
EPS
$0.19 above Oct guidance
Down 26% YoY
$5.47
EPS
$0.19 above Oct guidance
Up 7% YoY
Results and YoY comparisons exclude the NAND memory business.
6
Visuals: Bar chart titled 'Consistently Growing Revenue', vertical bars, five categories 2017 to 2021 on the horizontal axis (no axis unit labels shown), no value axis or gridlines shown. Labelled values: 2017 $59.3B, 2018 $66.7B, 2019 $67.9B, 2020 $72.9B, 2021 $74.7B. Bars are solid #004A86 navy of roughly equal width, with heights about proportional to the values (2017 shortest, 2021 tallest). Value labels sit above each bar in white. A thin white horizontal baseline runs beneath the bars. No legend. No highlighted points. Chart sits on a light-blue to mid-blue gradient panel. Six metric cards, each a glossy blue rectangle with a lighter top-left sheen and subtle drop shadow: Q4’21 column: $19.5B Revenue, 55.4% Gross Margin, $1.09 EPS; 2021 column: $74.7B Revenue, 57.7% Gross Margin, $5.47 EPS. Thin vertical white divider line separates the Records label from the bullet list. Intel logo (white wordmark with small blue accent dot and registered mark) at bottom right. No photographs.
Slide 7
Client Computing Group
Revenue ($B) down 7%
Operating Income ($B) down 23%
$10.9
$10.1
$1.0
$0.7
$9.9
$9.4
$4.5
$3.5
Op Margin
41%
Op Margin
34%
Q4'20
Q4'21
Q4'20
Q4'21
Platform
Adjacencies
YoY Revenue
Platform
(5%)
Adjacencies1
(28%)
Market Segments
YoY Revenue
Notebook
(16%)
Desktop
19%
CCG Platform
YoY
PC Volumes
(18%)
Notebook ASP
14%
Desktop ASP
11%
Lower revenue on ecosystem constraints and modem ramp down
Lower operating income on less reserve sell-through and investment for Intel 4
1. CCG adjacencies include modem, wireless communications, wired connectivity, systems, and (prior to Q3 2020 divestiture) connected home products.
intel
7
Visuals: Chart 1: vertical stacked bar chart titled 'Revenue ($B) down 7%'. Categories Q4'20 and Q4'21. Series Platform (dark blue #004A86 bottom segment) with labelled values $9.9 (Q4'20) and $9.4 (Q4'21). Series Adjacencies (very dark navy #002543 top segment) with labelled values $1.0 (Q4'20) and $0.7 (Q4'21). Total labels above bars: $10.9 (Q4'20) and $10.1 (Q4'21). No axis values or units printed beyond $B; no gridlines; baseline is a thin white horizontal line. Legend at bottom left of panel: blue square labelled Platform, dark navy square labelled Adjacencies. Chart 2: vertical bar chart titled 'Operating Income ($B) down 23%'. Categories Q4'20 and Q4'21, single series in sage green #8BAE46 with labels $4.5 (Q4'20) and $3.5 (Q4'21) above bars; inside each bar 'Op Margin' with 41% (Q4'20) and 34% (Q4'21). Baseline thin white line; no axis or gridlines. Table 1 (top right): two columns, header row blank and 'YoY Revenue'; rows Platform (5%) and Adjacencies1 (28%). Table 2: header 'Market Segments' and 'YoY Revenue'; rows Notebook (16%) and Desktop 19%. Table 3: header 'CCG Platform' and 'YoY'; rows PC Volumes (18%), Notebook ASP 14%, Desktop ASP 11%. Table headers are slightly darker filled cells, body rows have no fill. Intel logo: white lowercase wordmark 'intel' with a small light-blue dot over the i, bottom right at about x 92 to 96. No photographs or illustrations.
Slide 8
Data Center Group
Revenue ($B) up 20%
Operating Income ($B) down 17%
$7.3
$0.9
$6.1
$0.8
$6.4
$5.3
$2.1
$1.7
Op Margin 34%
Op Margin 24%
Q4'20
Q4'21
Q4'20
Q4'21
Platform
Adjacencies
YoY Revenue
Platform 22%
Adjacencies1 9%
Market Segments YoY Revenue
Cloud SP (5%)
Enterprise & Gov. 53%
Comms SP 22%
DCG Platform YoY
Unit Volumes 17%
ASPs 4%
Record revenue on strong enterprise demand
Lower operating income on one-time Intel Federal charge, 10nm mix, and increased investment
1. DCG adjacencies include Optane (beginning in 2021), AI accelerator, ethernet, 5G and silicon photonics products.
8
Visuals: Left chart panel contains two bar charts with no axes and no gridlines. Chart 1, titled 'Revenue ($B) up 20%', has stacked columns. Q4'20 column: Platform segment $5.3 (dark blue #004A86), Adjacencies segment $0.8 (very dark navy #002543), total $6.1 printed above. Q4'21 column: Platform $6.4 (#004A86), Adjacencies $0.9 (#002543), total $7.3 printed above. Both columns sit on a thin white baseline. Chart 2, titled 'Operating Income ($B) down 17%', has two green columns (#8BAE46) on a white baseline, labelled Q4'20 and Q4'21. Q4'20 column: $2.1 above, 'Op Margin 34%' inside. Q4'21 column: $1.7 above, 'Op Margin 24%' inside, drawn slightly shorter. Legend below chart 1 baseline: dark blue square then 'Platform', very dark navy square then 'Adjacencies'. No values are printed on a scale and no points are highlighted. Right panel holds three white-text tables with dark header bars. Table 1 has an empty header cell and 'YoY Revenue', then rows Platform 22% and Adjacencies (superscript 1) 9%. Table 2 has header 'Market Segments' and 'YoY Revenue', then rows Cloud SP (5%), Enterprise & Gov. 53%, Comms SP 22%. Table 3 has header 'DCG Platform' and 'YoY', then rows Unit Volumes 17% and ASPs 4%. Background is a textured blue image with faint geometric tiles, no photograph of people or objects. Intel logo at bottom right, a small mark with a blue dot on the i.
Slide 9
Other Business Segments
IOT: IOTG + Mobileye ($M)
PSG ($M)
Rev Op Income
Rev Op Income
$356
$333
$1,058
$777
$99
$110
$270
$123
Q4’20
Q4’21
IOTG
Mobileye
Record IOTG revenue up 36% YoY and
operating income up 120% YoY driven by
COVID recovery
MBLY revenue up 7% YoY on improvement in
global vehicle production; operating income
down 10% YoY
$422
$43
$484
$51
Q4’20
Q4’21
PSG revenue up 15% YoY on strong demand
Operating income up 19% YoY
Our NSG operating segment is composed entirely of our NAND memory business and had GAAP results of $996M revenue and $354M operating income for Q4 2021.
NSG is not presented because we completed the first closing of the sale of our NAND memory business on Dec. 29, 2021 and we exclude the business from non-GAAP results.
9
Visuals: Two bar charts, both with no axis lines labelled with numbers, no y-axis scale, only a thin white baseline under the bars and category labels below. LEFT CHART titled IOT: IOTG + Mobileye ($M); legend top-left: dark blue square Rev, green square Op Income; bottom legend: green square and dark blue square labelled IOTG, green outlined square and dark blue outlined square labelled Mobileye. Categories Q4’20 and Q4’21. Rev bars (dark blue #004A86) are stacked: Q4’20 IOTG $777 solid dark blue bottom segment with Mobileye $333 outlined segment above it (outline blue, fill none); Q4’21 IOTG $1,058 solid segment with Mobileye $356 outlined segment above. Op Income bars (green #8BAE46) are stacked: Q4’20 IOTG $123 solid green with Mobileye $110 outlined green segment above; Q4’21 IOTG $270 solid green with Mobileye $99 outlined green segment above. No highlighted points. RIGHT CHART titled PSG ($M); legend top-left Rev dark blue, Op Income green; categories Q4’20 and Q4’21 with side-by-side non-stacked bars: Q4’20 Rev $422 dark blue, Op Income $43 green; Q4’21 Rev $484 dark blue, Op Income $51 green. Op income bars are very short, about 2 to 3% of slide height. No axes ranges printed. Intel logo bottom-right is a flat wordmark.
Slide 10
Outlook
intel®
10
Visuals: Full-bleed background image: a blue radial gradient with faint translucent squares and rectangles at the edges (a large rectangle top-left, small squares at top-left, a tall rectangle at the right edge near upper right, a block at lower-left, a square at lower-right, and small squares near the bottom-right). The title 'Outlook' is a placed image, about 226 by 49 pixels, rendered in a light sans-serif with a soft white-to-lavender gradient. The intel logo is a white wordmark with a registered mark, with a small cyan accent over the 'i'.
Slide 11
Q1 2022 Outlook1
$18.3B
Revenue
Down 1% YoY
52%
Gross Margin
Down 6.8 ppt YoY
$0.80
EPS
Down 40% YoY
1 Outlook and YoY comparisons exclude share-based compensation and gains/losses on equity investments.
intel
11
Visuals: Three square-ish translucent light-blue cards (rectangles with a lighter top-left to darker bottom-right gradient, each with a soft reflection/shadow beneath, sharp corners) containing large white figures and labels; no charts, photographs or icons other than the Intel wordmark logo in the bottom right corner. Faint translucent square tiles in the background at top-left, right and bottom-left act as decoration.
Slide 12
Appendix
Visuals: Full-bleed blue gradient background with faint translucent rectangles and squares at the edges (top-left, left, right and bottom-right). No photograph, chart, logo or icon. The only other visual is the word 'Appendix' as a raster image with a white-to-lavender gradient fill.
Slide 13
Reconciliation of Non-GAAP Actuals
Three Months Ended
Twelve Months Ended
Twelve Months Ended
(In Billions, Except Per Share Amounts)
Dec 25, 2021
Dec 26, 2020
Dec 25, 2021
Dec 26, 2020
Dec 28, 2019
Dec 29, 2018
Dec 30, 2017
GAAP revenue
$20.5
$20.0
$79.0
$77.9
$72.0
$70.8
$62.8
NAND memory business
(1.0)
(1.1)
(4.3)
(5.0)
(4.1)
(4.1)
(3.5)
Non-GAAP revenue
$19.5
$18.9
$74.7
$72.9
$67.9
$66.7
$59.3
GAAP gross margin percentage
53.6%
56.8%
55.4%
56.0%
Acquisition-related adjustments
1.6%
1.6%
1.6%
1.6%
NAND memory business
0.2%
1.7%
0.6%
1.8%
Non-GAAP gross margin percentage
55.4%
60.0%
57.7%
59.4%
GAAP earnings per share—diluted
$1.13
$1.42
$4.86
$4.94
Acquisition-related adjustments
0.09
0.09
0.36
0.33
Restructuring and other charges
0.01
0.02
0.65
0.05
Ongoing mark-to-market on marketable equity securities
(0.05)
0.01
0.03
0.03
NAND memory business
(0.08)
(0.04)
(0.33)
(0.22)
Income tax effects
(0.01)
(0.02)
(0.10)
(0.03)
Non-GAAP earnings per share—diluted
$1.09
$1.48
$5.47
$5.10
13
Visuals: A table of financial reconciliation values in billions of dollars, except per share amounts. Columns: row label; Three Months Ended Dec 25, 2021 and Dec 26, 2020; Twelve Months Ended Dec 25, 2021 and Dec 26, 2020; Twelve Months Ended Dec 28, 2019, Dec 29, 2018 and Dec 30, 2017. Rows: GAAP revenue $20.5 / $20.0 / $79.0 / $77.9 / $72.0 / $70.8 / $62.8; NAND memory business (1.0) / (1.1) / (4.3) / (5.0) / (4.1) / (4.1) / (3.5); Non-GAAP revenue $19.5 / $18.9 / $74.7 / $72.9 / $67.9 / $66.7 / $59.3; GAAP gross margin percentage 53.6% / 56.8% / 55.4% / 56.0%; Acquisition-related adjustments 1.6% in all four columns; NAND memory business 0.2% / 1.7% / 0.6% / 1.8%; Non-GAAP gross margin percentage 55.4% / 60.0% / 57.7% / 59.4%; GAAP earnings per share—diluted $1.13 / $1.42 / $4.86 / $4.94; Acquisition-related adjustments 0.09 / 0.09 / 0.36 / 0.33; Restructuring and other charges 0.01 / 0.02 / 0.65 / 0.05; Ongoing mark-to-market on marketable equity securities (0.05) / 0.01 / 0.03 / 0.03; NAND memory business (0.08) / (0.04) / (0.33) / (0.22); Income tax effects (0.01) / (0.02) / (0.10) / (0.03); Non-GAAP earnings per share—diluted $1.09 / $1.48 / $5.47 / $5.10. Thin white horizontal rules sit under column headers and above subtotal rows. Intel logo in white at bottom right. No photographs or charts.
Slide 14
Reconciliation of Non-GAAP Outlook
Q1 2021 Actuals
Q1 2022 Outlook
(In Billions, Except Per Share Amounts)
Approximately
GAAP revenue $19.7 $18.3
NAND memory business (1.1) --
Non-GAAP revenue $18.6 $18.3
GAAP gross margin 55.2% 49.4%
Acquisition-related adjustments 1.6% 1.9%
Share-based compensation 0.4% 0.6%
NAND memory business 1.7% --
Non-GAAP gross margin 58.8% 52.0%
GAAP earnings per share—diluted $0.82 $0.70
Acquisition-related adjustments 0.09 0.10
Restructuring and other charges 0.54 0.00
Share-based compensation 0.10 0.18
(Gains) losses from divestiture -- (0.25)
(Gains) losses on equity investments, net (0.09) (0.02)
NAND memory business (0.04) --
Income tax effects (0.08) 0.09
Non-GAAP earnings per share—diluted $1.34 $0.80
14
Visuals: A financial reconciliation table with no chart, no photograph and no logo other than the Intel wordmark. Columns: row label (left, no header text beyond '(In Billions, Except Per Share Amounts)'), 'Q1 2021 Actuals' (values right-aligned), and 'Q1 2022 Outlook' with a sub-header 'Approximately' (values right-aligned). Rows in order: GAAP revenue $19.7 / $18.3; NAND memory business (1.1) / --; Non-GAAP revenue $18.6 / $18.3; GAAP gross margin 55.2% / 49.4%; Acquisition-related adjustments 1.6% / 1.9%; Share-based compensation 0.4% / 0.6%; NAND memory business 1.7% / --; Non-GAAP gross margin 58.8% / 52.0%; GAAP earnings per share—diluted $0.82 / $0.70; Acquisition-related adjustments 0.09 / 0.10; Restructuring and other charges 0.54 / 0.00; Share-based compensation 0.10 / 0.18; (Gains) losses from divestiture -- / (0.25); (Gains) losses on equity investments, net (0.09) / (0.02); NAND memory business (0.04) / --; Income tax effects (0.08) / 0.09; Non-GAAP earnings per share—diluted $1.34 / $0.80. Indented sub-items sit under bold totals. Thin white horizontal rules sit above each subtotal row and under the column headers, at about 24.4%, 33.4%, 36.4%, 50.9%, 53.8%, 79.9% and 82.8% from the top, spanning the Q1 2021 column (x 60.9% to 73.5%) and the Q1 2022 column (x 74.7% to 87.2%). Totals are bold, sub-items regular. Behind the table, faint translucent square tiles in mid blue are scattered at the edges of the slide, and a soft dark shadow sits under the panel.
Slide 15
Non-GAAP Changes: SBC and ICAP Portfolio Gains/Losses
1
(In Billions, Except Per Share Amounts) | FY 2021 | FY 2020 | FY 2019
GAAP net revenue | $79.0 | $77.9 | $72.0
NAND memory business | (4.3) | (5.0) | (4.1)
Non-GAAP net revenue | $74.7 | $72.9 | $67.9
GAAP gross margin | $43.8 | $43.6 | $42.1
Acquisition-related adjustments | 1.3 | 1.2 | 1.1
Share-based compensation | 0.3 | 0.3 | 0.3
NAND memory business | (2.0) | (1.5) | 0.0
Non-GAAP gross margin | $43.4 | $43.6 | $43.5
GAAP gross margin percentage | 55.4% | 56.0% | 58.6%
Acquisition-related adjustments | 1.6% | 1.6% | 1.6%
Share-based compensation | 0.4% | 0.4% | 0.3%
NAND memory business | 0.6% | 1.8% | 3.5%
Non-GAAP gross margin percentage | 58.1% | 59.8% | 64.1%
GAAP operating income | $19.5 | $23.7 | $22.0
Acquisition-related adjustments | 1.5 | 1.4 | 1.3
Restructuring and other charges | 2.6 | 0.2 | 0.4
Share-based compensation | 2.0 | 1.9 | 1.7
NAND memory business | (1.4) | (0.9) | 0.6
Non-GAAP operating income | $24.2 | $26.2 | $26.1
GAAP operating margin | 24.6% | 30.4% | 30.6%
Acquisition-related adjustments | 1.9% | 1.8% | 1.8%
Restructuring and other charges | 3.3% | 0.3% | 0.5%
Share-based compensation | 2.7% | 2.4% | 2.4%
NAND memory business | (0.1)% | 0.9% | 2.9%
Non-GAAP operating margin | 32.4% | 36.0% | 38.4%
GAAP earnings per share—diluted | $4.86 | $4.94 | $4.71
Acquisition-related adjustments | 0.36 | 0.33 | 0.29
Restructuring and other charges | 0.65 | 0.05 | 0.09
Share-based compensation | 0.49 | 0.44 | 0.39
(Gain)/loss on divestiture | -- | -- | (0.16)
(Gain) loss on equity investments, net 2 | (0.67) | (0.45) | (0.35)
NAND memory business | (0.33) | (0.22) | 0.13
Income tax effects | (0.06) | (0.03) | (0.07)
Non-GAAP earnings per share—diluted | $5.30 | $5.06 | $5.03
1 Changes effective beginning Q1 2022
2 The adjustment for gains and losses on equity investments includes the ongoing mark-to-market adjustments previously excluded from our non-GAAP results.
intel
15
Visuals: Table with four columns: row label (left-aligned, indented sub-rows), FY 2021, FY 2020 and FY 2019 (right-aligned numbers). Header row reads (In Billions, Except Per Share Amounts) with column headings FY 2021, FY 2020, FY 2019, each underlined with a thin white rule. The table has 35 rows in blocks: GAAP net revenue, NAND memory business, Non-GAAP net revenue; GAAP gross margin block; GAAP gross margin percentage block; GAAP operating income block; GAAP operating margin block; GAAP earnings per share diluted block. Each block subtotal (Non-GAAP lines) is separated by a thin white underline above the value. Cell values are exactly as given in the text, row by row, in the same order. Rows Share-based compensation and (Gain) loss on equity investments, net are set in yellow #FEC91B; all other rows are white. Footnote marker 2 sits beside the (Gain) loss on equity investments label in yellow. No charts, photographs or icons other than the Intel wordmark logo in the bottom-right corner, rendered white in the Intel blue-white one-piece wordmark with a small registered mark. The table panel is a translucent lighter blue rectangle with no border or shadow, sitting over the background gradient.
Slide 16
Non-GAAP Changes: SBC and ICAP Portfolio Gains/Losses / Q1 2021 Actuals / Q2 2021 Actuals / Q3 2021 Actuals / Q4 2021 Actuals / (In Billions, Except Per Share Amounts) / GAAP net revenue $19.7 $19.6 $19.2 $20.5 / NAND memory business (1.1) (1.1) (1.1) (1.0) / Non-GAAP net revenue $18.6 $18.5 $18.1 $19.5 / GAAP gross margin $10.9 $11.2 $10.7 $11.0 / Acquisition-related adjustments 0.3 0.3 0.3 0.3 / Share-based compensation 0.1 0.1 0.1 0.1 / NAND memory business (0.3) (0.5) (0.6) (0.5) / Non-GAAP gross margin $10.9 $11.1 $10.5 $10.9 / GAAP gross margin percentage 55.2% 57.1% 56.0% 53.6% / Acquisition-related adjustments 1.6% 1.6% 1.7% 1.6% / Share-based compensation 0.4% 0.5% 0.5% 0.4% / NAND memory business 1.7% 0.5% 0.1% 0.2% / Non-GAAP gross margin percentage 58.8% 59.8% 58.3% 55.8% / GAAP operating income $3.7 $5.5 $5.2 $5.0 / Acquisition-related adjustments 0.4 0.4 0.4 0.4 / Restructuring and other charges 2.2 0.3 0.0 0.0 / Share-based compensation 0.4 0.6 0.5 0.4 / NAND memory business (0.2) (0.4) (0.4) (0.4) / Non-GAAP operating income $6.5 $6.5 $5.7 $5.5 / GAAP operating margin 18.8% 28.3% 27.2% 24.3% / Acquisition-related adjustments 1.9% 1.9% 2.0% 1.9% / Restructuring and other charges 11.2% 1.8% 0.2% 0.1% / Share-based compensation 2.2% 3.2% 2.8% 2.2% / NAND memory business 1.0% (0.3)% (0.6)% (0.5)% / Non-GAAP operating margin 35.1% 34.9% 31.8% 28.2% / GAAP earnings per share—diluted $0.82 $1.24 $1.67 $1.13 / Acquisition-related adjustments 0.09 0.09 0.09 0.09 / Restructuring and other charges 0.54 0.08 0.01 0.01 / Share-based compensation 0.10 0.15 0.13 0.11 / (Gain) loss on equity investments, net (0.09) (0.07) (0.42) (0.09) / NAND memory business (0.04) (0.09) (0.10) (0.08) / Income tax effects (0.08) (0.04) 0.07 (0.02) / Non-GAAP earnings per share—diluted $1.34 $1.36 $1.45 $1.15 / 16
Visuals: Table with four numeric columns headed Q1 2021 Actuals, Q2 2021 Actuals, Q3 2021 Actuals and Q4 2021 Actuals, with the caption (In Billions, Except Per Share Amounts) above the row labels. Rows, top to bottom: GAAP net revenue $19.7 $19.6 $19.2 $20.5; NAND memory business (1.1) (1.1) (1.1) (1.0); Non-GAAP net revenue $18.6 $18.5 $18.1 $19.5; GAAP gross margin $10.9 $11.2 $10.7 $11.0; Acquisition-related adjustments 0.3 0.3 0.3 0.3; Share-based compensation 0.1 0.1 0.1 0.1; NAND memory business (0.3) (0.5) (0.6) (0.5); Non-GAAP gross margin $10.9 $11.1 $10.5 $10.9; GAAP gross margin percentage 55.2% 57.1% 56.0% 53.6%; Acquisition-related adjustments 1.6% 1.6% 1.7% 1.6%; Share-based compensation 0.4% 0.5% 0.5% 0.4%; NAND memory business 1.7% 0.5% 0.1% 0.2%; Non-GAAP gross margin percentage 58.8% 59.8% 58.3% 55.8%; GAAP operating income $3.7 $5.5 $5.2 $5.0; Acquisition-related adjustments 0.4 0.4 0.4 0.4; Restructuring and other charges 2.2 0.3 0.0 0.0; Share-based compensation 0.4 0.6 0.5 0.4; NAND memory business (0.2) (0.4) (0.4) (0.4); Non-GAAP operating income $6.5 $6.5 $5.7 $5.5; GAAP operating margin 18.8% 28.3% 27.2% 24.3%; Acquisition-related adjustments 1.9% 1.9% 2.0% 1.9%; Restructuring and other charges 11.2% 1.8% 0.2% 0.1%; Share-based compensation 2.2% 3.2% 2.8% 2.2%; NAND memory business 1.0% (0.3)% (0.6)% (0.5)%; Non-GAAP operating margin 35.1% 34.9% 31.8% 28.2%; GAAP earnings per share—diluted $0.82 $1.24 $1.67 $1.13; Acquisition-related adjustments 0.09 0.09 0.09 0.09; Restructuring and other charges 0.54 0.08 0.01 0.01; Share-based compensation 0.10 0.15 0.13 0.11; (Gain) loss on equity investments, net (0.09) (0.07) (0.42) (0.09); NAND memory business (0.04) (0.09) (0.10) (0.08); Income tax effects (0.08) (0.04) 0.07 (0.02); Non-GAAP earnings per share—diluted $1.34 $1.36 $1.45 $1.15. Indented sub-rows sit under their parent rows. Subtotal rows (Non-GAAP net revenue, Non-GAAP gross margin, Non-GAAP gross margin percentage, Non-GAAP operating income, Non-GAAP operating margin, Non-GAAP earnings per share—diluted) are bold-looking, set in white with a thin white underline across the four value columns. Share-based compensation rows and the (Gain) loss on equity investments row are set in gold #FEC91B. Under the column headers there is a thin white rule. The table has no cell fills. Intel logo: the Intel wordmark in white with a small light-blue tittle on the i, bottom right, about 5% of slide width. Background imagery: a blue gradient field with faint translucent square tiles along the left and right edges. The panel is a semi-transparent blue gradient plate with a soft shadow. A faint reflection of the panel sits beneath it.
Slide 17
intel®
Visuals: Intel wordmark logo in white, lowercase sans-serif letters 'intel' with a small registered trademark symbol ® at the lower right of the final 'l'. Logo spans roughly x 32.0% to 68.1% and y 37.3% to 62.7% of the slide. Background decoration: translucent lighter-blue rectangles and squares at upper left (a wide rectangle near top edge, small square below it), upper right (a tall rectangle and a small square at right edge), mid right (a square and a small square), lower right (a square and small square), lower left (a tall rectangle along left edge, a small square above it), plus two small bright cyan squares, one at top right corner and one at bottom left. Composition is centred and symmetrical in the logo, with tiles pushed to the margins. Lighting is even with a soft radial glow brightest at the bottom centre. Dominant colours are royal blue #0071C5 with darker navy #003C78 at the top and bright sky blue #0A8EE0 at the bottom, white logo #FFFFFF, cyan accent squares #00C7FD. Full-bleed, not cropped, no overlay beyond the tiles.
Download this deck
The hosted PDF of every library deck is free for readers of the SlideDeck Co newsletter. Join with your email and the viewer and download appear here.
Preparing a results presentation or business update of your own? The SlideDeck Co Standard Deck is a slide library for business reviews, updates and plans.







