

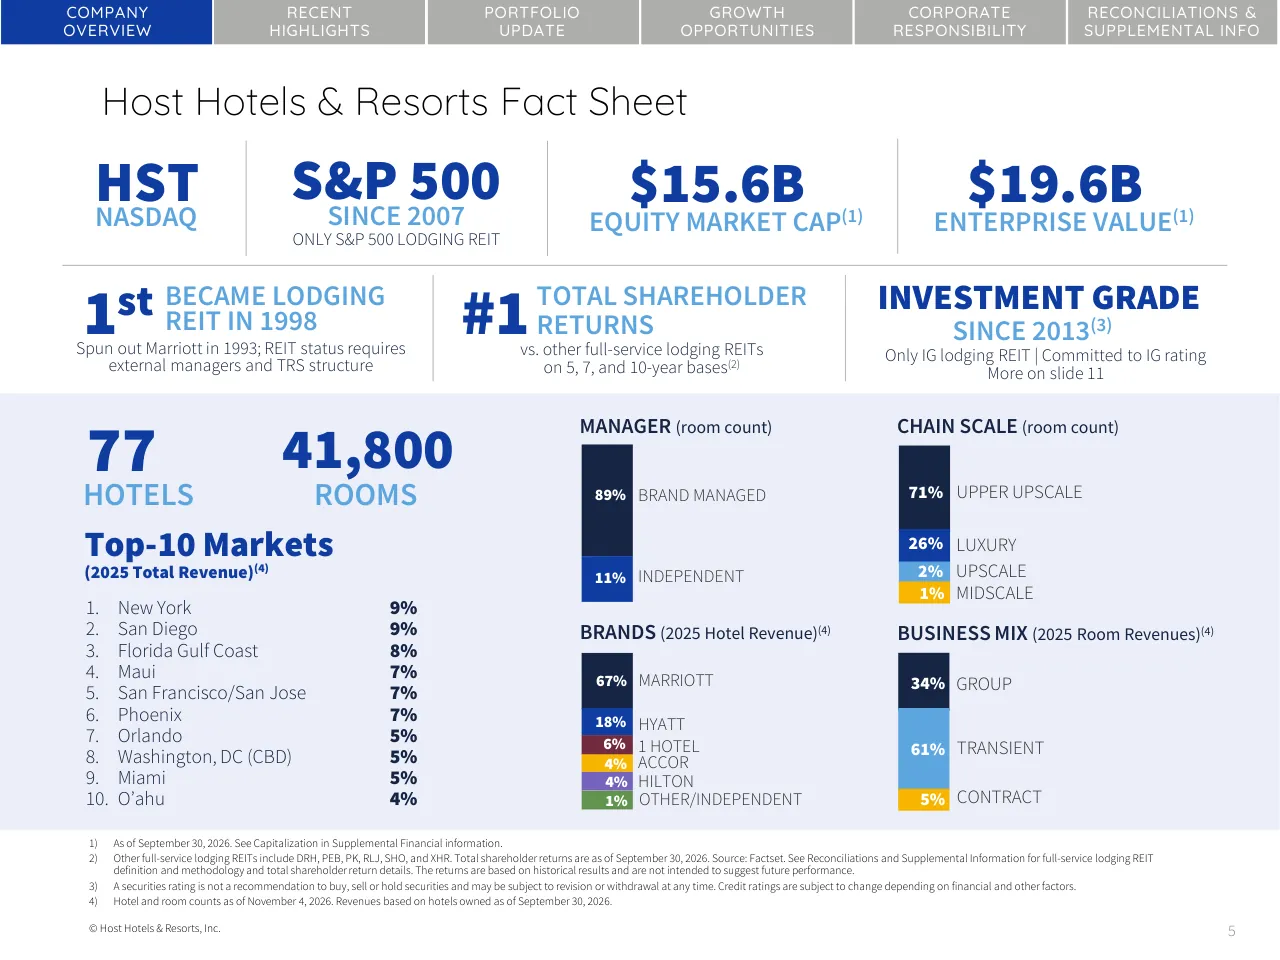
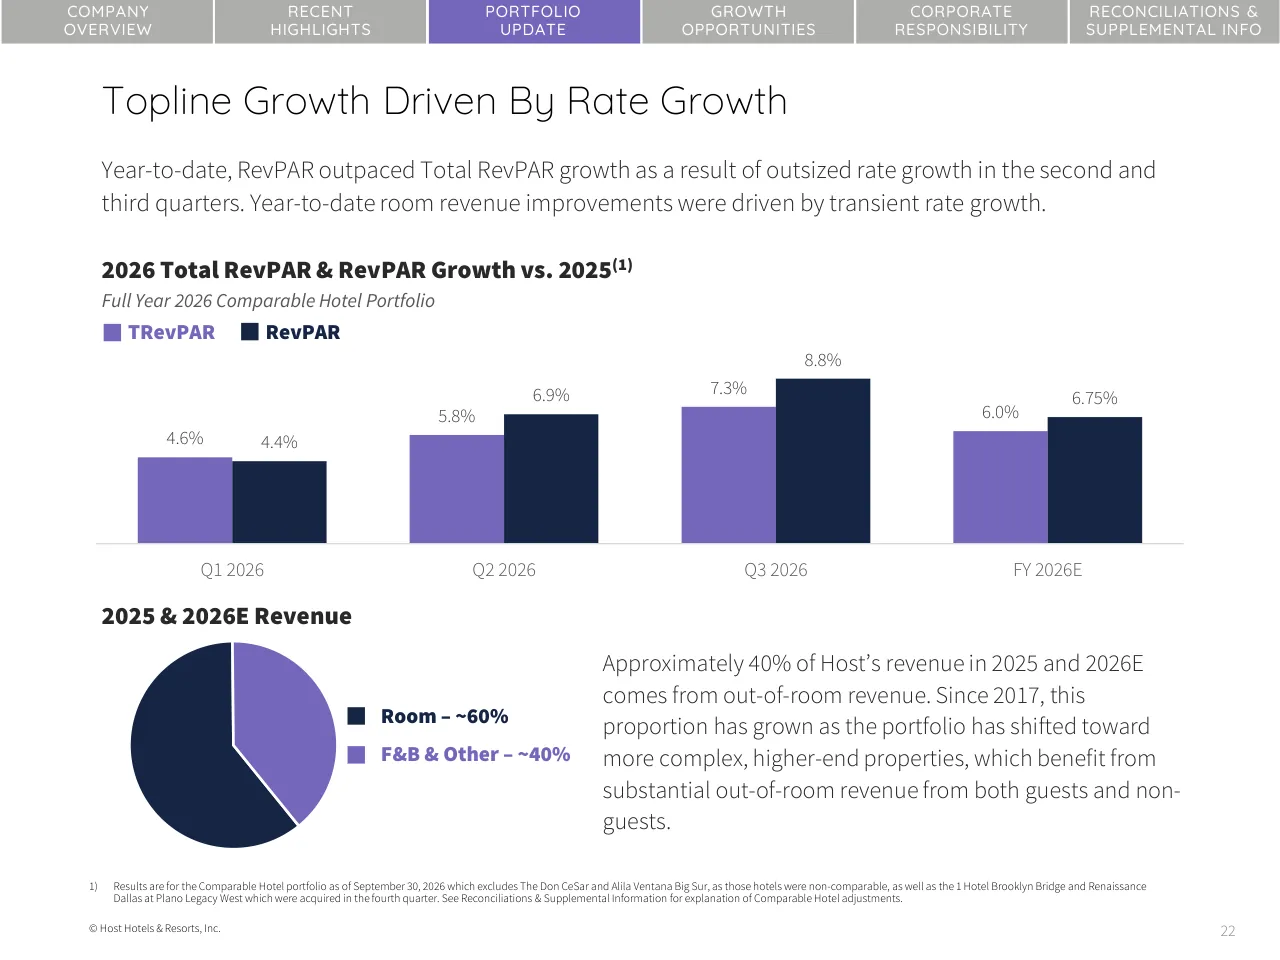
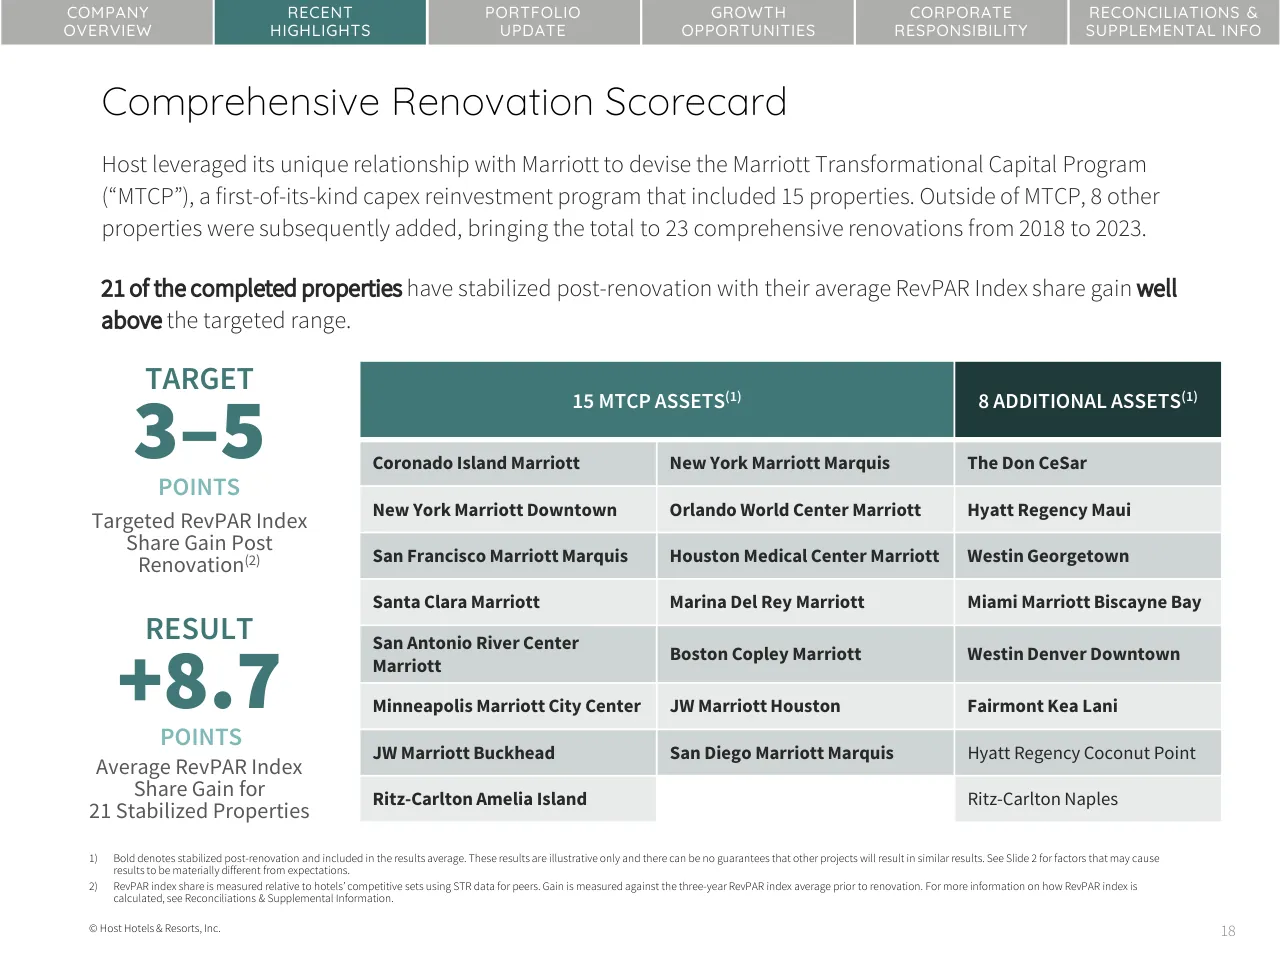
The deck opens with a title slide reading Investor Presentation, dated November 2026, followed by forward-looking statement and non-GAAP disclaimers and a table of contents. Its main sections run in order: Company Overview, Recent Highlights, Portfolio Update, Growth Opportunities, Corporate Responsibility, and Reconciliations and Supplemental Information. The company overview uses a fact sheet with pie charts for brand, chain scale, manager and business mix, a top-10 markets list, and a comparison against other full-service lodging REITs. Recent highlights cover Q3 2026 results, a full-year 2026 outlook table, and acquisition slides for two hotels, each with a rationale list and a property overview. The portfolio update covers rate-driven revenue growth, group and transient demand, and a capital allocation summary. Growth opportunities detail renovation programs with Marriott and Hyatt and a capex summary table. Corporate responsibility closes the main body with climate, sustainability and governance pages. Slides 5, 9 and 22 are good models for dense data layout, and slides 18 and 28 for tabular comparisons.
Slides worth studying
Questions about this deck
How many slides does the Host Hotels & Resorts investor presentation have?
The deck has 69 pages. Slide 3 is the table of contents, which lists its main sections: Company Overview, Recent Highlights, Portfolio Update, Growth Opportunities, Corporate Responsibility, and Reconciliations & Supplemental Information.
What does the Host Hotels & Resorts deck say about its full year 2026 outlook?
Slide 9 gives a Full Year 2026 estimate of $392 for Comparable Hotel Total RevPAR, up 6.0% versus 2025, and $1,865 million for Adjusted EBITDAre, up 6.1%. The same slide estimates NAREIT FFO per diluted share at $2.17, up 6.9%.
What does the Host Hotels & Resorts deck say about its liquidity and credit rating?
Slide 8 reports $2.6 billion in total available liquidity and 2.3x net leverage as adjusted as of September 30, 2026. Slide 11 says the company is investment grade rated and is the only investment grade rated lodging REIT.
What does the Host Hotels & Resorts deck say about the 1 Hotel Brooklyn Bridge acquisition?
Slide 13 lists a $202 million purchase price, which reflects an acquisition multiple of 10.2x based on 2026E EBITDA. Slide 14 describes the property as having 195 keys including 29 suites.
Details
- Company: Host Hotels & Resorts
- Year: 2026
- Type: Investor presentation
- Industry: Lodging REIT
- Pages: 69
Review score: 7 out of 10, Effective
Presentation quality, judged with the SlideDeck Co review heuristic. Ask, evidence and idea merit are not rated here.
The deck is competent and usable for a read-at-desk investor audience. A six-part section navigation bar with colour-coded tabs, divider photos and a table of contents give a clear route, and context arrives before it is needed: the fact sheet on slide 5, then results (8), outlook (9) and acquisitions (13-16). Weaknesses are consequential: most content slides use titles that name a topic rather than a conclusion (6, 7, 10, 26, 28), tiny footnotes and dense text on slides 26-27, 37 and 40-41 are hard to read, and the last 25 pages are reconciliation tables and legal text that cannot be read as a presentation. Slide 22 shows the chart problems: bars without a clear message, a pie chart with no labels on the slices, and a lot of empty space.
Worth keeping: Keep the colour-coded section tab bar, the full-bleed photo dividers, the big-number stat blocks on slides 8, 14 and 17, and the scannable fact sheet on slide 5.
Most useful repair: Replace the topic titles with conclusion titles, enlarge or cut the text and chart labels on slides 26-27, 37 and 40-41, and label the pie slices directly on slide 22.
What would change the score: I would move the appendix reconciliations to a separate document, keeping only a short set of key tables, and split the dense timeline and ESG pages into fewer, larger-type slides.
Confidence high. 69 of 69 pages inspected on contact sheets, 4 at readable size. Reviewed 2026-11-08. Model-assisted review (claude-sonnet-5-5).
Full text of the slides (69 slides)
Every slide's words and a description of its charts and images, so the deck can be searched and rebuilt. Also available as Markdown.
Slide 1
Investor Presentation
NOVEMBER 2026
HOST HOTELS & RESORTS®
1 HOTEL BROOKLYN BRIDGE
Visuals: One photograph and one logo. Photograph: a rooftop terrace at sunset with wooden lounge sofas and armchairs with grey and blue-grey cushions, wooden tables, small potted plants, and slim bronze-finished lamps on tables, paved in red-brown brick, edged by a glass balustrade. Behind it is the East River and the Lower Manhattan skyline (One World Trade Center on the left), the Brooklyn Bridge with its stone towers at centre, and the low sun flaring just above the bridge deck at right. Composition: wide landscape, terrace in the foreground, skyline on the horizon, full-bleed to the slide edges and cropped at the top by the white band. Lighting: warm low golden sun with lens flare against a pale blue sky with streaky clouds. Dominant colours: golden amber, slate blue, warm brick red, teak brown. No overlay on the photo itself. Logo: a stylised emblem of two interlocking angular blocks, one gold (#9C8A4E) and one navy (#172645), above the wordmark HOST in navy serif capitals, with HOTELS & RESORTS in smaller navy serif capitals beneath and a registered mark.
Slide 2
Forward-Looking Statements
This investor presentation, and the related discussion, contains forward-looking statements. These include statements about Host Hotels & Resorts’ plans, strategies, / financial performance, prospects or future events. Forward-looking statements are not guarantees of future performance. They involve known and unknown risks, / uncertainties and assumptions and many of the factors that will determine these items are beyond our ability to control or predict. Consequently, our future results, / financial condition and business may differ materially from those expressed in these forward-looking statements. You can find many of these statements by looking or / listening for words such as “approximates,” “believes,” “expects,” “anticipates,” “intends,” “plans,” “would,” “may” or similar expressions in these slides or in the related / discussion. Factors that may cause actual results to differ materially from those contemplated by the forward-looking statements include, but are not limited to, (i) the / effect on lodging demand of changes in national and local economic and business conditions, concerns about U.S. economic growth, an economic recession in the / United States or globally, the recent high level of inflation, elevated interest rates, global economic prospects, consumer confidence, the impact of U.S. government / shutdowns, and the value of the U.S. dollar; (ii) other changes in national and local economic and business conditions and other factors including natural disasters, such / as the Maui wildfires in 2023, weather events, such as Hurricane Ian in 2022 and Hurricanes Helene and Milton in 2024 or extreme precipitation such as the March 2026 / Hawaii Kona Low rainstorm, pandemics and other public health crises, such as the COVID-19 pandemic, and the occurrence or potential occurrence of terrorist attacks, / that will affect occupancy rates at our hotels and the demand for hotel products and services (iii) operating risks associated with the hotel business, including the effect of / increasing labor cost; (iv) risks associated with our ability to complete acquisitions and dispositions and develop new properties and the risks that acquisitions and new / developments may not perform in accordance with our expectations; (v) our ability to maintain our properties in a first-class manner, including meeting capital / expenditures requirements, and the effect of renovations, including temporary closures, on our hotel occupancy and financial results; (vii) our ability to compete / effectively in areas such as access, location, quality of accommodations and room rate structures; (viii) risks associated with entering into joint ventures, including the / potential for disputes with our partners and the risk that the joint ventures may not perform in accordance with expectations; and (ix) those factors set forth in our Annual / Report on Form 10-K under the heading “Risk Factors,” which is available on our website: www.hosthotels.com. Although the Company believes the expectations reflected / in such forward-looking statements are based upon reasonable assumptions, it can give no assurance that the expectations will be attained or that any deviation will not / be material. All information in this presentation is as of the respective dates provided and the Company undertakes no obligation to update any forward-looking / statement to conform the statement to actual results or to changes in the Company’s expectations.
This presentation is not an offer to sell or a solicitation of an offer to buy any securities of the Company.
Use of Non-GAAP Financial Measures:
This investor presentation, and the related discussion, also contain certain non-GAAP financial measures, which should be considered only as supplemental to, and not as / superior to, financial measures prepared in accordance with generally accepted accounting principles (“GAAP”). Please refer to the Reconciliations & Supplemental / Information section of this presentation for a reconciliation of these non-GAAP financial measures to the most directly comparable financial measures prepared in / accordance with GAAP and definitions and calculation methodologies used for other defined terms used in this presentation.
Trademarks:
The brands and logos used in this presentation are the trademarks of our managers or their affiliates. The trademarked names and their logos are the property of their / respective owners and are being used with the express permission of their owners. None of the owners of these trademarks has any responsibility or liability for any / information contained in this presentation.
2
© Host Hotels & Resorts, Inc.
Slide 3
COMPANY OVERVIEW / RECENT HIGHLIGHTS / PORTFOLIO UPDATE / GROWTH OPPORTUNITIES / CORPORATE RESPONSIBILITY / RECONCILIATIONS & SUPPLEMENTAL INFO
TABLE OF CONTENTS
4 COMPANY OVERVIEW
12 RECENT HIGHLIGHTS
21 PORTFOLIO UPDATE
25 GROWTH OPPORTUNITIES
34 CORPORATE RESPONSIBILITY
43 RECONCILIATIONS & SUPPLEMENTAL INFORMATION
MANCHESTER GRAND HYATT SAN DIEGO
Visuals: Photograph: an interior lounge corner of a high-rise hotel at sunset. Foreground has two round dark-marble side tables and a larger pale round table, each with a small warm-lit table lamp with a gold base and pleated shade. Surrounding are upholstered armchairs in rust-orange ribbed fabric with wooden arms and legs and grey seat cushions. Behind them floor-to-ceiling windows show a bay with a grey aircraft carrier at right, a city waterfront with low buildings and a curved white-stone building at lower right, and a pale orange-gold sunset sky with haze. Full-bleed from 5% to 100% of slide height, covering the slide width; the image is not boxed. Lighting is warm low-angle sunset light. Dominant colours are amber, rust brown, dark charcoal and pale peach. A translucent white panel overlays the centre of the photo, and the navy footer band overlays the bottom. Logo: the HOST HOTELS & RESORTS logo at about x 46.9% to 53.1%, y 83.9% to 89.9%, consisting of a stylised gold and navy block mark above the navy serif-style word HOST and a small navy line HOTELS & RESORTS beneath, with a registered mark.
Slide 4
COMPANY / OVERVIEW
RECENT / HIGHLIGHTS
PORTFOLIO / UPDATE
GROWTH / OPPORTUNITIES
CORPORATE / RESPONSIBILITY
RECONCILIATIONS & / SUPPLEMENTAL INFO
Company / Overview
THE RITZ-CARLTON NAPLES, TIBURÓN
Visuals: Photograph of a hotel lobby, the Ritz-Carlton Naples, Tiburón. Subject: a large round cream-upholstered sofa with cushions in the foreground on a pale stone floor, potted palms and tropical plants around it, a pair of large ring-shaped pendant chandeliers with warm amber-lit alabaster rings, columns, a dark wood and patterned screen, a marble side table at lower left, and a glimpse of a reception desk at left. Composition: wide interior view from a low angle, framed to the left 61.5% of the slide, not cropped into a shape, shown as a rectangle that runs from the top navigation strip to the bottom band. Lighting: warm, soft ambient interior light with amber highlights. Dominant colours: beige, cream, sand, warm brown, and green foliage. No overlay on the photograph itself. Logo: Host Hotels & Resorts logo at upper centre of the right panel, consisting of a stylised gold and navy geometric mark above the word HOST in navy serif capitals and the words HOTELS & RESORTS beneath in smaller navy serif capitals with a registered mark.
Slide 5
COMPANY
OVERVIEW
RECENT
HIGHLIGHTS
PORTFOLIO
UPDATE
GROWTH
OPPORTUNITIES
CORPORATE
RESPONSIBILITY
RECONCILIATIONS &
SUPPLEMENTAL INFO
Host Hotels & Resorts Fact Sheet
HST
NASDAQ
S&P 500
SINCE 2007
ONLY S&P 500 LODGING REIT
$15.6B
EQUITY MARKET CAP(1)
$19.6B
ENTERPRISE VALUE(1)
1st BECAME LODGING
REIT IN 1998
Spun out Marriott in 1993; REIT status requires
external managers and TRS structure
#1 TOTAL SHAREHOLDER
RETURNS
vs. other full-service lodging REITs
on 5, 7, and 10-year bases(2)
INVESTMENT GRADE
SINCE 2013(3)
Only IG lodging REIT | Committed to IG rating
More on slide 11
77
HOTELS
41,800
ROOMS
Top-10 Markets
(2025 Total Revenue)(4)
1. New York 9%
2. San Diego 9%
3. Florida Gulf Coast 8%
4. Maui 7%
5. San Francisco/San Jose 7%
6. Phoenix 7%
7. Orlando 5%
8. Washington, DC (CBD) 5%
9. Miami 5%
10. O’ahu 4%
MANAGER (room count)
89% BRAND MANAGED
11% INDEPENDENT
CHAIN SCALE (room count)
71% UPPER UPSCALE
26% LUXURY
2% UPSCALE
1% MIDSCALE
BRANDS (2025 Hotel Revenue)(4)
67% MARRIOTT
18% HYATT
6% 1 HOTEL
4% ACCOR
4% HILTON
1% OTHER/INDEPENDENT
BUSINESS MIX (2025 Room Revenues)(4)
34% GROUP
61% TRANSIENT
5% CONTRACT
1) As of September 30, 2026. See Capitalization in Supplemental Financial information.
2) Other full-service lodging REITs include DRH, PEB, PK, RLJ, SHO, and XHR. Total shareholder returns are as of September 30, 2026. Source: Factset. See Reconciliations and Supplemental Information for full-service lodging REIT / definition and methodology and total shareholder return details. The returns are based on historical results and are not intended to suggest future performance.
3) A securities rating is not a recommendation to buy, sell or hold securities and may be subject to revision or withdrawal at any time. Credit ratings are subject to change depending on financial and other factors.
4) Hotel and room counts as of November 4, 2026. Revenues based on hotels owned as of September 30, 2026.
© Host Hotels & Resorts, Inc.
5
Visuals: Four bar-style 100% composition charts plus one ranked list, all printed with values; no photographs or logos. (a) MANAGER (room count): one vertical stacked bar with segments BRAND MANAGED 89% (top, dark navy) and INDEPENDENT 11% (bottom, royal blue); labels sit to the right of each segment. (b) CHAIN SCALE (room count): one vertical stacked bar with segments UPPER UPSCALE 71% (top, navy), LUXURY 26% (royal blue), UPSCALE 2% (light blue), MIDSCALE 1% (yellow), labels to the right. (c) BRANDS (2025 Hotel Revenue): one vertical stacked bar with segments MARRIOTT 67% (navy), HYATT 18% (royal blue), 1 HOTEL 6% (maroon), ACCOR 4% (yellow), HILTON 4% (purple), OTHER/INDEPENDENT 1% (green), labels to the right. (d) BUSINESS MIX (2025 Room Revenues): one vertical stacked bar with segments GROUP 34% (navy), TRANSIENT 61% (light blue), CONTRACT 5% (yellow). Bar width is about 4% of slide width each; no axes, gridlines or legend; segment heights proportional to the printed percentages. Top-10 Markets (2025 Total Revenue): a numbered list of ten markets with percentages right-aligned in a second column: 1 New York 9%, 2 San Diego 9%, 3 Florida Gulf Coast 8%, 4 Maui 7%, 5 San Francisco/San Jose 7%, 6 Phoenix 7%, 7 Orlando 5%, 8 Washington, DC (CBD) 5%, 9 Miami 5%, 10 O’ahu 4%. KPI figures are plain typography: HST NASDAQ; S&P 500 SINCE 2007; $15.6B equity market cap; $19.6B enterprise value; 1st became lodging REIT in 1998; #1 total shareholder returns; INVESTMENT GRADE SINCE 2013; 77 hotels; 41,800 rooms. Thin grey vertical dividers separate the KPI columns and benefit columns, and a thin grey horizontal rule runs across the full width beneath the KPIs.
Slide 6
Leading Bottom-Line Growth / Entering the pandemic with a fortress balance sheet allowed Host to opportunistically re-invest in our portfolio and accretively recycle assets. As a result, full year 2025 Adjusted EBITDAre and Nareit FFO/share grew meaningfully above 2019 levels while other full-service lodging REITs lagged. / 2025 VS 2019 ADJUSTED EBITDARE GROWTH(1) / 13% / -17% / Host / Other Full-Service Lodging REIT Avg. / 2025 VS 2019 NAREIT FFO PER SHARE GROWTH(1) / 19% / -33% / Host / Other Full-Service Lodging REIT Avg. / 2025 VS 2019 TOTAL DIVIDENDS PER SHARE GROWTH(2) / 12% / -55% / Host / Other Full-Service Lodging REIT Avg. / TOTAL SHAREHOLDER RETURN 12/31/18 – 12/31/2025(2,3) / 37% / -23% / Host / Other Full-Service Lodging REIT Avg. / 1) Adjusted EBITDAre and FFO/share are non-GAAP financial measures. Host’s 2025 net income growth and diluted earnings per share growth compared to 2019 are (17)% and (13)% , respectively. See Reconciliations & Supplemental Information for reconciliation of comparable GAAP measures. Other Full-Service Lodging REITs (listed on slide 5) calculate Adjusted EBITDAre differently and this presentation does not account for those differences. / 2) Source: Factset. / 3) See footnote 2 on slide 5. The returns are based on historical results and are not intended to suggest future performance. / © Host Hotels & Resorts, Inc. / 6 / COMPANY OVERVIEW / RECENT HIGHLIGHTS / PORTFOLIO UPDATE / GROWTH OPPORTUNITIES / CORPORATE RESPONSIBILITY / RECONCILIATIONS & SUPPLEMENTAL INFO
Visuals: Four diverging bar charts, each showing a baseline with one blue bar above it for Host and one dark navy bar below it for the Other Full-Service Lodging REIT average. Top-left: title 2025 VS 2019 ADJUSTED EBITDARE GROWTH(1); Host bar labelled 13% (about 13 percent above baseline, about 4.8% of slide height tall); Other REIT bar labelled -17% (about 17 percent below baseline, about 5.9% of slide height tall); baseline is light grey, x 8.2 to 42.6, y 39.9. Top-right: title 2025 VS 2019 NAREIT FFO PER SHARE GROWTH(1); Host bar 19% (about 19 percent above baseline, about 4.0% tall); Other REIT bar -33% (about 33 percent below baseline, about 6.3% tall); baseline x 55.0 to 89.4, y 39.5. Bottom-left: title 2025 VS 2019 TOTAL DIVIDENDS PER SHARE GROWTH(2); Host bar 12% (about 12 percent above baseline, about 1.9% tall); Other REIT bar -55% (about 55 percent below baseline, about 9.0% tall); baseline x 10.0 to 44.4, y 70.0. Bottom-right: title TOTAL SHAREHOLDER RETURN 12/31/18 – 12/31/2025(2,3); Host bar 37% (about 37 percent above baseline, about 4.9% tall); Other REIT bar -23% (about 23 percent below baseline, about 3.0% tall); baseline x 55.0 to 89.4, y 74.7. Category labels under each pair: Host and Other Full-Service Lodging REIT Avg. No legend. No highlighted points beyond the blue Host bars. Bars are flat rectangles with no gradient, outline or shadow.
Slide 7
COMPANY / OVERVIEW / RECENT / HIGHLIGHTS / PORTFOLIO / UPDATE / GROWTH / OPPORTUNITIES / CORPORATE / RESPONSIBILITY / RECONCILIATIONS & / SUPPLEMENTAL INFO / Shareholder Value Creation / Host leads the full-service lodging REITs in cumulative free cash flow from 2019 through 2025 despite proactively accelerating capex investment during the pandemic. / In addition to portfolio reinvestment, we elevated the quality of the portfolio through accretive portfolio recycling which has led to a meaningful increase in Adjusted EBITDAre per key while reducing key count. / FREE CASH FLOW AS % OF TOTAL REVENUE(1) / (Cumulative from 2019-2025) / 10.2% / HST / Other Full-Service Lodging REIT Avg. / 4.9% / ADJUSTED EBITDARE PER KEY(2) / +26% / Increase in Adjusted EBITDAre per key from 2019 to 2025, representing a meaningful increase in portfolio quality as key count decreased (9)% through accretive portfolio recycling. / 1) / Free Cash Flow as a percentage of total revenue is a non-GAAP financial measure. The comparable metric using GAAP amounts is net cash provided by (used in) operating activities as a percentage of total revenues. Our net cash provided by operating activities as a percentage of total revenues from 2019 – 2025 was 22.2%. The other full-service lodging REIT average is based on their annual filings. See Reconciliations & Supplemental Information for how we calculate free cash flow and reconciliations to the comparable GAAP measure. See footnote 2 on slide 5 for a listing of full-service lodging REITs used in the comparison. / 2) / Adjusted EBITDAre per key is a non-GAAP financial measure. Host's 2025 net income per key change compared to 2019 is a decline of (9)%. See Reconciliations & Supplemental Information for reconciliation of comparable GAAP measures. / © 2026 Host Hotels & Resorts, Inc. / . / 7
Visuals: Bar chart, left half. Title 'FREE CASH FLOW AS % OF TOTAL REVENUE(1)' with italic subtitle '(Cumulative from 2019-2025)'. Two vertical bars on a common baseline with no y-axis, no gridlines and no printed axis range; bar heights are proportional to the labelled values (about 10.2 and 4.9 units). Bar 1 'HST' value 10.2% in blue #0F3DA2, roughly 22.6% of slide height tall, bar 2 'Other Full-Service Lodging REIT Avg.' value 4.9% in dark navy #172645, roughly 10.8% of slide height tall. Thin light grey #D9D9D9 baseline runs under both bars. No legend and no highlighted points beyond the blue HST bar. Right half: large stat '+26%' in heavy blue #0F3DA2 numerals, about 11% of slide height, with no chart or photo. No photographs, logos or icons on the slide.
Slide 8
COMPANY / OVERVIEW
RECENT / HIGHLIGHTS
PORTFOLIO / UPDATE
GROWTH / OPPORTUNITIES
CORPORATE / RESPONSIBILITY
RECONCILIATIONS & / SUPPLEMENTAL INFO
Key Highlights – Q3 2026
+7.3%
TRevPAR
Comparable Hotel Total RevPAR compared to Q3 2025, driven by higher rates and elevated levels of food & beverage spending
$347
MILLION
Adjusted EBITDAre, +8.8% above Q3 2025(1)
25.2%
MARGIN
Comparable Hotel EBITDA margin +90 bps above Q3 2025(2)
2.3x
NET LEVERAGE
As adjusted, provides flexibility and optionality in a volatile environment(3)
$0.20
DIVIDEND
Q3 regular dividend of $0.20 per share
$2.6
BILLION
Total available liquidity, including approximately $157 million of FF&E reserves and $1.5 billion available under the credit facility revolver(4)
1) Adjusted EBITDAre is a non-GAAP financial measure. In Q3 2026, net income was $71 million, (56)% below Q3 2025. See Reconciliations & Supplemental Information for reconciliation of comparable GAAP measures.
2) Comparable Hotel EBITDA margin is a non-GAAP financial measure. In Q3 2026, operating profit margin was 9.0%, 140 bps above Q3 2025. See Reconciliations & Supplemental Information for reconciliation of comparable GAAP measures and definition of Comparable Hotel results.
3) As of September 30, 2026, as adjusted by $501 million for hotel acquisitions and dividends paid in October. Net Leverage is a non-GAAP financial measure calculated based on the Company's credit facility and is defined as net debt to adjusted credit facility EBITDA. Leverage using GAAP metrics was 5.4x. See Reconciliations and Supplemental Information for a reconciliation.
4) As of September 30, 2026, as adjusted by $501 million for hotel acquisitions and dividends paid in October.
© Host Hotels & Resorts, Inc.
8
Visuals: Six-tab navigation bar: rectangles spanning the top, first tab #0F3DA2 and the remaining five #AFAFAC, each with white uppercase text. Six stat blocks, no charts or photographs: +7.3% TRevPAR; $347 MILLION Adjusted EBITDAre; 25.2% MARGIN; 2.3x NET LEVERAGE; $0.20 DIVIDEND; $2.6 BILLION liquidity. Dividers: four dotted vertical rules in #5DA6E0 (two in the top row, two in the bottom row) at about x 33.4% and 66.7%, and one long dotted horizontal rule in #5DA6E0 at about y 49.7% spanning the slide width. None of these are photographs, icons or logos.
Slide 9
COMPANY
OVERVIEW
RECENT
HIGHLIGHTS
PORTFOLIO
UPDATE
GROWTH
OPPORTUNITIES
CORPORATE
RESPONSIBILITY
RECONCILIATIONS &
SUPPLEMENTAL INFO
2026 Outlook
OPERATIONAL OUTLOOK
Subject to factors that may affect lodging demand
Full Year 2026(1) | Estimate | vs. 2025
Comparable Hotel Total RevPAR | $392 | +6.0%
Comparable Hotel RevPAR | $237 | +6.75%
Comparable Hotel EBITDA Margin | 30.0% | +80 bps
Comparable Hotel EBITDA (millions) | $1,757 | +9.1%
Adjusted EBITDAre (in millions) | $1,865 | +6.1%
NAREIT FFO per diluted share | $2.17 | +6.9%
Adjusted FFO per diluted share | $2.21 | +6.8%
COMPARABLE RevPAR vs. 2025
ANNUAL ASSUMPTIONS
Growth Assumptions
Q4: high-single digits
World Cup provided +70 bps FY RevPAR growth benefit partially offset by (20) bps 2025 inauguration impact
Corporate & Other Expenses
$128 million
Interest Expense
$243 million
Capital Expenditures
$550– $600 million
(see slide 28 for more detail)
1) Full year forecast net income is $978 million, operating profit margin is 15.4%, operating profit margin change vs. 2025 is 140 basis points, and diluted earnings per share is $1.40. See Reconciliations & Supplemental Information for reconciliations and items that may affect forecast results, projections, and other estimates. See slide 2 (Forward Looking Statements) for factors that may affect lodging demand.
© Host Hotels & Resorts, Inc.
9
Visuals: Table: Full Year 2026(1) table with three columns, Full Year 2026 label (x 24.5 to 52.7%), Estimate (52.7 to 64.4%), vs. 2025 (64.5 to 75.5%). Header row in #0F3DA2 with white bold text. Seven data rows, each about 3.8% of slide height, in alternating fills #CCCDCF and #E7E8E9, starting with #CCCDCF. Row values: Comparable Hotel Total RevPAR $392 +6.0%; Comparable Hotel RevPAR $237 +6.75%; Comparable Hotel EBITDA Margin 30.0% +80 bps; Comparable Hotel EBITDA (millions) $1,757 +9.1%; Adjusted EBITDAre (in millions) $1,865 +6.1%; NAREIT FFO per diluted share $2.17 +6.9%; Adjusted FFO per diluted share $2.21 +6.8%. Estimate column right-aligned; vs. 2025 column right-aligned. White cell gutters of about 0.3% of slide width. Icons: a blue outline office building (about x 61.3, y 64.2, w 3.0, h 5.5) beside Corporate & Other Expenses; a blue outline stopwatch with a blue circular percent badge (about x 61.3, y 72.7, w 3.6, h 4.3) beside Interest Expense; a blue outline traffic cone on a diamond-shaped base (about x 61.4, y 81.0, w 3.3, h 5.3) beside Capital Expenditures. Icons are line art in #0F3DA2 stroke about 0.2% width, unfilled. No photographs, charts or logos.
Slide 10
COMPANY
OVERVIEW
RECENT
HIGHLIGHTS
PORTFOLIO
UPDATE
GROWTH
OPPORTUNITIES
CORPORATE
RESPONSIBILITY
RECONCILIATIONS &
SUPPLEMENTAL INFO
Investment Thesis
Capital Allocation Track Record
Accretive capital recycling since current management team began transitioning the portfolio in 2017
EBITDA Multiples(1)
DISPOSITIONS
ACQUISITIONS
2018 – 2026
$6.4B @ 16.9x
$5.3B @ 13.4x
2021 –2026
$2.9B @ 16.5x
$3.7B @ 13.0x
Diverse Portfolio
Geographic EBITDA diversification: no market accounts for more than 9% of 2025 Comparable Hotel EBITDA(3)
Strong Balance Sheet
Only investment grade rating among lodging REITs(2)
$2.6 billion in total available liquidity as of September 30, 2026, including approximately $157 million of FF&E reserves and $1.5 billion available under credit facility (as adjusted by $501 million for hotel acquisitions and dividends paid in October)
Size, Scale & Reputation
Allows us to leverage multiple fronts:
Operational benchmarking and analytical capability
Ability to source off-market transactions and close with certainty
Large, branded portfolio allows us to leverage relationships with operators and implement broad changes efficiently
THE WESTIN KIERLAND RESORT & SPA
1) Disposition multiples are calculated as the ratio between the sales price (plus estimated avoided capital expenditures over the five years following the disposition dates) and EBITDA on a TTM basis from the disposition date, except
for 2020 – 2022 dispositions which use 2019 full year results as the TTM are not representative of normalized operations. For 2018 –2026 dispositions, combined estimated avoided capital expenditures over the five years following
the disposition dates totaled $1.2 billion. The disposition net income multiple is 29x. For 2021 – 2026 dispositions, combined estimated avoided capital expenditures over the five years following the disposition dates totaled $710
million and the disposition net income multiple is 28x. Acquisition multiples are based on forecast operations in the year of acquisition or, for hotels acquired in 2021, 2019 operations, with the following exceptions: Baker's Cay
Resort Key Largo (2021 acquisition), based on 2021 forecast operations at acquisition, as the property was under renovation and closed for part of 2019; The Laura Hotel (2021 acquisition), based on estimated normalized results at
acquisition that assume results are in-line with the 2019 results of comparable Houston properties, as the property was re-opened with a new manager and brand when acquired in 2021; Alila Ventana Big Sur (2021 acquisition),
based on 2021 forecast operations at acquisition as the property was under renovation for part of 2019; The Alida, Savannah (2021 acquisition), which adjusts 2019 results for construction disruption to the surrounding Plant
Riverside District and for initial ramp-up of hotel operations. Acquisition EBITDA includes an upward adjustment of $13 million to reflect normalized operations for both The Laura Hotel and The Alida, Savannah. The 2018 –2026
acquisition net income multiple is 23x. The 2021 – 2026 acquisition net income multiple is 22x. See Reconciliations and Supplemental Information for reconciliations.
2) A securities rating is not a recommendation to buy, sell or hold securities and may be subject to revision or withdrawal at any time. Credit ratings are subject to change depending on financial and other factors.
3) No market accounts for more than 11% of 2025 hotel net income. See Reconciliations & Supplemental Information for reconciliations of net income to EBITDA.
© Host Hotels & Resorts, Inc.
10
Visuals: One photograph: an aerial dusk view of The Westin Kierland Resort & Spa, a large tan and brown multi-storey hotel with a terracotta tiled roof in the centre, low-rise wings and cabanas to the left, a rectangular turquoise swimming pool with lounge chairs in the lower centre surrounded by rows of tall palm trees, a golf course with green fairways at left, and a distant skyline of mid-rise apartment and office buildings with mountains on the horizon. Warm golden-hour light, dominant colours tan, ochre, green and muted blue; the photo is full-bleed across the slide width, not boxed, and is faded to white at its top edge by a translucent white haze. One data table: navy boxed table with column headers DISPOSITIONS and ACQUISITIONS and row labels 2018 – 2026 and 2021 –2026; cells: 2018 – 2026 dispositions $6.4B @ 16.9x, acquisitions $5.3B @ 13.4x; 2021 –2026 dispositions $2.9B @ 16.5x, acquisitions $3.7B @ 13.0x. Table has a soft drop shadow. Blue ► bullet markers used for lists.
Slide 11
COMPANY
OVERVIEW
RECENT
HIGHLIGHTS
PORTFOLIO
UPDATE
GROWTH
OPPORTUNITIES
CORPORATE
RESPONSIBILITY
RECONCILIATIONS &
SUPPLEMENTAL INFO
Balance Sheet
Strong credit profile and investment grade balance sheet provides flexibility and optionality.
TOTAL AVAILABLE LIQUIDITY
$2.6B
Total available liquidity including approximately $157 million of FF&E reserves and $1.5 billion available under credit facility (1)
INVESTMENT GRADE RATED (2)
AGENCY RATING OUTLOOK
Moody’s Baa2 Stable
S&P BBB- Stable
Fitch BBB Stable
Only investment grade rated lodging REIT
UNENCUMBERED
99%
of the consolidated portfolio is unencumbered by debt
MATURITY SCHEDULE ($ in millions) (3)
Balanced maturity schedule
5.2 years of weighted debt maturity
4.8% weighted average interest rate
Senior Notes Term Loan (3) Mortgage and Other Debt (4)
$500
$1,800
$90
$500
$750
$650
$400
$450
$500
2026
2027
2028
2029
2030
2031
Thereafter
1)
As of September 30, 2026, as adjusted for $501 million of hotel acquisitions and dividends paid in October.
2)
A securities rating is not a recommendation to buy, sell or hold securities and may be subject to revision or withdrawal at any time. Credit ratings are subject to change depending on financial and other factors.
3)
As of September 30, 2026, adjusted for the amended and restated credit facility agreement completed on October 21, 2026. The first term loan under our credit facility that is due in 2031 has an extension option that would extend maturity of the instrument to 2032, subject to meeting certain conditions, including payment of a fee. The second term loan tranche that is due in 2032 does not have an extension option.
4)
Mortgage and Other Debt excludes principal amortization of $2 million in 2027 for the mortgage loan that matures in 2027.
© Host Hotels & Resorts, Inc.
11
Visuals: Chart: stacked column chart titled 'MATURITY SCHEDULE ($ in millions)' with superscript (3). Category axis (x) shows 2026, 2027, 2028, 2029, 2030, 2031, Thereafter, with a thin light grey baseline (#D9D9D9) from about x 5.7% to 93.0% at y 83.1%. No value axis is printed; bars are drawn to a common linear scale. Series: Senior Notes (blue #0F3DA2): 2026 no bar; 2027 none; 2028 $400; 2029 $650; 2030 $750; 2031 $450; Thereafter $1,800. Term Loan (purple #7567BD): 2031 $500 stacked above Senior Notes; Thereafter $500 stacked above Senior Notes. Mortgage and Other Debt (amber about #F5B400): 2027 $90 bar, with its label printed above the bar in dark grey #404040. Bar tops: 2027 at about 82.2%; 2028 about 79.3%; 2029 about 77.0%; 2030 about 76.1%; 2031 about 74.2% (purple top) and 78.9% (blue top); Thereafter 61.7% (purple top) and 66.3% (blue top). Bar widths about 7.3% each, centred on category labels. Value labels are white inside blue and purple bars and dark inside amber. Legend top right: blue square then 'Senior Notes', purple square then 'Term Loan (3)', amber square then 'Mortgage and Other Debt (4)'. Highlighted points: none. Three navy rectangular KPI cards: (a) TOTAL AVAILABLE LIQUIDITY with large $2.6B figure; (b) INVESTMENT GRADE RATED table with 3 columns AGENCY, RATING, OUTLOOK and 3 rows: Moody’s / Baa2 / Stable; S&P / BBB- / Stable; Fitch / BBB / Stable; (c) UNENCUMBERED with large 99% figure. No photographs, logos or icons.
Slide 12
COMPANY / OVERVIEW / RECENT / HIGHLIGHTS / PORTFOLIO / UPDATE / GROWTH / OPPORTUNITIES / CORPORATE / RESPONSIBILITY / RECONCILIATIONS & / SUPPLEMENTAL INFO / Recent / Highlights / 1 HOTEL BROOKLYN BRIDGE
Visuals: Photograph (left panel, x 0 to 61.4%, y 4.9 to 100%, 1142 by 1326 px source): a rooftop terrace at dusk overlooking the East River and the Brooklyn Bridge. The bridge's stone tower and suspension cables run across the centre-right; a tall dark glass tower stands left of the bridge; the Manhattan skyline with lit windows is at far left. Foreground: a glass balustrade with a brushed metal top rail on the left; beige cushioned teak sofas with grey and blue-grey throw pillows; a teak coffee table holding a small copper-finished table lamp and a potted plant; a grey-blue cushion in the lower foreground; brick paving; a green tree and planters at the right. A pier with dark piles and a floating dock sits on the water at left. Lighting: twilight sky graded from deep blue-violet at top to orange-pink at the horizon, with warm lamplight on the furniture. Dominant colours: blue #3B4A7A, violet #6B5E8E, orange #E9A46A, warm wood #A0643A, grey-beige #C9C2B5. Framing: wide landscape view cropped at the right edge of the panel, bleeds off the top, left and bottom edges of the slide, with no border. Overlay: the navy band at 80% opacity covers the bottom of the photo. Logo (white panel): Host Hotels & Resorts mark, a two-part chevron-like symbol with a gold-khaki left half #B09A5E and a navy right half #172645 above the word HOST in navy serif capitals and HOTELS & RESORTS® in smaller navy serif capitals beneath. No other icons, charts or tables.
Slide 13
COMPANY / OVERVIEW / RECENT / HIGHLIGHTS / PORTFOLIO / UPDATE / GROWTH / OPPORTUNITIES / CORPORATE / RESPONSIBILITY / RECONCILIATIONS & / SUPPLEMENTAL INFO / 1 Hotel Brooklyn Bridge / ACQUISITION RATIONALE / $202 million purchase price reflects strong acquisition multiple of / 10.2x based on 2026E EBITDA(1) / Immediately accretive to 2026E Adjusted EBITDAre and recent / trading multiple / Forecast to be among Host’s top-10 assets based on 2026E / TRevPAR, RevPAR, and EBITDA/key / 83 years remain on the ground lease with a non-profit lessor / Iconic and irreplaceable location in Brooklyn Bridge Park with East / River and Manhattan skyline views / Convenient access to Manhattan via car, train, and ferry / Brooklyn’s only branded luxury hotel centrally positioned in the / Dumbo submarket near the borough’s key demand generators, / including high-end restaurants, boutique retail, a growing tech / startup hub, and many fashion and entertainment companies / Further diversifies Host’s presence in New York City / Favorable supply outlook driven by permanent hotel closures, / recent policies including restrictive short-term rental laws and / enforcement / Additional future ROI opportunities not included in underwriting / 1) Consistent with industry practice, we calculate the EBITDA multiple as the ratio of the purchase price to the property’s EBITDA. EBITDA is a non- / GAAP financial measure. The comparable GAAP metric using net income is the ratio of the purchase price to 2026 forecast net income of 20x. See / slide 2 for factors that may cause results to be materially different from these targets. The purchase price used for the EBITDA multiple is net of the / $4 million furniture, fixtures and equipment reserve. See Reconciliations and Supplemental Information for a reconciliation of hotel EBITDA to net / income. / © Host Hotels & Resorts, Inc. / 13
Visuals: Three photographs stacked in the right column, top to bottom. (1) Exterior entrance of the hotel: a row of tall vertical wooden slats runs across the upper facade behind glass doors, with a rusted corten-style steel panel on the right carrying a large dark numeral 1 above the word HOTEL and the script words brooklyn bridge; in front are potted shrubs and grey stone pavers, with white gravel and small uplights along the base; daylight, neutral and warm, with a cool grey-green tone; full-bleed to the right edge and cropped at the top by the nav bar. (2) Guest room interior: floor-to-ceiling windows on the left show a city skyline and the Brooklyn Bridge at right; a grey hammock hangs in front of the windows, a pair of grey knitted poufs sit on dark wood flooring with a patterned rug, and a made bed with grey throw is on the right; warm wood and grey tones with a daylight palette; full-bleed, rectangular, no overlay. (3) Lobby lounge: a wood-slat ceiling with recessed ceiling lights, grey upholstered sofas with cushions in the foreground, white and grey armchairs, a round side table, woven stools, potted plants, and a pale wood reception desk visible in the distance; neutral greys, beige and warm wood, soft daylight from large windows at the back; full-bleed, rectangular, no overlay. No charts, tables, logos or icons. A small teal gradient chevron arrow at the left edge is a graphic accent.
Slide 14
COMPANY OVERVIEW
RECENT HIGHLIGHTS
PORTFOLIO UPDATE
GROWTH OPPORTUNITIES
CORPORATE RESPONSIBILITY
RECONCILIATIONS & SUPPLEMENTAL INFO
1 Hotel Brooklyn Bridge
Property Overview
► 195 keys including 29 suites
► 12,000 SF of meeting space
– 6,000 SF ballroom
– Screening room
► Luxury urban resort
► Part of a mixed-use development with 106 residential units located in a separate tower
► Leasehold interest with non-profit lessor
Property Features
► Multiple food and beverage outlets including Barbuto Brooklyn, led by James Beard award-winning chef Jonathan Waxman
► Bamford wellness spa with 10 treatment rooms
► Rooftop pool
► Fitness center
► Underground parking
Capex Requirements
► Opened in 2017 and well maintained with no deferred capex
► LEED Gold Certified®
$615 | $1,130 | $100,000
2026E RevPAR(1)
2026E TRevPAR(1)
2026E EBITDA/Key(1,2)
1) Metrics reflect 2026 forecast.
2) The comparable GAAP metric using 2026 forecast net income is $52,000 per key. Forecast 2026 EBITDA and net income targets are illustrative only and actual results are expected to vary. See slide 2 for factors that may cause results to be materially different from these targets. See Reconciliations and Supplemental Information for reconciliation of net income to EBITDA.
© Host Hotels & Resorts, Inc.
14
Visuals: Three photographs in a full-bleed row: (1) left, rooftop infinity pool with turquoise water, teal tiled edge, wooden deck, row of lounge chairs with folded towels, a dark parasol, and a Manhattan skyline across a river under a pale blue sky with thin clouds; daylight; blue, teal and green dominant; rectangular, not cropped to a shape. (2) centre, lounge interior with a floor-to-ceiling living wall of climbing green plants on a concrete wall, tan leather sofas, a wooden low table, woven straw stools and potted plants, tall windows at right; warm interior light; green, brown and grey dominant. (3) right, restaurant dining room with tan upholstered wooden chairs, tables set with glassware, a back bar with rows of bottles, pendant lights, large windows showing green trees, and potted plants; warm amber light; tan, brown and green dominant. A teal banner (see elements) overlaps the top edges of photos 1 to 3. No logos or charts.
Slide 15
COMPANY
OVERVIEW
RECENT
HIGHLIGHTS
PORTFOLIO
UPDATE
GROWTH
OPPORTUNITIES
CORPORATE
RESPONSIBILITY
RECONCILIATIONS &
SUPPLEMENTAL INFO
Renaissance Dallas at Plano Legacy West
ACQUISITION RATIONALE
$172 million purchase price reflects strong acquisition multiple of
11.2x based on 2026E EBITDA(1)
Immediately accretive to 2026E Adjusted EBITDAre and recent
trading multiple
Forecast to be among Host’s top-25 assets based on 2026E TRevPAR
and EBITDA/key
New market for Host’s portfolio improves geographic diversification
Market has demonstrated supply absorption: demand growth CAGR
of 5.4% from 2019-2025 despite supply nearly doubling since 2015(2)
Uniquely positioned within the high-growth Dallas/Fort Worth
market, benefitting from captive business transient and corporate
group demand as well as strong social demand
Only hotel within Legacy West, a premier 240-acre mixed-use
development anchored by major corporations, Class A offices,
luxury residences, and high-end retail
More than 75 Forbes Global 2000 companies in the area with
continued corporate relocations and entertainment district
development expected
Additional future ROI opportunities not included in underwriting
1) Consistent with industry practice, we calculate the EBITDA multiple as the ratio of the purchase price to the property’s EBITDA. EBITDA is a non-
GAAP financial measure. The comparable GAAP metric using net income is the ratio of the purchase price to 2026 forecast net income of 18x. See
slide 2 for factors that may cause results to be materially different from these targets. See Reconciliations & Supplemental Information for a
reconciliation of hotel EBITDA to net income.
2) Source: STR, Inc. a CoStar company, Host Hotels & Resorts Enterprise Analytics, Strategic Insight; September 2026.
© Host Hotels & Resorts, Inc.
15
Visuals: Three photographs stacked in the right column, each full-bleed to the right slide edge and abutting each other with no gaps or borders. Top photo (x64.0 y4.2 w36.0 h33.5): exterior of a roughly ten-storey hotel with a blue reflective glass curtain wall, white cumulus clouds in a blue sky, a red-flowering crape myrtle tree at the left edge, green street trees and a parking area in the foreground, and a rooftop sign reading RENAISSANCE with a stylised R logo at the top right of the building; bright daylight, building shown from a low three-quarter angle, cropped at the top by the tab band. Middle photo (x64.0 y36.0 w36.0 h30.9): guest room with a king bed dressed in a white duvet and a charcoal-grey throw across the foot, dark brown upholstered headboard panel, a cylindrical wall pendant lamp at right, a red armchair and dark wood desk at left, sheer white curtains and dark drapes around a window; warm lamplight and neutral cream, charcoal and brown tones. Bottom photo (x64.0 y66.7 w36.0 h33.3): restaurant interior with long rows of wooden tables and wooden chairs with red seat pads, many gold metal birdcage-style pendant lights hanging from the ceiling, a dark red curtain at the right, a mosaic wall of round tiles in grey, purple and white, and a grey floor; warm, low lighting in browns, gold and red. No charts, tables, logos or icons other than the teal chevron at the left margin, which is a decorative shape and not a logo.
Slide 16
COMPANY
OVERVIEW
RECENT
HIGHLIGHTS
PORTFOLIO
UPDATE
GROWTH
OPPORTUNITIES
CORPORATE
RESPONSIBILITY
RECONCILIATIONS &
SUPPLEMENTAL INFO
Renaissance Dallas at Plano Legacy West
Property Overview
308 keys including 16 suites
35,000 SF of meeting space
15,000 SF ballroom
Only hotel in a 240-acre premier mixed used development
Fee simple interest
Property Features
Multiple food and beverage outlets
Outdoor pool with bar and cabanas
Fitness center
Attached 464-space parking garage
Capex Requirements
Opened in 2017 and well maintained with no deferred capex
$200 | $380 | $50,000
2026E RevPAR(1)
2026E TRevPAR(1)
2026E EBITDA/Key(1,2)
1)
Metrics reflect 2026 forecast.
2)
The comparable GAAP metric using 2026 forecast net income is $32,000 per key. Forecast 2026 EBITDA and net income targets are illustrative only and actual results are expected to vary. See slide 2 for factors that may cause results to be materially different from these targets. See Reconciliations and Supplemental Information for reconciliation of net income to EBITDA.
© Host Hotels & Resorts, Inc.
16
Visuals: Three photographs in a row below the metrics band: (1) left, a hotel lobby with a sweeping staircase with open wooden treads, floor-to-ceiling windows on the right, a bar with stools and a seating area of dark leather armchairs and wooden side tables, a wall of textured white three-dimensional panels on the left, ceiling downlights, warm neutral lighting, cropped to a rectangle about 29.8% wide and 35% high; (2) centre, an outdoor rooftop pool with a long rectangular pool of blue water edged with blue mosaic tile, a shaded cabana with dark wood slatted screens and white curtains, grey lounge chairs, a white umbrella and a city skyline in haze behind, daylight with a blue sky and white clouds, cropped to a rectangle about 39.4% wide and 35% high; (3) right, an evening patio with a red woven basket-style lounge chair in the foreground, a round dark fire pit with a visible flame, a stone and wood bench wall, dark dining chairs and a table, uplit trees and warm lamps, dusk blue sky, cropped to a rectangle about 30% wide and 35% high. The three photos are butted together with small white gaps and are not overlaid. A teal rectangle with a faint drop shadow overlays the top edge of the centre photo and the top strip of the other two. Metrics band: a solid teal rectangle with a faint soft shadow on its right and bottom edges, containing three large white numerals separated by two thin white vertical bars, with white captions beneath each numeral, each caption carrying a superscript footnote marker.
Slide 17
COMPANY / OVERVIEW
RECENT / HIGHLIGHTS
PORTFOLIO / UPDATE
GROWTH / OPPORTUNITIES
CORPORATE / RESPONSIBILITY
RECONCILIATIONS & / SUPPLEMENTAL INFO
Capital Allocation Highlights
CAPITAL RETURN TO STOCKHOLDERS
DIVIDEND
$3.2B
Total dividends paid since re-introducing the / dividend post-pandemic in 2022
SHARE REPURCHASE
$1.2B
Since 2017, 73.2 million shares repurchased at an average / price of $16.76
$405 million of remaining capacity under the current / repurchase program
PORTFOLIO INVESTMENTS
REINVESTMENT
$2.0B
Portfolio reinvestment on ROI capex projects / between 2019 – 2025
Projects include comprehensive renovations and ROI / developments
ACCRETIVE RECYCLING(1)
ACQUISITIONS
DISPOSITIONS
$3.7B @ 13.0x
EBITDA
$2.9B @ 16.5x
EBITDA
From 2021-2026, accretively recycled assets in the / portfolio to elevate the EBITDA growth profile
Acquired 14 assets in 7 new markets with no meaningful / near-term capex expected
Disposed of 17 assets, 4 on ground leases, and avoided / $710 million in estimated near-term capex
1) See footnote 1 on slide 10 for comparable GAAP metrics.
© Host Hotels & Resorts, Inc.
17
Visuals: No photographs, charts, tables, icons or logos. Non-text visuals are: the six-tab navigation bar (five grey #AFAFAC tabs and one teal #407676 tab, each with white uppercase labels, separated by small gaps); two thin pale grey-green horizontal rules (about #E4EAE4, about 0.1% of slide height) running across the slide at about 19.8% and 54.5% height, interrupted by the two white section-header boxes; two white rectangles with thin light grey borders (about #EEF0EE) behind the section headers; and small teal #7FBABA right-pointing triangle bullets (the glyph ►) beside each bullet line. The superscript (1) after ACCRETIVE RECYCLING is a text marker.
Slide 18
COMPANY / OVERVIEW
RECENT / HIGHLIGHTS
PORTFOLIO / UPDATE
GROWTH / OPPORTUNITIES
CORPORATE / RESPONSIBILITY
RECONCILIATIONS & / SUPPLEMENTAL INFO
Comprehensive Renovation Scorecard
Host leveraged its unique relationship with Marriott to devise the Marriott Transformational Capital Program
(“MTCP”), a first-of-its-kind capex reinvestment program that included 15 properties. Outside of MTCP, 8 other
properties were subsequently added, bringing the total to 23 comprehensive renovations from 2018 to 2023.
21 of the completed properties have stabilized post-renovation with their average RevPAR Index share gain well
above the targeted range.
TARGET
3–5
POINTS
Targeted RevPAR Index
Share Gain Post
Renovation(2)
RESULT
+8.7
POINTS
Average RevPAR Index
Share Gain for
21 Stabilized Properties
15 MTCP ASSETS(1)
8 ADDITIONAL ASSETS(1)
Coronado Island Marriott / New York Marriott Marquis / The Don CeSar
New York Marriott Downtown / Orlando World Center Marriott / Hyatt Regency Maui
San Francisco Marriott Marquis / Houston Medical Center Marriott / Westin Georgetown
Santa Clara Marriott / Marina Del Rey Marriott / Miami Marriott Biscayne Bay
San Antonio River Center Marriott / Boston Copley Marriott / Westin Denver Downtown
Minneapolis Marriott City Center / JW Marriott Houston / Fairmont Kea Lani
JW Marriott Buckhead / San Diego Marriott Marquis / Hyatt Regency Coconut Point
Ritz-Carlton Amelia Island / (empty) / Ritz-Carlton Naples
1) Bold denotes stabilized post-renovation and included in the results average. These results are illustrative only and there can be no guarantees that other projects will result in similar results. See Slide 2 for factors that may cause / results to be materially different from expectations.
2) RevPAR index share is measured relative to hotels’ competitive sets using STR data for peers. Gain is measured against the three-year RevPAR index average prior to renovation. For more information on how RevPAR index is / calculated, see Reconciliations & Supplemental Information.
© Host Hotels & Resorts, Inc.
18
Visuals: Two stat blocks and one table; no photograph, chart, logo or icon. Left stat block 1: label TARGET in teal, large figure 3–5 in heavy teal, unit POINTS in light teal, caption ‘Targeted RevPAR Index Share Gain Post Renovation’ with superscript (2) in grey. Left stat block 2: label RESULT in teal, large figure +8.7 in heavy teal, unit POINTS in light teal, caption ‘Average RevPAR Index Share Gain for 21 Stabilized Properties’ in grey. Table: 3 columns and 8 rows of data beneath a two-part header. Header cell spanning columns 1 and 2 reads 15 MTCP ASSETS(1) on teal #407676; header cell over column 3 reads 8 ADDITIONAL ASSETS(1) on dark #203B3B. Column 1 rows: Coronado Island Marriott; New York Marriott Downtown; San Francisco Marriott Marquis; Santa Clara Marriott; San Antonio River Center Marriott; Minneapolis Marriott City Center; JW Marriott Buckhead; Ritz-Carlton Amelia Island. Column 2 rows: New York Marriott Marquis; Orlando World Center Marriott; Houston Medical Center Marriott; Marina Del Rey Marriott; Boston Copley Marriott; JW Marriott Houston; San Diego Marriott Marquis; cell empty. Column 3 rows: The Don CeSar; Hyatt Regency Maui; Westin Georgetown; Miami Marriott Biscayne Bay; Westin Denver Downtown; Fairmont Kea Lani; Hyatt Regency Coconut Point; Ritz-Carlton Naples. Bold marks stabilized properties per footnote 1; the last two rows of column 3 are regular weight. Row fills alternate #CED6D6 and #E8ECEC; no highlighted points.
Slide 19
COMPANY OVERVIEW
RECENT HIGHLIGHTS
PORTFOLIO UPDATE
GROWTH OPPORTUNITIES
CORPORATE RESPONSIBILITY
RECONCILIATIONS & SUPPLEMENTAL INFO
Hyatt Transformational Capital Program Overview
WHAT
Following the success of stabilized comprehensive renovations, Host has reached an agreement with Hyatt on the
Hyatt Transformational Capital Program (“HTCP”), a similar capex reinvestment program at six properties.
WHY
Building on the success of the Marriott Transformational Capital Program, Host believes these portfolio
investments will position the hotels to compete better in their respective markets while seeking to enhance long-
term performance.
GOAL
Targeting low double-digit stabilized annual cash-on-cash returns on incremental investment through a
combination of enhanced owner’s priority returns and RevPAR Index share gains.
$525-550
MILLION
Total program investment expected
(roughly 2/3 of which was planned)
$40
MILLION
Operating profit guarantee
from Hyatt
$125-200
MILLION
Expected investment per year
between 2024-2027
HTCP ASSETS
RENOVATION START
TARGETED COMPLETION
Grand Hyatt Atlanta in Buckhead
Q1 2024
Q1 2025 – Complete
Hyatt Regency Washington on Capitol Hill
Q1 2025
Q3 2025 – Complete
Hyatt Regency Austin
Q2 2025
Q4 2025 – Complete
Hyatt Regency Reston
Q4 2024
Q1 2026 – Complete
Grand Hyatt Washington, DC
Q1 2024
Q2 2026 - Complete
Manchester Grand Hyatt San Diego
Q1 2025
Q1 2027
© Host Hotels & Resorts, Inc.
19
Visuals: Table: three columns (HTCP ASSETS; RENOVATION START; TARGETED COMPLETION) and six data rows. Rows: Grand Hyatt Atlanta in Buckhead | Q1 2024 | Q1 2025 – Complete; Hyatt Regency Washington on Capitol Hill | Q1 2025 | Q3 2025 – Complete; Hyatt Regency Austin | Q2 2025 | Q4 2025 – Complete; Hyatt Regency Reston | Q4 2024 | Q1 2026 – Complete; Grand Hyatt Washington, DC | Q1 2024 | Q2 2026 - Complete; Manchester Grand Hyatt San Diego | Q1 2025 | Q1 2027. Header row dark teal-navy #203B3B with white bold caps; body rows alternate #CED6D6 and #E8ECEC; cell text centred in columns 2 and 3, left-aligned in column 1. Three large numeric stat callouts ($525-550, $40, $125-200 million) in teal, each with a caption beneath; no chart. No photographs, logos or icons.
Slide 20
COMPANY OVERVIEW
RECENT HIGHLIGHTS
PORTFOLIO UPDATE
GROWTH OPPORTUNITIES
CORPORATE RESPONSIBILITY
RECONCILIATIONS & SUPPLEMENTAL INFO
Marriott Transformational Capital Program 2 Overview
WHAT
Following the success of stabilized comprehensive renovations, Host has reached a second agreement with Marriott on the Marriott Transformational Capital Program 2 (“MTCP2”), a similar capex reinvestment program at four additional properties.
WHY
Building on the success of prior Transformational Capital Programs, Host believes these portfolio investments will position the hotels to compete better in their respective markets while seeking to enhance long-term performance.
GOAL
Targeting mid-teens stabilized annual cash-on-cash returns through a combination of RevPAR Index share gains and enhanced owner’s priority returns. Similar to the first MTCP program, these targeted returns assume 3-to-5 points of RevPAR Index share gains at stabilization.
$300-350
MILLION
Total program investment expected (roughly 2/3 of which was planned)
$18
MILLION
Operating profit guarantee from Marriott
$35-55
MILLION
Expected investment per year between 2025-2029, with $110 million expected in 2026
MTCP2 ASSETS
TARGETED START
TARGETED COMPLETION
New Orleans Marriott
Q3 2025
Q3 2026 & 2028
The Ritz-Carlton Naples, Tiburón
Q2 2026
Q3 2026 – Complete
The Ritz-Carlton, Marina del Rey
Q3 2026
Q2 2027
Westin Kierland
Q2 2026
Q4 2026, 2027, & 2029
© Host Hotels & Resorts, Inc.
20
Visuals: Full-width navigation bar of six grey (#AFAFAC) tabs with white caps labels, the active RECENT HIGHLIGHTS tab filled teal #407676. A light grey (#F2F2F2) horizontal band spans the full slide width behind the three stat blocks. A table with three columns (MTCP2 ASSETS, TARGETED START, TARGETED COMPLETION) and a dark teal header row, followed by four alternating light grey data rows: New Orleans Marriott | Q3 2025 | Q3 2026 & 2028; The Ritz-Carlton Naples, Tiburón | Q2 2026 | Q3 2026 – Complete; The Ritz-Carlton, Marina del Rey | Q3 2026 | Q2 2027; Westin Kierland | Q2 2026 | Q4 2026, 2027, & 2029. No photographs, charts or logos.
Slide 21
COMPANY OVERVIEW / RECENT HIGHLIGHTS / PORTFOLIO UPDATE / GROWTH OPPORTUNITIES / CORPORATE RESPONSIBILITY / RECONCILIATIONS & SUPPLEMENTAL INFO / HOST / HOTELS & RESORTS® / Portfolio / Update / GRAND HYATT WASHINGTON
Visuals: Photograph: interior of a restaurant. Subject: a circular feature ceiling of tubular amber and bronze glass rods hung in tiers, with dark bronze elliptical rings; below it, teal curved upholstered banquette sofas and grey-beige upholstered armchairs with dark wood legs around round white-topped tables with dark pedestal bases, set with brown napkins, plates, glass tumblers and blue votive candles. Potted plants in stone planters (a fiddle-leaf fig and a snake plant) stand in the foreground; blue-to-white ombre curtains and copper-banded columns sit in the background. Composition: wide-angle, eye level, cropped at the left, right and top edges; the photo runs under the navy band at the bottom. Lighting: warm ambient light from the ceiling, soft and even. Dominant colours: amber/bronze, teal, beige, with some dark brown and green. The photo is boxed to its rectangle, not full-bleed, with no overlay on the image itself other than the navy band at its base. Logo: HOST HOTELS & RESORTS® corporate logo, centred in the white panel; a stylised mark of a gold block and a navy block above the wordmark HOST in navy serif capitals, with HOTELS & RESORTS® in smaller navy serif capitals beneath.
Slides 22 to 69 continue in the full text file.
Download this deck
The hosted PDF of every library deck is free for readers of the SlideDeck Co newsletter. Join with your email and the viewer and download appear here.
Preparing a results presentation or business update of your own? The SlideDeck Co Standard Deck is a slide library for business reviews, updates and plans.







