
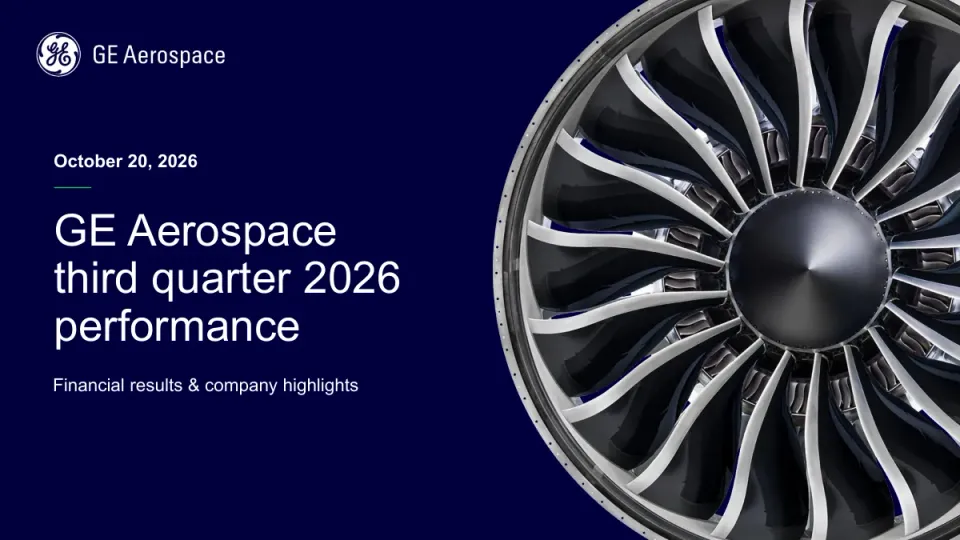
The deck opens with a title slide dated October 20, 2026, followed by a forward-looking statements and non-GAAP disclaimer. It then moves into a quarter summary with headline metrics for orders, adjusted revenue, operating profit, adjusted EPS and free cash flow, shown both for the quarter and year to date. Operational highlights follow, covering the FLIGHT DECK output program, technology investments and the planned acquisition of Consolidated Precision Products. Segment sections for Commercial Engines & Services and Defense & Propulsion Technologies come next, each with revenue and operating profit charts and bullet commentary. The deck then reviews the raised 2026 guidance in a comparison table, summarises the company's installed base and R&D positioning, and closes with Q&A, an appendix of segment guidance, reconciliation tables and the earnings calendar. Slides worth studying include the KPI card layouts on slides 3 and 6, the segment bar charts on slides 8 and 9, and the guidance table on slide 10, which packs three years of figures and the segment dynamics into one view.
Slides worth studying
- Slide 6: Uses a row of large, evenly sized KPI cards with one headline figure and a small year-over-year line, followed by a YTD strip, so the key numbers read at a glance.
- Slide 8: Pairs a three-quarter bar chart with a margin row and short bullet commentary, a clean and repeatable layout for segment performance.
- Slide 10: A guidance table comparing prior and current 2026 outlook beside segment dynamics makes the change in forecast easy to see at a glance.
- Slide 3: Splits the quarter into a left column of headline messages and a right column of metrics, so the narrative and the numbers sit side by side.
Details
- Company: GE Aerospace
- Year: 2026
- Type: Investor presentation
- Industry: Aerospace
- Pages: 21
The hosted copy of this deck is being prepared. Newsletter readers will find the download here.
Review score: 7 out of 10, Effective
Presentation quality, judged with the SlideDeck Co review heuristic. Ask, evidence and idea merit are not rated here.
The deck follows a clear earnings route: headline results (slides 3 and 6), operations (4 and 5), EPS bridge (7), segments (8 and 9), then guidance (10), with a consistent navy and green identity, plain action titles and readable KPI cards, bar charts and a guidance table. The main weaknesses are on slides 4 and 5, where captions sit as small text over photos with poor contrast, and slide 6, where the YTD row drops its metric labels so the audience must map it back to the cards above. Appendix slides 16 and 18 to 20 carry tiny reconciliation tables, and slide 2 is dense small legal text, which is acceptable as reference material but unreadable on screen. Overall it is competent and usable, with several consequential craft and legibility flaws.
Worth keeping: Keep the navy and green system, the KPI card structure, the segment slides 8 and 9 with highlighted current-quarter bars and a YTD summary band, and the prior versus current guidance table on slide 10.
Most useful repair: Move the photo captions on slides 4 and 5 off the images into solid text areas at larger size, and label the YTD tiles on slide 6 so each one reads on its own.
What would change the score: I would add a headline takeaway to slide 7's EPS bridge and make the segment charts on slides 8 and 9 larger, with bigger axis and margin labels.
Confidence high. 21 of 21 pages inspected on contact sheets, 4 at readable size. Reviewed 2026-11-10. Model-assisted review (claude-sonnet-5-5).
Full text of the slides (21 slides)
Every slide's words and a description of its charts and images, so the deck can be searched and rebuilt. Also available as Markdown.
Slide 1
October 20, 2026 / GE Aerospace / third quarter 2026 / performance / Financial results & company highlights
Visuals: Photograph at right, x 49.0%, y 0%, w 51.0%, h 100% (978 by 1086 px, full-height and bleeding off the top, right and bottom edges, unboxed). It shows a close-up, head-on view of a large aircraft turbofan engine fan: a ring of dark grey-black composite blades with polished silver leading edges radiating from a dark brushed-metal central hub (spinner) and a dark grey outer casing ring with rivet holes. Lighting is soft and directional from upper left, producing silver highlights on the blade edges. Dominant colours are charcoal, graphite and silver, with a thin navy edge where the image meets the background. The photo is cropped by the slide edges on the right and top. Logo: GE monogram (white circular logo with interlocking 'GE' script) followed by the white wordmark 'GE Aerospace' in a sans-serif, at top-left.
Slide 2
GE Aerospace / Caution concerning forward-looking statements: / This document contains "forward-looking statements" – that is, statements related to future events that by their nature address matters that are, to different / degrees, uncertain. For details on the uncertainties that may cause our actual future results to be materially different than those expressed in our forward-looking / statements, see www.geaerospace.com/investor-relations/important-forward-looking-statement-information as well as our annual reports on Form 10-K and / quarterly reports on Form 10-Q. We do not undertake to update our forward-looking statements. This document also includes certain forward-looking projected / financial information that is based on current estimates and forecasts. Actual results could differ materially. / Non-GAAP financial measures: / In this document, we sometimes use information derived from consolidated financial data but not presented in our financial statements prepared in accordance / with U.S. generally accepted accounting principles (GAAP). Certain of these data are considered “non-GAAP financial measures” under the U.S. Securities and / Exchange Commission rules. These non-GAAP financial measures supplement our GAAP disclosures and should not be considered alternatives to the / corresponding GAAP measures. The reasons we use these non-GAAP financial measures and the reconciliations to their most directly comparable GAAP / financial measures are included in our earnings releases, our Quarterly Report on Form 10-Q, and our earnings presentations, as applicable. / Additional information: / Amounts shown on subsequent pages may not add due to rounding. Charts shown on subsequent pages are not to scale. / CFM International is a 50/50 JV that produces CFM56 and LEAP engine families. RISE is a program of CFM International. CFM RISE is a registered trademark. / CFM RISE is a technology demonstrator program, not a product for sale. Engine Alliance is a 50/50 JV that produces the GP7200 engine. / GE Aerospace’s Investor Relations website at www.geaerospace.com/investor-relations, as well as GE Aerospace's LinkedIn and other social media accounts, / contain a significant amount of information about GE Aerospace, including financial and other information for investors. GE Aerospace encourages investors to / visit these websites from time to time, as information is updated, and new information is posted. / 2
Visuals: GE Aerospace logo at top right, boxed as a 240 by 86 pixel image: a white circular GE monogram (interlocking lowercase g and e in a ring) followed by the white wordmark 'GE Aerospace' in a sans-serif typeface. One short green horizontal dash at the left margin beside the 'Non-GAAP financial measures:' heading, about 3.6% from the left edge, about 2% wide and under 1% tall, solid bright green, square ends. No photographs, charts, tables or diagrams.
Slide 3
3Q'26 updates
GE Aerospace
Another quarter of solid demand and services strength ...
total orders +49%, adj. revenue* +18% and EPS* +36%,
raising 2026 guide across the board
FLIGHT DECK driving continued output momentum …
YTD commercial services revenue and total engine
deliveries both up >20%
Investing to meet customer needs … building capacity
with Consolidated Precision Products (CPP) plus >$3 billion
in annual R&D to advance current and future technologies
* Non-GAAP Financial Measure
3Q’26
3Q'26 YTD
Orders growth
+49%
+49%
Adjusted revenue* growth
+18%
+23%
Operating profit*
$3.0B +30% y/y
$8.3B +22% y/y
Adjusted EPS*
$2.25 +36% y/y
$6.13 +28% y/y
Free cash flow*
$2.0B (14)% y/y
$6.7B +13% y/y
3
Visuals: Right panel: a dark navy photograph-like abstract image of curved, swirling shapes resembling fan blades or sculpted metal, with lighter blue-violet highlights, covered by a #00003D navy overlay at 80% opacity, forming a full-height tinted panel. Overlaid on it is a 2-column by 5-row white table with a thin white horizontal rule under the header and between each row. Columns: row labels, 3Q’26, 3Q'26 YTD. Rows: Orders growth +49% / +49%; Adjusted revenue* growth +18% / +23%; Operating profit* $3.0B (+30% y/y) / $8.3B (+22% y/y); Adjusted EPS* $2.25 (+36% y/y) / $6.13 (+28% y/y); Free cash flow* $2.0B ((14)% y/y) / $6.7B (+13% y/y). Values in the first data row are bold, sub-values are italic. Logo: GE monogram in a navy circle with the wordmark GE Aerospace in navy, top right.
Slide 4
Driving continued output momentum with / FLIGHT DECK / GE Aerospace / Delivering for customers … YTD commercial / services revenue +26% and total engine / deliveries +21% / Problem solving with suppliers, airframers, / airlines and lessors … 3Q priority supplier / material input up double-digits / Removing waste and leveraging AI to improve / output … LEAP turnaround time down ~2 weeks, / which combined with other efforts has driven / grounded aircraft from engines to nearly zero / >2x / LEAP fan / assembly output / To support the LEAP ramp, our team / focused on improving flow and / standardizing work on the assembly line / for a key component, growing assembly / capacity. / 4
Visuals: Photograph of a large silver jet engine fan assembly (LEAP fan case) sitting in an industrial factory interior with overhead lights, ductwork and yellow equipment at the right edge. Composition: the engine ring fills the centre-right of the photo, cropped at the right edge of the slide and at the bottom, boxed in a rectangle with a thin green bar along its top edge. Lighting is bright overhead factory light; dominant colours are silver-grey metal, white and yellow. A translucent dark navy overlay (#00003C at about 43% opacity) covers the lower-left portion of the photo, carrying the '>2x' figure and italic caption. Green short horizontal rules (about #0AD64F) sit in the left column between text blocks. The FLIGHT DECK tag is a navy outlined box with dashes at each side. The GE Aerospace logo is a navy circular GE monogram with the text 'GE Aerospace' beside it.
Slide 5
Investing to meet customer needs
Signed an agreement to acquire Consolidated Precision Products (CPP) to
support delivery and new technology innovation.
Achieved significant milestones on GEK800 (F143) with Kratos including
selection by U.S. Air Force as second source on JASSM.
Completed the world's first high-altitude hybrid electric flight above 30,000
feet in partnership with NASA, BETA Technologies and Boeing.
XA102 selected by the U.S. Air Force for the next phase of NGAP,
which includes hardware procurement and subcomponent testing.
Advancing current and future technologies
5
Visuals: Four photographic or illustrated panels in a 2x2 grid, each with a thin bright green rule along its top edge and a dark gradient fading in at its base where the caption sits. Top-left panel: the CPP logo, a bold dark-blue (about #1E2A8A) wordmark 'CPP' with a red (#E8243C) dotted arc of about eight ellipses rising from its top-right, set on a flat light grey (#EBEBEB) field, boxed and not cropped. Top-right panel: a photograph of the GEK800 (F143) Kratos drone, a dark grey-black cruise missile-like airframe with a vertical tail and a yellow-green stripe along the fuselage, flying over blue sea and scattered white cumulus cloud, lit from above and slightly left, with a blue-to-navy tint toward the base, boxed, not cropped. Bottom-left panel: a photograph of a white turboprop aircraft with GE Aerospace and BETA livery in navy (registration N399CL), in climb to the left over a cloudy sky, with a dark-blue tail featuring a large GE monogram, three-blade propeller, boxed, slightly cropped at the bottom by the caption gradient. Bottom-right panel: a studio render of the XA102 turbofan engine seen from front-right, with a large fan of dark blades, grey metallic casing and purple-grey wiring harnesses on a dark grey gradient background, lit from upper left, boxed, not cropped. Top-right corner: GE Aerospace logo, a navy circular monogram 'GE' with the wordmark 'GE Aerospace' in dark navy to its right. Bottom navy band: a solid rectangle with no text effects.
Slide 6
GE Aerospace / 3Q'26 results: strong top and bottom-line growth / Orders / Adjusted / revenue* / Operating / profit* / Adjusted / EPS* / Free cash / flow* / $19.0B / $13.3B / $3.0B / $2.25 / $2.0B / +49% y/y / +18% y/y / +30% y/y / +36% y/y / (14)% y/y / Op profit margin* 22.5% / FCF* conversion-a) 87% / 3Q'26 YTD / +49% y/y / +23% y/y / $8.3B, +22% y/y / $6.13, +28% y/y / $6.7B, +13% y/y / FCF* conversion-a) 105% / * Non-GAAP Financial Measure / (a – FCF* conversion: FCF* / adjusted net income*) / 6
Visuals: None of the visuals are charts, tables or photographs. There are ten solid navy rectangles (#00003C), each with a thin bright green bar along its top edge: five in the top row (Orders, Adjusted revenue*, Operating profit*, Adjusted EPS*, Free cash flow*) and five in the lower YTD row. Each top-row card has a white horizontal hairline about 14% of slide width long at about 49.6% of slide height, centred under its label block. A grey horizontal rule runs left and right of the centred label '3Q'26 YTD' at about 66% of slide height. The GE Aerospace logo at top right is a navy circular GE monogram beside the navy wordmark 'GE Aerospace'.
Slide 7
GE Aerospace
3Q'26 adjusted EPS*: operating profit* driving growth
+36% y/y
$0.55
$(0.01)
$0.05
$2.25
$1.66
• CES and DPT $0.43
• Corporate $0.12
• Adjusted ETR* 15.2%,
up 20 bps
• Diluted share count
down 24M
3Q'25 Adjusted
EPS*
Operating profit*
Adjusted ETR*
Share count,
interest & other
3Q'26 Adjusted
EPS*
3Q'26 YTD
$4.80
$1.14
$0.11
$0.08
$6.13
+28% y/y
* Non-GAAP Financial Measure
Operating profit and interest impacts are tax affected
7
Visuals: Chart: waterfall bar chart, placed as a raster image 2180 by 846 pixels at x 5.7%, y 14.2%, w 85.2%, h 58.8%. No axis, gridlines or legend; a single grey baseline runs across at about y 62.7%. Columns left to right: 3Q'25 Adjusted EPS* navy bar labelled $1.66 (bar about x 8.8% to 21.5%, top about 31.8%, bottom at baseline); Operating profit* grey floating bar labelled $0.55 (about x 25.3% to 38.1%, top about 21.6%, height about 10%), annotated with bullets CES and DPT $0.43 and Corporate $0.12; Adjusted ETR* a thin light grey line labelled $(0.01) (about x 41.9% to 54.7%, at about y 21.5%), annotated Adjusted ETR* 15.2%, up 20 bps; Share count, interest & other a thin grey bar labelled $0.05 (about x 58.4% to 71.2%, top about 20.8%, height about 0.9%), annotated Diluted share count down 24M; 3Q'26 Adjusted EPS* navy bar labelled $2.25 (about x 75% to 87.8%, top about 20.8%, bottom at baseline). Value labels are estimated from the image: the navy totals and $(0.01) are not measured. Summary row: YTD boxes, five rectangles at y 80.6% to 85.9%, each with a centred white value: navy $4.80 (x 8.9% to 21.7%), grey $1.14 (x 25.3% to 38.1%), grey $0.11 (x 41.9% to 54.7%), grey $0.08 (x 58.4% to 71.2%), navy $6.13 (x 75.1% to 87.9%). Two blue callouts: +36% y/y at top right and +28% y/y at right of the YTD row. Logo: GE monogram (circular emblem with interlocking G and E in navy) followed by the wordmark GE Aerospace in navy, a 320 by 114 pixel image.
Slide 8
Commercial Engines & Services (CES): 3Q'26 performance
Revenue
Operating profit
$8.5B
$9.7B
$10.3B
+21% y/y
3Q'25
2Q'26
3Q'26
+21% y/y
$2.4B
$2.7B
$2.9B
Op profit
margin
28.0%
27.3%
27.9%
(10)bps y/y
3Q'25
2Q'26
3Q'26
▪ Services: +17% … ISV-a) revenue +12% from volume
including LEAP >40% and workscope; spare parts >20%
▪ Equipment: +38% … engine deliveries +8% including LEAP
+5% and GEnx growth; no 3Q impact from GE9X deliveries
▪ Op profit: +21% ... Op profit margin (10)bps
▪ Services volume and price partially offset by mix and inflation
3Q'26 YTD: revenue +27%; op profit $7.9B, +22%; op profit margin 27.2%, (130)bps
(a – Internal shop visit
8
Visuals: Two column bar charts, no y-axis shown and no units beyond $B printed on the bars. Left chart, Revenue: column chart with three bars labelled 3Q'25 ($8.5B, grey, about 0.55 of the chart height), 2Q'26 ($9.7B, grey, about 0.65) and 3Q'26 ($10.3B, navy #00003C highlighted, tallest bar). An axis break (two short grey diagonal slashes) sits between 3Q'25 and 2Q'26. Baseline is a thin grey horizontal line. Blue annotation '+21% y/y' (#4181FF) sits to the right of the 3Q'26 value. Right chart, Operating profit: column chart with three bars labelled 3Q'25 ($2.4B, grey, margin 28.0% printed in white italic inside the bar), 2Q'26 ($2.7B, grey, margin 27.3% inside) and 3Q'26 ($2.9B, navy #00003C highlighted, margin 27.9% inside). Axis break slashes sit between 3Q'25 and 2Q'26. Italic label 'Op profit margin' sits to the left of the first bar. Blue '+21% y/y' sits above-right of the 3Q'26 bar and blue '(10)bps y/y' sits to the right of the 3Q'26 bar at baseline height. No legend. No values are estimated; all bar values are printed. Bullet markers are small navy squares. Green underline rules sit under both column headings.
Slide 9
Defense & Propulsion Technologies (DPT): 3Q'26 performance
Revenue
Operating profit
$3.3B
$3.4B
$3.5B
+7% y/y
3Q'25
2Q'26
3Q'26
$0.4B
$0.5B
$0.5B
+8% y/y
Op profit
margin
13.5%
13.8%
13.7%
+20bps y/y
3Q'25
2Q'26
3Q'26
▪ Defense & Systems: +5% … growth in both services and equipment with engine deliveries +4%
– Defense book-to-bill 1.0x in 3Q, 1.5x YTD
▪ Propulsion & Additive Technologies: +10% … driven by Avio Aero and Unison
▪ Op profit: +8% … Op profit margin +20bps
▪ Volume and price partially offset by mix and inflation
3Q'26 YTD: revenue +13%; op profit $1.3B, +14%; op profit margin 13.1%, flat
9
Visuals: Two bar charts, both vertical with flat bars and no gridlines and no y-axis. Left chart, titled Revenue: three bars labelled 3Q'25 $3.3B, 2Q'26 $3.4B and 3Q'26 $3.5B, with category labels 3Q'25, 2Q'26 and 3Q'26 under the baseline; the first two bars are grey #969696 and the 3Q'26 bar is navy #00003C; the bar heights are about 3.3, 3.4 and 3.5 units on an unprinted axis (about proportional to the values); a double diagonal axis-break mark sits between 3Q'25 and 2Q'26; a blue #4181FF label +7% y/y sits to the right of the 3Q'26 bar; grey baseline across the chart. Right chart, titled Operating profit: three bars labelled $0.4B (3Q'25), $0.5B (2Q'26) and $0.5B (3Q'26), with category labels 3Q'25, 2Q'26 and 3Q'26; the first two are grey #969696 and the 3Q'26 bar is navy #00003C; about 0.4 and 0.5 units on an unprinted axis; a double diagonal axis-break mark sits between 3Q'25 and 2Q'26; inside each bar near its base in white bold italic are the margins 13.5% (3Q'25), 13.8% (2Q'26) and 13.7% (3Q'26), with an Op profit margin label to the left of the first bar; blue #4181FF labels +8% y/y beside the 3Q'26 bar top and +20bps y/y at the lower right beside the 3Q'26 bar. No legend and no highlighted points beyond the navy 3Q'26 bars. Both charts are flat with no shadows.
Slide 10
Raising 2026 guidance
As of October 20, 2026
2026 Guide
Prior
2026 Guide
Current
2025
Segment dynamics
Adjusted revenue growth*
Adjusted revenue*
21%
$42.3B
High-teens
~19-20%
Commercial Engines & Services
▪ Revenue: Low 20s
prior: ~20%
– Services: Low 20s (high end of range)
prior: Low 20s
– Equipment: Low 20s
prior: ~20%
▪ Op profit: $10.5-$10.6B
prior: $10.25-$10.35B
Operating profit*
Op profit margin*
$9.1B
21.4%
$10.55-$10.75B
$10.9-$11.0B
Adjusted EPS*
$6.37
$7.65-$7.85
$8.00-$8.10
Free cash flow*
FCF* conversion-a)
$7.7B
113%
$8.9-$9.2B
>100%
$9.1-$9.4B
>100%
Defense & Propulsion Technologies
▪ Revenue: +LDD
▪ Op profit: $1.6-$1.7B
* Non-GAAP Financial Measure
(a – FCF* conversion: FCF* / adjusted net income*)
10
Visuals: Logo: GE Aerospace corporate logo, top-right, a navy circular monogram ('GE' in a circle) followed by the wordmark 'GE Aerospace' in navy; image 320 by 114 px placed at x 85.3%, y 0.0%, w 12.0%, h 7.6%. Table: 5 columns (row label; 2025; 2026 Guide Prior; 2026 Guide Current; Segment dynamics panel) and 4 data rows. Row 1 Adjusted revenue growth*: 2025 = 21% (sub-line $42.3B italic, label 'Adjusted revenue*'); Prior = High-teens; Current = ~19-20% (bold). Row 2 Operating profit*: 2025 = $9.1B (sub-line 21.4%, label 'Op profit margin*'); Prior = $10.55-$10.75B; Current = $10.9-$11.0B (bold). Row 3 Adjusted EPS*: 2025 = $6.37; Prior = $7.65-$7.85; Current = $8.00-$8.10 (bold). Row 4 Free cash flow*: 2025 = $7.7B (sub-line 113%, label 'FCF* conversion-a)'); Prior = $8.9-$9.2B (sub-line >100%); Current = $9.1-$9.4B bold (sub-line >100%). The 2025 column has light grey #F3F3F3 cell fills behind rows 1-4. Thin navy horizontal rules separate rows at about y 41.6%, 57.7% and 73.9%, spanning x 2.5% to 63.0%, about 0.2% of height thick, colour #00003C. Green short underline bars (about #2DB82D, about 0.3% thick) sit under '2025', 'Prior', 'Current' and 'Segment dynamics' in the header band. No chart or photograph.
Slide 11
GE Aerospace
GE Aerospace: advancing propulsion today, tomorrow and in the future
Most Extensive / Installed Base
Highest / Operational / Reliability
Customer / Preferred / Platforms
Breakthrough / Innovation
FLIGHT DECK
Fleet of ~80K engines / and over 2.3B flight / hours creates customer / intimacy and / unmatched insights
Unrivaled customer / service and proven / products deliver time / on wing and lower cost / of ownership
Best performing / products / underwing across / narrowbody, widebody, / regional, rotorcraft, / combat and mobility / platforms
>$3B annual R&D and / leading engineering / talent inventing next- / gen technology to drive / durability, efficiency, / turnaround times and / defense capabilities
GE Aerospace’s / proprietary lean / operating model to / deliver safety, quality, / delivery, and cost – / in that order
Consistently growing op profit* & FCF*, compounding with capital deployment and return opportunities
* Non-GAAP Financial Measure
11
Visuals: Five photographs, one per column, plus one logo and one badge. Column 1: a grey-blue military helicopter in low flight over grey sea with a grey warship at the right edge; boxed, cropped at left and right, overcast daylight, colours grey, slate blue and white. Column 2: close-up frontal view of a turbofan engine intake with black fan blades and a green-highlighted inner ring against pale blue sky with white clouds, cropped at top and bottom; boxed. Column 3: frontal view of a white twin-engine widebody airliner on a tarmac with its nose gear centred, grey-white sky, boxed, cropped at bottom. Column 4: three-quarter view of a black multi-blade fan on the wing of a white aircraft with a blue cheatline and a red wing edge, against a blue and pale pink sky; boxed, with a 307 by 191 pixel image placed at y 33.1 to 50.0 inside the frame. Column 5: two smiling workers in a factory, a grey-haired woman in a striped purple top and a man in glasses and a grey t-shirt with a lanyard, machinery and metal parts in the foreground; warm and cool tones; boxed. Logo: GE monogram in a navy circle with the wordmark GE Aerospace in navy, top right. Badge: a green-outlined bracket frame containing the words FLIGHT DECK in white bold capitals, placed on the navy header of column 5.
Slide 12
GE Aerospace
Q&A
12
Visuals: Two non-text elements. (1) The GE Aerospace logo at top right: a circular GE monogram roundel with the 'GE Aerospace' wordmark beside it, rendered in white on the dark navy background, placed as a 240 by 86 pixel image. (2) A short horizontal green dash to the left of the title, a flat accent line with square ends, about 2% of slide width and 0.3% of slide height, aligned with the title's vertical centre.
Slide 13
Appendix
14 Segment guidance
15 Additional items as of October 20, 2026
16 Orders, revenue and operating profit by segment
13
Visuals: Logo: GE Aerospace corporate logo at top right, consisting of the white circular GE monogram followed by the white wordmark 'GE Aerospace' in a condensed sans-serif. No photographs, charts, or diagrams. A short green horizontal dash (about #2EC53E) sits to the left of the title as a decorative bullet mark.
Slide 14
2026 segment guidance
Guidance as of October 20, 2026 ($ in billions)
Adjusted revenue*
Operating profit*
$31.9
+~20%
+Low 20s
+Low 20s
High end of
range
$24.3
$7.7
+Low 20s
+~20%
+Low 20s
Services
Equipment
Commercial Engines &
Services (CES)
2025
2026E Prior
2026E Current
$8.7
$10.25 - $10.35
$10.5 - $10.6
2025
2026E Prior
2026E Current
$12.2
+LDD
+LDD
Defense & Propulsion
Technologies (DPT)
$1.5
$1.6 - $1.7
$1.6 - $1.7
2025
2026E Prior
2026E Current
Corporate Cost &
Eliminations-a)
$(1.1)
$(1.2)-(1.3)
$(1.2)-(1.3)
Low end of range
2025
2026E Prior
2026E Current
$42.3
+High-teens
+~19-20%
GE Aerospace
$9.1
$10.55 - $10.75
$10.9 - $11.0
2025
2026E Prior
2026E Current
*Non-GAAP Financial Measure
(a – Adjusted Corporate & Other operating costs* represents the sum of Corporate & other profit (costs) and (Eliminations). For 2026E, ~$(500)M is Corporate cost, which is ~flat y/y, and ~$(700)M is Eliminations, which is up ~$(100)M y/y.
14
Visuals: Eight bar-chart graphics in a 2-column by 4-row grid with no axes or gridlines, each bar carrying its value as a label above it. Revenue column (left): CES stacked bars: 2025 total $31.9 made of Services $24.3 (light blue #4181FF) and Equipment $7.7 (navy #00003C); 2026E Prior bar labelled +~20% total, with Services labelled +Low 20s and Equipment labelled +~20%; 2026E Current bar labelled +Low 20s total, with Services labelled +Low 20s High end of range and Equipment labelled +Low 20s. DPT revenue: 2025 $12.2 (grey #999999), 2026E Prior +LDD (navy), 2026E Current +LDD (navy). GE Aerospace revenue: 2025 $42.3 (grey), 2026E Prior +High-teens (navy), 2026E Current +~19-20% (navy). Operating profit column (right): CES: 2025 $8.7 (grey), 2026E Prior $10.25 - $10.35 (navy), 2026E Current $10.5 - $10.6 (navy). DPT: 2025 $1.5 (grey), 2026E Prior $1.6 - $1.7 (navy), 2026E Current $1.6 - $1.7 (navy). Corporate Cost & Eliminations: 2025 $(1.1) (grey, dark text), 2026E Prior $(1.2)-(1.3) and 2026E Current $(1.2)-(1.3) shown as short navy bars with white text, with the italic note 'Low end of range' under the current value. GE Aerospace profit: 2025 $9.1 (grey), 2026E Prior $10.55 - $10.75 (navy), 2026E Current $10.9 - $11.0 (navy). Bars are flat-topped rectangles sitting on thin grey baselines. Logo: GE Aerospace monogram (circular GE emblem in navy with white lettering) followed by the wordmark 'GE Aerospace' in navy at top right. No photographs.
Slide 15
Additional items as of October 20, 2026
GE Aerospace
3Q'26 / YTD
3Q'26
FY'26 dynamics
Diluted share count
1,041M
1,047M
~1,050M in FY'26 vs 1,068M shares in FY'25 … $2.0B of share repurchases in 3Q’26
Cash balance
$8.8B
$8.8B
$10.3B including short-term liquidity investments as of September 30, 2026
Total borrowings
$19.3B
$19.3B
No planned debt repayment … plan to refinance '26+ maturities and issue new debt in '27 to partially fund CPP acquisition
Interest expense*-a)
$(222)M
$(655)M
~$(900)M in FY'26 vs $(816)M in FY'25
Adjusted ETR*
15.2%
15.6%
~16.0% in FY'26 vs 17.3% in FY'25, reduced from prior guide of <16.5%
* Non-GAAP Financial Measure
(a – Interest represents Interest and other financial charges excluding Insurance and U.S. tax equity
15
Visuals: Table with 4 columns and 5 data rows plus header row. Columns: row label (no header); 3Q'26; 3Q'26 YTD; FY'26 dynamics. Rows: Diluted share count | 1,041M | 1,047M | ~1,050M in FY'26 vs 1,068M shares in FY'25 … $2.0B of share repurchases in 3Q’26. Cash balance | $8.8B | $8.8B | $10.3B including short-term liquidity investments as of September 30, 2026. Total borrowings | $19.3B | $19.3B | No planned debt repayment … plan to refinance '26+ maturities and issue new debt in '27 to partially fund CPP acquisition. Interest expense*-a) | $(222)M | $(655)M | ~$(900)M in FY'26 vs $(816)M in FY'25. Adjusted ETR* | 15.2% | 15.6% | ~16.0% in FY'26 vs 17.3% in FY'25, reduced from prior guide of <16.5%. Header cells are white bold text on the navy band, with short green underlines beneath 3Q'26, 3Q'26 YTD and FY'26 dynamics. The GE Aerospace logo (circular blue GE monogram with the wordmark 'GE Aerospace' to its right) sits top right. No photographs, charts or diagrams.
Slide 16
Orders, revenue and operating profit by segment
($ in millions)
3Q’26
3Q’26 YTD
ORDERS
Services
y/y
Equipment
y/y
Total
y/y
Services
y/y
Equipment
y/y
Total
y/y
CES
$9,929
23%
$5,336
235%
$15,265
58%
$29,341
30%
$16,187
128%
$45,528
54%
DPT
$1,805
16%
$2,465
20%
$4,269
18%
$5,400
9%
$9,181
53%
$14,581
33%
GE Aerospace
$11,627
22%
$7,367
127%
$18,994
49%
$34,428
26%
$24,066
101%
$58,494
49%
REVENUE
Services
y/y
Equipment
y/y
Total
y/y
Services
y/y
Equipment
y/y
Total
y/y
CES
$7,735
17%
$2,607
38%
$10,342
21%
$21,986
26%
$7,006
30%
$28,992
27%
DPT
$1,715
8%
$1,754
5%
$3,469
7%
$5,022
10%
$5,103
17%
$10,126
13%
Eliminations & other
$(89)
(24)%
$(437)
(11)%
$(526)
(13)%
$(269)
(37)%
$(1,316)
(19)%
$(1,585)
(22)%
GE Aerospace
$9,361
15%
$3,924
24%
$13,285 -a)
18% -a)
$26,739
23%
$10,794
25%
$37,533 -a)
23% -a)
OPERATING PROFIT
3Q’26
y/y
3Q’26 YTD
y/y
CES
$2,887
21%
$7,899
22%
DPT
$475
8%
$1,329
14%
Corporate cost and eliminations*-b)
$(373)
29%
$(966)
(9)%
GE Aerospace*
$2,988
30%
$8,262
22%
16
* Non-GAAP Financial Measure
(a – Adjusted revenue*
(b – Adjusted Corporate & Other operating costs* represents the sum of Corporate & other profit (costs) and (Eliminations). Corporate & other and Eliminations were $(217)M and $(156)M, respectively, in 3Q'26, and $(462) and $(504),
respectively, in 3Q'26 YTD.
Visuals: Three data tables, no charts or photographs. Table 1 ORDERS, columns Services / y/y / Equipment / y/y / Total / y/y for 3Q’26 and again for 3Q’26 YTD; rows CES: $9,929, 23%, $5,336, 235%, $15,265, 58% | $29,341, 30%, $16,187, 128%, $45,528, 54%. DPT: $1,805, 16%, $2,465, 20%, $4,269, 18% | $5,400, 9%, $9,181, 53%, $14,581, 33%. GE Aerospace total band: $11,627, 22%, $7,367, 127%, $18,994, 49% | $34,428, 26%, $24,066, 101%, $58,494, 49%. Table 2 REVENUE, same columns; rows CES: $7,735, 17%, $2,607, 38%, $10,342, 21% | $21,986, 26%, $7,006, 30%, $28,992, 27%. DPT: $1,715, 8%, $1,754, 5%, $3,469, 7% | $5,022, 10%, $5,103, 17%, $10,126, 13%. Eliminations & other: $(89), (24)%, $(437), (11)%, $(526), (13)% | $(269), (37)%, $(1,316), (19)%, $(1,585), (22)%. GE Aerospace total band: $9,361, 15%, $3,924, 24%, $13,285 (footnote a), 18% (footnote a) | $26,739, 23%, $10,794, 25%, $37,533 (footnote a), 23% (footnote a). Table 3 OPERATING PROFIT with columns 3Q’26 / y/y / 3Q’26 YTD / y/y; rows CES: $2,887, 21% | $7,899, 22%. DPT: $475, 8% | $1,329, 14%. Corporate cost and eliminations (footnote b): $(373), 29% | $(966), (9)%. GE Aerospace total band: $2,988, 30% | $8,262, 22%. Highlighted total rows are solid navy bands with white bold figures. Two thin navy vertical rules separate the 3Q’26 and YTD column groups; the Orders table has a vertical rule between its 3Q’26 and YTD halves. Navy horizontal rules sit under each column header row.
Slide 17
Non-GAAP reconciliations
18 Third quarter adjusted revenue, costs, other income, operating profit, net income and EPS
19 Third quarter year-to-date adjusted revenue, costs, other income, operating profit, net income and EPS
20 Third quarter and year-to-date free cash flow
GE Aerospace
17
Visuals: Logo: GE Aerospace logo at top right (about x 83.1%, y 1.9%, w 14.4%, h 9.2%), white monogram circle with the wordmark 'GE Aerospace' in white, placed on the dark navy background. A small green dash (about x 3.5%, y 40.5%, w 3.5%, h 0.4%) in bright green #2ECC40 sits to the left of the title as a decorative marker. No photographs, charts or diagrams.
Slide 18
GE Aerospace / Third quarter adjusted revenue*, costs*, other income*, operating profit*, net income* and EPS* / Less: / Less: / Less: / Less: / Insurance / Separation, / 3Q'26 / Insurance / Separation, / 3Q'25 / and US tax / restructuring Less: Other / Adjusted / and US tax / restructuring Less: Other / Adjusted / (Dollars in millions) / 3Q'26 GAAP / equity / and other / adjustments / (Non-GAAP) / 3Q'25 GAAP / equity / and other / adjustments / (Non-GAAP) / -b) / -b) / Revenues / $ / 14,118 / $ / 833 $ / — $ / — $ / 13,285 / $ / 12,181 / $ / 875 $ / — $ / — $ / 11,305 / Less: Costs and expenses / 11,745 / 1,046 / 78 / (6) / 10,627 / 9,951 / 519 / 75 / 29 / 9,328 / Add: Other income / 432 / (66) / 52 / 117 / 330 / 285 / (48) / — / 11 / 322 / Profit (loss) / $ / 2,805 / $ / (279) $ / (27) $ / 123 $ / 2,988 / $ / 2,515 / $ / 309 $ / (75) $ / (18) $ / 2,299 / Less: Interest and other financial charges / — / 8 / 1 / (231) / 222 / — / 6 / — / (225) / 219 / Less: Provision (benefit) for income taxes / 385 / (96) / (4) / 62 / 423 / 344 / 5 / (16) / 43 / 311 / Less: Dilution / — / — / — / — / — / 5 / — / — / — / 5 / Less: Net income (loss) attributable to / noncontrolling interests / 8 / — / — / 8 / — / (3) / — / — / (3) / — / Net income (loss) -a) / $ / 2,412 / $ / (192) $ / (24) $ / 284 $ / 2,343 / $ / 2,170 / $ / 297 $ / (59) $ / 167 $ / 1,764 / EPS / $ / 2.32 / $ / (0.18) $ / (0.02) $ / 0.27 $ / 2.25 / $ / 2.04 / $ / 0.28 $ / (0.06) $ / 0.16 $ / 1.66 / Net income from cont ops before income / taxes / $ / 2,805 / $ / (287) $ / (27) $ / 346 $ / 2,774 / $ / 2,515 / $ / 303 $ / (75) $ / 210 $ / 2,077 / Less: Provision (benefit) for income taxes / $ / 385 / $ / (96) $ / (4) $ / 62 $ / 423 / $ / 344 / $ / 5 $ / (16) $ / 43 $ / 311 / Effective income tax rate / 13.7 % / 15.2 % / 13.7 % / 15.0 % / 18 / * Non-GAAP Financial Measure / (a – Net income (loss) from continuing operations attributable to common shareholders, diluted / (b – Other adjustments include interest and other financial charges, non-operating benefit cost (income), noncontrolling interest, gains (losses) on retained and sold ownership interests and other equity securities, gains (losses) on purchases / and sales of business interests
Visuals: One table with no chart elements. Columns, left to right: row label column (Dollars in millions); then 3Q'26 GAAP, Less: Insurance and US tax equity, Less: Separation, restructuring and other, Less: Other adjustments (b), 3Q'26 Adjusted (Non-GAAP); then 3Q'25 GAAP, Less: Insurance and US tax equity, Less: Separation, restructuring and other, Less: Other adjustments (b), 3Q'25 Adjusted (Non-GAAP). Rows and values as printed: Revenues: 3Q'26 GAAP $14,118; insurance $833; separation —; other —; adjusted $13,285; 3Q'25 GAAP $12,181; insurance $875; separation —; other —; adjusted $11,305. Less: Costs and expenses: 11,745; 1,046; 78; (6); 10,627; 9,951; 519; 75; 29; 9,328. Add: Other income: 432; (66); 52; 117; 330; 285; (48); —; 11; 322. Profit (loss) (bold, $ signs): 2,805; (279); (27); 123; 2,988; 2,515; 309; (75); (18); 2,299. Less: Interest and other financial charges: —; 8; 1; (231); 222; —; 6; —; (225); 219. Less: Provision (benefit) for income taxes: 385; (96); (4); 62; 423; 344; 5; (16); 43; 311. Less: Dilution: —; —; —; —; —; 5; —; —; —; 5. Less: Net income (loss) attributable to noncontrolling interests: 8; —; —; 8; —; (3); —; —; (3); —. Net income (loss) -a) (bold): 2,412; (192); (24); 284; 2,343; 2,170; 297; (59); 167; 1,764. EPS (bold, double rule below): 2.32; (0.18); (0.02); 0.27; 2.25; 2.04; 0.28; (0.06); 0.16; 1.66. Net income from cont ops before income taxes: 2,805; (287); (27); 346; 2,774; 2,515; 303; (75); 210; 2,077. Less: Provision (benefit) for income taxes: 385; (96); (4); 62; 423; 344; 5; (16); 43; 311. Effective income tax rate (bold, double rule below): 13.7 % under 3Q'26 GAAP; 15.2 % under 3Q'26 Adjusted; 13.7 % under 3Q'25 GAAP; 15.0 % under 3Q'25 Adjusted. Rules: thin dark navy horizontal rules under the header row, above and below the Profit (loss) row, above and below Net income (loss), and double rules under EPS and under Effective income tax rate; the rules span each block. Logo: GE monogram roundel with the text GE Aerospace, navy, top right.
Slide 19
Third quarter year-to-date adjusted revenue*, costs*, other income*, operating profit*, net income* and EPS*
GE Aerospace
(Dollars in millions)
3Q'26 YTD GAAP
Less: Insurance and US tax equity
Less: Separation, restructuring and other
Less: Other adjustments -b)
3Q'26 YTD Adjusted (Non-GAAP)
3Q'25 YTD GAAP
Less: Insurance and US tax equity
Less: Separation, restructuring and other
Less: Other adjustments -b)
3Q'25 YTD Adjusted (Non-GAAP)
Revenues $ 39,859 $ 2,326 $ — $ — $ 37,533 $ 33,138 $ 2,681 $ — $ — $ 30,457
Less: Costs and expenses 32,784 2,246 218 81 30,238 26,874 1,982 199 12 24,681
Add: Other income 730 (187) 52 (103) 968 885 (142) — 21 1,007
Profit (loss) $ 7,804 $ (107) $ (167) $ (184) $ 8,262 $ 7,149 $ 557 $ (199) $ 8 $ 6,783
Less: Interest and other financial charges — 19 2 (675) 655 — 18 — (593) 575
Less: Provision (benefit) for income taxes 1,044 (193) (34) 85 1,185 1,015 (127) (41) 123 1,061
Less: Dilution — — — — — 6 — — — 6
Less: Net income (loss) attributable to noncontrolling interests 11 — — 11 — (16) — — (16) —
Net income (loss) -a) $ 6,750 $ 67 $ (135) $ 395 $ 6,423 $ 6,143 $ 666 $ (158) $ 494 $ 5,141
EPS $ 6.44 $ 0.06 $ (0.13) $ 0.38 $ 6.13 $ 5.73 $ 0.62 $ (0.15) $ 0.46 $ 4.80
Net income from cont ops before income taxes $ 7,804 $ (126) $ (169) $ 480 $ 7,619 $ 7,149 $ 539 $ (199) $ 617 $ 6,192
Less: Provision (benefit) for income taxes $ 1,044 $ (193) $ (34) $ 85 $ 1,185 $ 1,015 $ (127) $ (41) $ 123 $ 1,061
Effective income tax rate 13.4 % 15.6 % 14.2 % 17.1 %
* Non-GAAP Financial Measure
(a – Net income (loss) from continuing operations attributable to common shareholders, diluted
(b – Other adjustments include interest and other financial charges, non-operating benefit cost (income), noncontrolling interest, gains (losses) on retained and sold ownership interests and other equity securities, gains (losses) on purchases
and sales of business interests
19
Visuals: Logo: the GE Aerospace logo at top-right, a dark navy circular GE monogram with the wordmark GE Aerospace in navy beside it, placed in a 320 by 114 pixel image. Table: a financial table with eleven columns and rows as listed in the text. Columns: row label (Dollars in millions); 3Q'26 YTD GAAP; Less: Insurance and US tax equity; Less: Separation, restructuring and other; Less: Other adjustments (b); 3Q'26 YTD Adjusted (Non-GAAP); 3Q'25 YTD GAAP; Less: Insurance and US tax equity; Less: Separation, restructuring and other; Less: Other adjustments (b); 3Q'25 YTD Adjusted (Non-GAAP). Rows and values: Revenues $39,859 / $2,326 / — / — / $37,533 / $33,138 / $2,681 / — / — / $30,457. Less: Costs and expenses 32,784 / 2,246 / 218 / 81 / 30,238 / 26,874 / 1,982 / 199 / 12 / 24,681. Add: Other income 730 / (187) / 52 / (103) / 968 / 885 / (142) / — / 21 / 1,007. Profit (loss) $7,804 / $(107) / $(167) / $(184) / $8,262 / $7,149 / $557 / $(199) / $8 / $6,783. Less: Interest and other financial charges — / 19 / 2 / (675) / 655 / — / 18 / — / (593) / 575. Less: Provision (benefit) for income taxes 1,044 / (193) / (34) / 85 / 1,185 / 1,015 / (127) / (41) / 123 / 1,061. Less: Dilution — / — / — / — / — / 6 / — / — / — / 6. Less: Net income (loss) attributable to noncontrolling interests 11 / — / — / 11 / — / (16) / — / — / (16) / —. Net income (loss) (a) $6,750 / $67 / $(135) / $395 / $6,423 / $6,143 / $666 / $(158) / $494 / $5,141. EPS $6.44 / $0.06 / $(0.13) / $0.38 / $6.13 / $5.73 / $0.62 / $(0.15) / $0.46 / $4.80. Net income from cont ops before income taxes $7,804 / $(126) / $(169) / $480 / $7,619 / $7,149 / $539 / $(199) / $617 / $6,192. Less: Provision (benefit) for income taxes $1,044 / $(193) / $(34) / $85 / $1,185 / $1,015 / $(127) / $(41) / $123 / $1,061. Effective income tax rate: 13.4% (3Q'26 GAAP), 15.6% (3Q'26 Adjusted), 14.2% (3Q'25 GAAP), 17.1% (3Q'25 Adjusted). Two bold rules sit above the net income and EPS rows, and a double rule closes the table. Rules are navy, about 0.1% of slide height thick.
Slide 20
Third quarter and year-to-date free cash flow*
(Dollars in millions)
3Q'26
3Q'25
V%
3Q'26 YTD
3Q'25 YTD
V%
Net income (loss) (GAAP) -a)
$ 2,420 $ 2,171 11 % $ 6,761 $ 6,133 10 %
Depreciation & amortization -b)
336
302
960
913
Operating working capital
(1,538)
(441)
(1,840)
(910)
Current receivables
(1,657)
(113)
(2,351)
(1,270)
Inventories, including deferred inventory costs
(322)
(392)
(965)
(1,787)
Current contract assets
(54)
(51)
(22)
(116)
Contract liabilities and current deferred income
183
209
48
593
Progress collections
254
(97)
535
173
Accounts payable
59
3
916
1,498
Sales discounts and allowances
608
107
1,564
554
Other CFOA -c)
377
416
(116)
(244)
Cash flows from operating activities (CFOA) (GAAP)
$ 2,203 $ 2,556 (14)% $ 7,329 $ 6,447 14 %
Add: gross additions to property, plant and equipment and internal-use software
(337)
(307)
(1,002)
(842)
Add: dispositions of property, plant and equipment
122
51
179
76
Less: separation cash expenditures
(27)
(56)
(143)
(202)
Less: Corporate & Other restructuring cash expenditures
(27)
(6)
(79)
(51)
Free cash flow (FCF) (Non-GAAP)
$ 2,042 $ 2,362 (14)% $ 6,728 $ 5,933 13 %
Free cash flow (Non-GAAP) conversion % -d)
87 %
134 %
105 %
115 %
GE Aerospace
20
* Non-GAAP Financial Measure
(a – Net income (loss) from continuing operations
(b – Depreciation and amortization of property, plant & equipment and amortization of intangible assets
(c – Includes the following: (Gains) losses on retained and sold ownership interests and other equity securities, employee benefit liabilities, income taxes (net), goodwill impairments and all other operating; includes separation cash expenditures
and Corporate restructuring cash expenditures
(d – FCF* conversion: FCF* / adjusted net income*
Visuals: Table: columns are row label, dollar sign, 3Q'26, 3Q'25, V%, 3Q'26 YTD, 3Q'25 YTD and V%. Rows, with values as printed: Net income (loss) (GAAP) -a): $ 2,420 | $ 2,171 | 11 % $ | 6,761 | $ 6,133 | 10 %. Depreciation & amortization -b): 336 | 302 | blank | 960 | 913 | blank. Operating working capital: (1,538) | (441) | blank | (1,840) | (910) | blank. Current receivables (indented): (1,657) | (113) | blank | (2,351) | (1,270). Inventories, including deferred inventory costs (indented): (322) | (392) | blank | (965) | (1,787). Current contract assets (indented): (54) | (51) | blank | (22) | (116). Contract liabilities and current deferred income (indented): 183 | 209 | blank | 48 | 593. Progress collections (indented): 254 | (97) | blank | 535 | 173. Accounts payable (indented): 59 | 3 | blank | 916 | 1,498. Sales discounts and allowances: 608 | 107 | blank | 1,564 | 554. Other CFOA -c): 377 | 416 | blank | (116) | (244). Cash flows from operating activities (CFOA) (GAAP), bold: $ 2,203 | $ 2,556 | (14)% $ | 7,329 | $ 6,447 | 14 %. Add: gross additions to property, plant and equipment and internal-use software (indented): (337) | (307) | blank | (1,002) | (842). Add: dispositions of property, plant and equipment (indented): 122 | 51 | blank | 179 | 76. Less: separation cash expenditures (indented): (27) | (56) | blank | (143) | (202). Less: Corporate & Other restructuring cash expenditures (indented): (27) | (6) | blank | (79) | (51). Free cash flow (FCF) (Non-GAAP), bold: $ 2,042 | $ 2,362 | (14)% $ | 6,728 | $ 5,933 | 13 %. Free cash flow (Non-GAAP) conversion % -d), bold italic values: 87 % | 134 % | blank | 105 % | 115 % | blank. Horizontal black rules are drawn under the header row, above the CFOA row, above the FCF row and below the FCF conversion row, spanning the table width. No charts, photographs or diagrams. Logo: GE Aerospace logo at top-right, a navy circular monogram with the letters GE in a script style, followed by the wordmark 'GE Aerospace' in navy sans-serif.
Slide 21
Upcoming calendar
4Q'26 Earnings / January 21, 2027
1Q'27 Earnings / April 20, 2027
2Q'27 Earnings / July 15, 2027
3Q'27 Earnings / October 19, 2027
21
Visuals: A short green dash (about #22C55E, roughly 3% of slide width, thin stroke) sits to the left of the title at the title's baseline height. The GE Aerospace logo at top right: a white circular monogram of the GE mark (interlocking G and E letters inside a ring) followed by the white wordmark 'GE Aerospace' in a condensed sans-serif. No photographs, charts or tables.
Download this deck
The hosted PDF of every library deck is free for readers of the SlideDeck Co newsletter. Join with your email and the viewer and download appear here.
Preparing a results presentation or business update of your own? The SlideDeck Co Standard Deck is a slide library for business reviews, updates and plans.







