
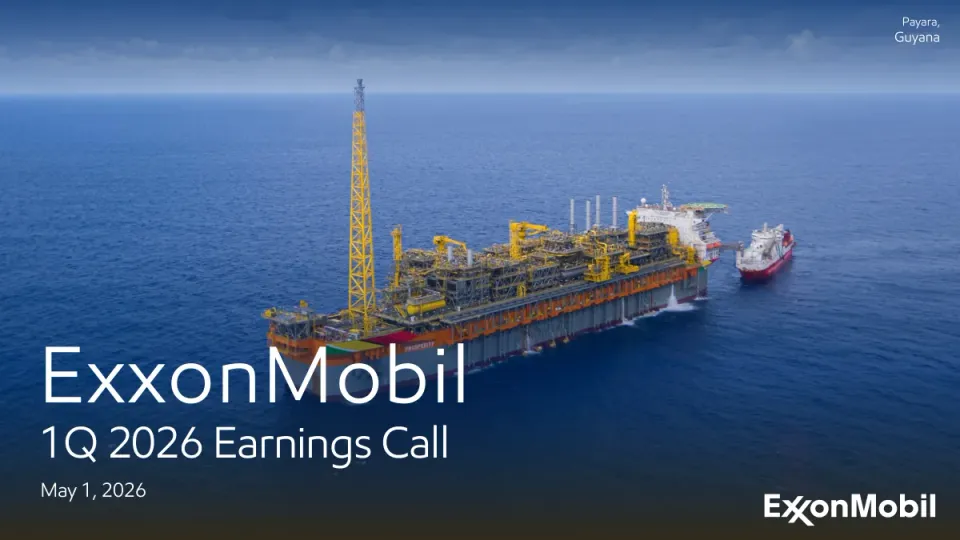
The deck opens with a title slide for the 1Q 2026 earnings call, held May 1, 2026, followed by a cautionary statement on forward-looking information. It then sets out the quarter's headline results under three pillars (scale and integration, execution excellence, differentiated results) and reviews corporate capacity, including cash capex, net debt-to-capital, shareholder distributions and structural cost savings. Market conditions come next, covering supply disruptions and feedstock costs, followed by quarter-on-quarter and year-on-year earnings bridges for the corporation and each segment (Upstream, Energy Products, Chemical Products, Specialty Products). Further sections cover cash flow, the outlook for 2Q26, shareholder value, Middle East impacts, the 2030 plan, and a sensitivities and key assumptions table. Appendix slides hold the supplemental definitions and non-GAAP reconciliations. The deck closes with a Q&A slide and a note on the annual shareholder meeting. Slides worth studying include the three-column results summary on slide 3, the waterfall bridges on slides 6 and 14, and the quarter-over-quarter cash flow chart on slide 7.
Slides worth studying
- Slide 3: Three columns with short headings and one-line proof points make the quarter's story scannable in a single view.
- Slide 6: The waterfall bridge separates identified items and estimated timing effects into their own bars, so the reader can follow the walk from GAAP to adjusted earnings.
- Slide 7: A cash waterfall paired with a short callout column keeps the chart and its interpretation side by side.
- Slide 12: Three panels each carry one message with a stacked or paired chart beneath, linking the 2030 plan to a single headline per segment.
Details
- Company: ExxonMobil
- Year: 2026
- Type: Investor presentation
- Industry: Oil and gas
- Pages: 45
The hosted copy of this deck is being prepared. Newsletter readers will find the download here.
Review score: 8 out of 10, Strong
Presentation quality, judged with the SlideDeck Co review heuristic. Ask, evidence and idea merit are not rated here.
The strength is how plainly the deck isolates exceptions and signposts each page. A kicker above every title states the comparison and segment, for example "1Q26 versus 1Q25: Corporate" on slide 6, and a fixed right-hand panel gives three or four takeaways. Slide 6 shows $7,713 moving to $8,772 before a separate (3,880) timing bar and a final bar split into $4,183 GAAP and 706 of identified items, with "Includes ($430M) Middle East volume impact" bracketed on the chart; slide 11 explains those impacts in prose and slide 8, "LOOKING AHEAD TO 2Q26", keeps the outlook apart. Slide 27 adds earnings sensitivities and key assumptions. The bottleneck is that one headline, "Growing advantaged volumes and driving structural cost savings to increase earnings", is reused on slides 6 and 13 to 23, including slide 17 where Energy Products ends at ($556), so titles stop telling pages apart. The eleven-column bridges also crowd their axis labels, and on slide 17 the footnote runs into them.
Worth keeping: Keep the comparison kicker above each title and the practice of drawing timing effects and identified items as their own bars.
Most useful repair: Give slides 13 to 23 titles that state each segment's own change, and widen or simplify the axis labels on slides 13, 17 and 21 so the footnote clears them.
What would change the score: If the repeated headline is read as a deliberate section label with the kicker doing the navigation, that weakness shrinks, though the crowded bridge labels would still keep this short of 9.
Confidence high. 45 of 45 pages inspected on contact sheets, 12 at readable size. Reviewed 2026-11-15. Model-assisted review (claude-fable-5-2, in session).
Full text of the slides (45 slides)
Every slide's words and a description of its charts and images, so the deck can be searched and rebuilt. Also available as Markdown.
Slide 1
Payara,
Guyana
ExxonMobil
1Q 2026 Earnings Call
May 1, 2026
PROSPERITY
ExxonMobil
1
Visuals: Full-bleed aerial photograph of the offshore FPSO Prosperity moored in the Guyana Stabroek block. The vessel runs diagonally from lower left to upper right, seen in three-quarter aerial view from the stern-quarter. A tall yellow lattice flare tower stands at its left end, with yellow and grey process modules, pipework, cranes and stacks across its deck and a white superstructure with a green helipad at the right end. Its orange and grey hull is visible below the deck, with the word PROSPERITY painted in white on the grey hull near the centre-left. Multicoloured green, yellow and red container-like panels are at the lower left of the hull. A red-hulled, white-superstructure supply vessel sits alongside its right end with a connecting bridge. The sea is deep blue with fine wave texture, and the sky is pale hazy blue with soft clouds fading to a white horizon band at about 16% of the slide height. Lighting is soft daylight from above and the scene is in full colour with dominant blues, yellow, orange and white. A dark navy-to-black gradient overlay covers the lower portion of the photograph from about 55% of the height down to the bottom edge, darkening the sea behind the title. The photograph is not boxed, cropped to fill the frame, and has no border.
Slide 2
Cautionary statement
FORWARD-LOOKING STATEMENTS. Statements of future events, conditions, expectations, plans, performance, earnings power, earnings growth, potential addressable markets, opportunities,
ambitions, or results in this presentation or the subsequent discussion period are forward-looking statements. Similarly, discussions of future carbon capture, transportation, and storage, as well as lower-
emission fuels, hydrogen and ammonia, lithium, direct air capture, ProxximaTM systems, carbon materials, low-carbon data centers, and other low carbon and new business plans to reduce emissions and
emission intensity of ExxonMobil, its affiliates, or third parties are dependent on future market factors, such as continued technological progress, stable policy support, and timely rulemaking and permitting,
and represent forward-looking statements. Actual future results, including financial and operating performance; potential earnings, cash flow, dividends or shareholder returns, including the timing and
amount of share repurchases; total cash capital expenditures and mix, including allocations of capital to low carbon and other new investments; realization and maintenance of structural cost reductions
and efficiency gains, including the ability to offset inflationary pressures; plans to reduce future emissions and emissions intensity; ambitions to reach Scope 1 and Scope 2 net zero from operated assets by
2050, to reach Scope 1 and 2 net zero in integrated Upstream Permian Basin unconventional operated assets by 2035, to eliminate routine flaring in line with World Bank Zero Routine Flaring, to reach
near-zero methane emissions from operated assets and other methane initiatives, and to meet ExxonMobil’s emission reduction plans and goals, divestment and start-up plans, and associated project plans
as well as technology advances, including in the timing and outcome of projects to capture, transport and store CO2, produce hydrogen and ammonia, produce lower-emission fuels, produce lithium,
produce ProxximaTM systems, produce carbon materials, and use plastic waste as feedstock for advanced recycling; future debt levels and credit ratings; maintenance and turnaround activity; drilling and
improvement programs; price and margin recovery; planned Pioneer and Denbury integration benefits; resource recoveries and production rates; and product sales levels and mix could differ materially due
to a number of factors. These include global or regional changes or imbalances in oil, gas, petrochemicals, or feedstock prices, differentials, margins, volume/mix, seasonal fluctuations, or other market or
economic conditions affecting the oil, gas, and petrochemical industries and the demand for our products; new or changing government policies supporting lower carbon and new market investment
opportunities or policies limiting the attractiveness of investments such as European taxes on energy and unequal support for different methods of emissions reduction; consumer preferences including for
emission-reduction products and technology; uncertain impacts of deregulation on the legal and regulatory environment; changes in interest and exchange rates; variable impacts of trading activities and
derivative positions, including timing effects, on our margins and results each quarter; the outcome of competitive bidding and project awards; regulatory actions in any part of the world targeting public
companies in the oil and gas industry; developments or changes in local, national, or international laws, regulations, and policies affecting our business, including extraterritorial environmental and tax
regulations, trade tariffs, and trade sanctions; timely granting of governmental permits, licenses, and certifications; adoption of regulatory incentives consistent with law; the ability to realize efficiencies
within and across our business lines and to maintain current cost reductions as efficiencies without impairing our competitive positioning; reservoir performance and optimization, including variability and
timing factors applicable to unconventional projects and the success of new unconventional technologies, and the ability of new technologies to improve recovery relative to competitors; the level,
outcome, and timing of exploration and development projects and decisions to invest in future reserves and resources; timely completion of construction projects, and commencement of start-up
operations, including reliance on third-party suppliers and service providers; government actions in pursuit of national energy and security policies or priorities affecting our business; escalating geopolitical
volatility, including regime changes; war, civil unrest, attacks against the company or industry, disruption, realignment or breaking of current or historical trade or military alliances or global trade and supply
chain networks, and other political or security disturbances; expropriations, seizures, and capacity, insurance, export, import, or shipping limitations imposed directly or indirectly by governments or laws or
international embargoes; the outcome of commercial negotiations, including final agreed terms and conditions; opportunities for and regulatory approval of investments or divestments; the outcome of
other energy companies’ research efforts and the ability to bring new technology to commercial scale on a cost-competitive basis; the development and competitiveness of alternative energy and emission
reduction technologies; unforeseen technical or operating difficulties or disruptions, including the need for unplanned maintenance; and other factors discussed here and in Item 1A. Risk Factors of our
Form 10-K and also under the sub-heading “Factors Affecting Future Results” found in the “Earnings” section of the “Investors” page of our website at www.exxonmobil.com. All forward-looking
statements are based on management’s knowledge and reasonable expectations at the time of this presentation, and we assume no duty to update these statements as of any future date. Neither future
distribution of this material nor the continued availability of this material in archive form on our website should be deemed to constitute an update or re-affirmation of these figures as of any future date.
Any future update of these figures will be provided only through a public disclosure indicating that fact.
Reconciliations and definitions of factors, non-GAA and other terms are provided in the text or in the supplemental information accompanying these pages beginning on page 28.
2
Visuals: None apart from the ExxonMobil logo in the bottom-right corner: a white ExxonMobil wordmark followed by a thin vertical cyan-blue bar and the page number. The background is a blue textured/abstract image (not a photograph of a subject), brighter cobalt at the top-left fading to deep navy toward the bottom-right, with no overlay beyond the image itself.
Slide 3
Executing proven strategy to navigate unprecedented
volatility and deliver leading shareholder value
Scale and Integration
Execution excellence
Differentiated results
+
=
Leveraged world-scale supply chain
capabilities to optimize largest and most
diverse global portfolio to support
customers in more than 180 countries
Achieved industry-leading reliability
and record production in Guyana2
Generated cash flow
from operations of $8.7B;
$13.8B excluding margin postings3
Increased production of high-value
liquids and LNG, offsetting impact
of Middle East disruptions1
Expanded LNG footprint by bringing
Train 1 at Golden Pass online,
increasing U.S. exports by 5%
Realized GAAP earnings of $4.2B;
$8.8B excluding identified items and
estimated timing effects3
Maximized value from unmatched
integration of advantaged Permian and
U.S. Gulf Coast manufacturing assets
Reached highest first-quarter
utilization in more than a decade at
U.S. Gulf Coast refineries
Delivered first-quarter
total shareholder return of 42%
See supplemental information for footnotes, definitions, and reconciliations.
ExxonMobil
3
Visuals: Non-text visuals: (1) a dark navy textured band behind the title covering the top of the slide, about 0 to 19.3% height, full width; (2) three rectangular column header boxes with gradients, left royal blue (about #0C47C8 fading to #0A3DA8), centre deep teal (about #0B6A9A fading to #08507A), right bright cyan (about #1BB8EE fading to #0C9ED6); (3) three light grey panels #F2F2F2 behind the body text; (4) thin blue horizontal divider rules (about #0C479D, roughly 0.2% height, about 22% width) separating the bullet groups in each column, at about 55.6% and 72.9% height; (5) a blue plus sign (+) between columns 1 and 2 and a blue equals sign (=) between columns 2 and 3, both about 8% height; (6) the red ExxonMobil wordmark logo at bottom right (about #E10A0A red) with a thin vertical blue bar (about #0C479D) to its right.
Slide 4
Corporate / Leveraging competitive advantages to grow earnings capacity / and long-term shareholder value / Cash capex / $6.2 B / Full-year cash capex plan of $27B-$29B / Net debt-to-capital / 13 % / Net debt-to-EBITDA ratio of 0.4x1; / industry-leading balance sheet capacity2 / Shareholder distributions / $9.2 B / Including $4.9B of share buybacks / Structural cost savings since 2019 / $15.6 B / More than all other IOCs combined3 / Permian production / 1.7 Moebd / Added 250 Koebd versus 1Q25 / CO2 capture per year4 / 10 MTA / Delivering above-average portfolio returns / See supplemental information for footnotes, definitions, and reconciliations. / ExxonMobil / 4
Visuals: Six dark blue textured tile panels, each a photographic/illustrated blue fabric-like texture, arranged in a 3x2 grid, full-bleed to the grid area with no borders or rounded corners. Top row: left tile (Cash capex), centre tile (Net debt-to-capital), right tile (Shareholder distributions). Bottom row: left tile (Structural cost savings since 2019), centre tile (Permian production), right tile (CO2 capture per year). Tints run from brighter blue #0B3C8C at top to deeper navy #001F5C at bottom. No photographs of people or objects; no charts. Small ExxonMobil wordmark logo in bottom-right: red #E31E24 'Exxon' 'Mobil' wordmark with a vertical blue divider line #0054A6 before the page number.
Slide 5
Macro
Market heavily impacted by supply
disruptions and higher feedstock costs
Industry prices / margins
10-year annual range1
Crude prices2 ($/bbl)
Natural gas prices3 ($/mbtu)
Refining margins4 ($/bbl)
Chemical margins5 ($/tonne)
1Q25
4Q25
March '26
1Q26
10-year annual range (2010-2019)
See supplemental information for footnotes.
Crude prices posted
largest-ever monthly gain6
Global crude supply
decreased by ~10%6
Global LNG supply
reduced by ~20%7
Asia Pacific refining runs
lower by ~10%6
Feed shortages impacted
Asia Pacific chemical plant
rates by up to 30%6
ExxonMobil
5
Visuals: Chart: dot-and-box range chart titled 'Industry prices / margins' with subtitle '10-year annual range' (footnote 1). Four categories along the horizontal axis, each with a grey rectangle showing the 10-year annual range (2010-2019): Crude prices ($/bbl), Natural gas prices ($/mbtu), Refining margins ($/bbl), Chemical margins ($/tonne). The vertical axis is a thin grey line with no tick labels, no units and no printed numeric range, so values are not printed; positions are relative only. Series markers: 1Q25 black diamond, 4Q25 red circle, March '26 green diamond, 1Q26 blue circle. Crude prices: green diamond about mid-range, blue circle and black diamond just below it, red circle lowest, all within the grey box. Natural gas prices: blue circle and black diamond above the box (black slightly higher, about 43% of slide height), red circle and green diamond at the box's upper area (about 47-48%). Refining margins: green diamond far above the box (about 30% of slide height), blue circle and red circle just above the box top (about 45%), black diamond below the box bottom (about 56%). Chemical margins: black diamond about 63%, red circle about 64%, blue circle about 65%, all above the empty grey box, and green diamond far below at about 72%. Legend centred below the chart: black diamond 1Q25, red circle 4Q25, green diamond March '26, blue circle 1Q26, grey square 10-year annual range (2010-2019). No highlighted points beyond the colour coding. Right panel: text only, no chart. Logo: ExxonMobil wordmark in white at bottom right.
Slide 6
1Q26 versus 1Q25: Corporate / Growing advantaged volumes and driving / structural cost savings to increase earnings / Corporate year-over-year earnings / Million USD / $7,713 / 1,700 / 840 / (560) / 430 / (940) / (290) / (130) / $8,772 / (3,880) / Excluding identified items (Non-GAAP) / $4,889 / 706 / Identified items / $4,183 / Includes ($430M) / Middle East / volume impact / 1Q25 GAAP / Price / margin / Advantaged volume growth / Base volume / Structural cost savings / Expenses / Other / Absence of 1Q25 estimated timing effects / Earnings excluding identified items and estimated timing effects / 1Q26 estimated timing effects / 1Q26 GAAP / Volume / mix / Due to rounding, numbers may not add. / Identified items in 1Q26 include ($706M) Other Middle East impacts. / See page 14 and supplemental information for definitions and reconciliations. / Advantaged volumes growth partly offset by Middle East volume impacts / Base volume decreased from divestments and operational disruptions in Kazakhstan / Structural cost savings offset by expenses from advantaged investments / Estimated timing effects include fair value impacts on open derivative positions / ExxonMobil / 6
Visuals: Waterfall chart, titled Corporate year-over-year earnings, with unit label Million USD; no printed axis, no axis scale, baseline drawn at the bottom of the bars. Series, left to right, with printed values: 1Q25 GAAP $7,713 (blue total bar); Price / margin +1,700 (green); Advantaged volume growth +840 (green); Base volume (560) (red); Structural cost savings +430 (green); Expenses (940) (red); Other (290) (red); Absence of 1Q25 estimated timing effects (130) (red); Earnings excluding identified items and estimated timing effects $8,772 (blue total); 1Q26 estimated timing effects (3,880) (red); 1Q26 GAAP split into $4,183 (blue, bottom) and 706 (grey Identified items segment on top) totalling $4,889 Excluding identified items (Non-GAAP) shown as a label above the grey segment. Brace over Advantaged volume growth and Base volume labelled Volume / mix; brace over the +840 and (560) bars annotated Includes ($430M) Middle East volume impact. Legend: none. Highlighted points: none beyond colour coding (green increases, red decreases, blue totals, grey identified items). Right panel is a photograph-like dark blue textured background with no people or objects.
Slide 7
1Q26 versus YE’25: Cash
Advantaged portfolio generating
strong cash flow from operations
Cash flow
Billion USD
$8.7 billion CFO;
$11.2 billion CFO excluding working capital/other
$ 10.7
13.8
(5.1)
0.2
(6.2)
(9.2)
4.2
$ 8.4
YE'25 cash
CFO excluding margin postings
Margin postings
Asset sales
Cash capex1
Shareholder distributions
Debt / other
1Q26 cash
Excluding margin postings,
cash flow from operations
higher than average of
last 12 quarters
Cash capex of $6.2B
in line with full-year plan
Maintaining industry-leading
shareholder distributions2
Industry-leading financial
capacity supports capital
allocation priorities across
market conditions3
Margin postings refer to cash collateral posted in support of derivative positions on regulated futures exchanges like ICE and CME.
See supplemental information for footnotes, definitions, and reconciliations.
7
ExxonMobil
Visuals: Chart: vertical waterfall (bridge) chart titled 'Cash flow', units Billion USD, with no printed y-axis scale or gridlines; every bar carries its printed value. Categories left to right: YE'25 cash $ 10.7 (total bar, blue #0C479D, value label above); CFO excluding margin postings 13.8 (increase, green #00A14D, label inside bar in white); Margin postings (5.1) (decrease, grey #C0C0C0, label inside bar in dark grey); Asset sales 0.2 (increase, thin green #00A14D bar about 0.4% of slide height, label above); Cash capex(6.2) (decrease, grey #C0C0C0, label inside); Shareholder distributions (9.2) (decrease, grey #C0C0C0, label inside); Debt / other 4.2 (increase, green #00A14D, label inside in white); 1Q26 cash $ 8.4 (total bar, blue #0C479D, value label above). A bracket above the second to fourth bars (about x 11.3 to 25.7%, y 34.9 to 37.4%) spans CFO and margin postings and is annotated '$8.7 billion CFO;' with '$11.2 billion CFO excluding working capital/other' beneath. Floating bars are connected to the baseline by implied steps; baseline is a dark grey horizontal axis line at about y 76.9%, x 3.2 to 64.4%. No legend. No highlighted points beyond the colour coding of increases and decreases. The file reports bar widths of about 5.1% of slide width; the reported width of 58.5 for the first blue bar is inconsistent with the image and is taken as 5.1. Bar boxes from the image: YE'25 blue x 4.5 y 60.5 w 5.1 h 16.4; CFO green x 12.1 y 39.3 w 5.1 h 21.2; Margin grey x 19.7 y 39.3 w 5.1 h 7.9; Asset green line x 27.3 y 46.8 w 5.1 h 0.4; Capex grey about x 35.0 y 46.8 w 5.0 h 9.5; Shareholder grey about x 42.6 y 56.3 w 5.0 h 14.1; Debt green about x 50.3 y 63.9 w 5.0 h 6.5; 1Q26 blue about x 57.8 y 63.9 w 5.1 h 12.9. Photograph/illustration: the right panel is a full-height image 889 by 1499 pixels, a dark navy to royal blue gradient with a faint diagonal texture, no subject, unboxed, not cropped, with no overlay other than its own gradient, dominant colours navy #0A1F4D at top shading to blue #0C479D at bottom. Logo: ExxonMobil corporate wordmark in white with a stylised X-shaped 'x' glyph, bottom right; a short vertical light blue rule #00A3E0 separates it from the page number.
Slide 8
LOOKING AHEAD TO 2Q26 / Upstream / Product Solutions / Corporate / Strait of Hormuz closure for the entire / quarter would reduce Middle East / production by ~750 Koebd versus 2025 / Non-Middle East impacts, including / downtime, expected to increase / production by ~150 Koebd versus 1Q26 / Scheduled maintenance expected / to be in line with 1Q26 / Strait of Hormuz closure for the entire / quarter expected to lower global / Product Solutions throughput by 3% / versus 4Q25 / Corporate and financing expenses / expected to be $700M - $900M / Seasonal cash tax payments / expected to be $1.5B - $2.5B / working capital outflow / See page 24 for 2Q26 maintenance outlook. / ExxonMobil / 8
Visuals: Three header tiles behind the column titles: Upstream tile is a blue gradient (dark blue to royal blue), Product Solutions tile is a teal-blue gradient, Corporate tile is a bright cyan gradient. Each column body has a light grey panel with a thin blue horizontal divider line separating two centred text blocks. Logo: ExxonMobil wordmark in red at bottom right. No photographs or charts.
Slide 9
PNG LNG Project, / Papua New Guinea
Delivering industry-leading shareholder value
Applying competitive advantages to / unmatched portfolio
Leading cost discipline and / execution excellence
Delivering profitable growth to / support industry-leading total / shareholder returns
On track to bring the 5th Guyana FPSO / online in late 2026; adding 250 Kbd gross
Mechanical completion of / Golden Pass Train 2 planned in 4Q26
Continuing to drive additional structural / cost savings; on track to achieve / $20B by 2030 versus 2019
On path to grow Permian production / to 1.8 Moebd in 2026
One-year total shareholder / return of 48%
Share buybacks on pace / for $20B in 2026
ExxonMobil led IOCs in total shareholder return for 1Q26 and on a rolling 2, 4, 5, 6, 7, 8, and 9-year basis as of March 31, 2026, sourced from FactSet. / See supplemental information for definitions and reconciliations.
9
ExxonMobil
Visuals: Photograph, full-bleed: a large LNG carrier moored alongside an offshore loading jetty at the PNG LNG project. The black-hulled vessel with a red lower hull and a red-capped funnel sits in the centre-left, its white superstructure and deck processing equipment (pipes, towers, flare-like stacks) in the middle. A long grey steel conveyor/pipe trestle with railings runs diagonally from bottom-left up to the ship's midships area, and a second jetty arm extends to the right. Sea is dark grey-blue, the sky overcast grey-blue with a lighter horizon band. Lighting is flat overcast daylight. Dominant colours are black, white, grey-blue and red accents. Composition is a wide horizontal frame with the ship across the upper-middle and the trestle leading the eye to the lower-left. The image is uncropped and fills the slide. A dark gradient overlay darkens the top and bottom edges to support the white text. Three header boxes are rendered as gradient panels (see elements). Three white panels with 90% opacity hold the body text and sit over the photo. A thin blue rule divides each panel between the top and bottom text groups.
Slide 10
Baton Rouge Manufacturing Complex,
Louisiana
Q&A
Annual Shareholder Meeting on May 27
ExxonMobil
10
Visuals: Photograph of an industrial petrochemical plant at dusk, shot wide-angle from ground level across an empty concrete yard. Structures include a tall lattice tower with a lit platform at top centre, a horizontal cylindrical vessel on a steel frame at centre-left, a long pipe rack with steel trusses running across the right side, and a flare-like stack at far right. Pipes, ladders and handrails are lit with warm yellow and white lights. Yellow-and-black bollards line the concrete in the foreground. The sky is blue-violet fading to pink and orange near the horizon on the right. Composition is wide with the plant spanning the frame horizontally and the lower third given to concrete. The image is full-bleed, not cropped to a box. A dark grey translucent overlay (about 55% opacity, #3A3A3A) darkens the lower part of the photograph behind the title and subtitle, so the lower third reads as a gradient from transparent at about 45% height to dark grey at the bottom edge. Dominant colours are slate blue, violet, warm yellow and concrete grey.
Slide 11
First-quarter 2026 Middle East impacts
Ras Laffan,
Qatar
Upstream
Middle East assets represent roughly 20% of our global oil-equivalent production; first-
quarter production impact of approximately 5% compared with fourth quarter 2025¹.
In Qatar, attacks in the first quarter impacted two LNG trains in which ExxonMobil has
ownership interest. These assets accounted for approximately 3% of 2025
Upstream production.
Product Solutions
Middle East assets represent approximately 5% of our global refining and chemical
capacity.
Middle East disruptions and reduced crude availability at Asia Pacific operations
lowered global Energy Products throughput by approximately 1% in first quarter
compared with fourth quarter 2025.
Identified Item
Supply disruptions in the Middle East prevented the physical shipment associated with
several hedges in the first quarter. The resulting earnings impact of $706 million is
reflected within Identified Items.
See supplemental information for footnotes and definitions.
11
Visuals: One photograph, full-height and cropped to the left panel (x 0 to 32.1%, y 13.4 to 100%), not boxed and with no rounded corners. Subject: an industrial gas-processing site at Ras Laffan, Qatar, showing tall grey-blue cylindrical vessels and tanks with steel walkways, railings and caged ladders painted yellow, plus pipework and structural steel at the top and bottom edges. Composition: vertical, shot at ground level looking up slightly, with vessels filling most of the frame and a diffuse overcast light. Lighting is soft, even daylight with light highlights on the tank shoulders. Dominant colours are slate blue-grey #5E6B7A, pale grey #C9CED4 and safety yellow #E2B40F. The photo has a slight dark tint at the top-left, with the caption Ras Laffan, Qatar set in white over it. No charts, tables or diagrams. Logo: one ExxonMobil corporate logo, bottom right.
Slide 12
Corporate
On track to deliver 2030 plan: expect ~$25B earnings growth
and ~$35B cash flow growth from 2024-2030
Upstream
Advantaged assets underpin improved unit profitability
Upstream production (Moebd)1
~5.5
~65%
4.6
61%
4.3
52%
2024
2026
YTD
2030
Plan
Advantaged assets
Base
>$15/bbl unit earnings by 2030,
underpinned by advantaged assets3
Product Solutions
Advantaged projects drive high-value product growth
~5.7 Mt
~$1.5B
3.81 Mt
$0.7B
3.40 Mt
$0.4B
2024
YTD
2026
YTD
Quarterly average
2030
Earnings contributions from advantaged projects2
High-value product sales volume
>40% of earnings potential by
2030 driven by high-value products4
Company-wide
Fundamentally transforming company’s cost base
~$20B
Structural cost savings
by 2030 versus 2019
~$20B
$15.6B
$12.1B
2024
2026
YTD
2030
Plan
Upstream
Energy Products
Chemical Products
Specialty Products
Cumulative savings more than
all other IOCs combined5
Earnings growth and cash flow growth refer to earnings growth at constant prices and margins, and cash flow growth at constant prices and margins.
See supplemental information for footnotes, definitions, and reconciliations.
ExxonMobil
12
Visuals: Chart 1, Upstream (left column): vertical stacked bar chart titled Upstream production, with y-axis label 'Upstream production (Moebd)' with superscript 1, no numeric axis ticks shown, baseline at bottom. Three stacked bars: 2024 total 4.3 Moebd with Advantaged assets 52% (dark blue) and Base (grey); 2026 YTD total 4.6 with Advantaged assets 61%; 2030 Plan total ~5.5 with Advantaged assets ~65%. Category labels 2024, 2026 YTD, 2030 Plan. Legend below: dark blue square Advantaged assets, grey square Base. Chart 2, Product Solutions (centre column): bar chart with no axis, three single-series blue bars with labelled values: 2024 YTD $0.4B, 2026 YTD $0.7B, Quarterly average 2030 ~$1.5B (values printed above bars in blue). Overlaid grey diamond markers for High-value product sales volume labelled 3.40 Mt, 3.81 Mt and ~5.7 Mt. Legend: blue square Earnings contributions from advantaged projects, grey diamond High-value product sales volume. The 2030 bar has a gradient from light grey-blue at top to dark blue at bottom. Chart 3, Company-wide (right column): stacked bar chart of cost savings with totals $12.1B (2024), $15.6B (2026 YTD) and ~$20B (2030 Plan) printed above bars; segment values are not printed so segments are estimates only. Segments from bottom: Upstream (darkest blue), Energy Products, Chemical Products, Specialty Products (palest). Legend in two columns: Upstream, Energy Products; Chemical Products, Specialty Products. Category labels 2024, 2026 YTD, 2030 Plan. No highlighted points. No photographs or logos other than the ExxonMobil wordmark bottom right, which is red with the letter X in a stylised form and a thin blue vertical divider before the page number.
Slide 13
1Q26 versus 4Q25: Corporate
Growing advantaged volumes and driving
structural cost savings to increase earnings
Corporate quarter-on-quarter earnings
Million USD
$7,256
755
Excluding identified items (Non-GAAP)
Identified items
$6,501
3,400
(360)
(870)
Includes ($430M) Middle East volume impact
130
290
(730)
(340)
$8,772
(3,880)
$4,889
706
Excluding identified items (Non-GAAP)
Identified items
$4,183
4Q25 GAAP
Price / margin
Advantaged volume growth
Base volume
Structural cost savings
Expenses
Other
Absence of 4Q25 estimated timing effects
Earnings excluding identified items and estimated timing effects
1Q26 estimated timing effects
1Q26 GAAP
Volume / mix
Due to rounding, numbers may not add.
Identified items in 4Q25 include ($1,700M) Impairments, $720M Divestments, $288M Tax-related items, ($64M) Restructuring charges. Identified items in 1Q26 include ($706M) Other Middle East impacts.
See page 15 and supplemental information for definitions and reconciliations.
Lower volumes from Middle East impacts and scheduled maintenance
$400M lower volumes from two fewer days in quarter
Additional structural cost savings and lower seasonal spend
Other driven by unfavorable forex and absence of favorable year-end inventory adjustments
Estimated timing effects include fair value impacts to open derivative positions
ExxonMobil
13
Visuals: Waterfall chart titled Corporate quarter-on-quarter earnings, units Million USD, no axis scale or gridlines, with a horizontal baseline. Bars from left to right: 4Q25 GAAP total $7,256 made of $6,501 excluding identified items (blue #0C479D) plus 755 identified items (grey about #7F7F7F); Price / margin +3,400 (green #00A14D, value printed inside the bar); Advantaged volume growth (360) (red #C00000); Base volume (870) (red #C00000); Structural cost savings +130 (green); Expenses +290 (green); Other (730) (red); Absence of 4Q25 estimated timing effects (340) (red); Earnings excluding identified items and estimated timing effects $8,772 (blue total bar); 1Q26 estimated timing effects (3,880) (red, hanging from the top of the total); 1Q26 GAAP $4,889 made of $4,183 excluding identified items (blue) plus 706 identified items (grey). A curly bracket under Advantaged volume growth and Base volume is labelled Includes ($430M) Middle East volume impact above the bars and Volume / mix below the category labels. Values printed on the bars and above them; no legend; no highlighted points beyond the colour coding of totals (blue), increases (green), decreases (red) and identified items (grey).
Slide 14
1Q26 versus 1Q25: Corporate
Growing advantaged volumes and driving structural cost
savings to increase earnings
(table header) UPSTREAM / ENERGY PROD / CHEMICAL PROD / SPECIALTY PROD / CORP & FIN / TOTAL
1Q25 GAAP Earnings / (Loss) $6.8 $0.8 $0.3 $0.7 ($0.8) $7.7
1Q25 Earnings / (Loss) excluding identified items (non-GAAP) $6.8 $0.8 $0.3 $0.7 ($0.8) $7.7
1Q25 Estimated timing effects (0.2) 0.0 - - - (0.1)
1Q25 Earnings / (Loss) excluding identified items and estimated timing effects (non-GAAP) $6.6 $0.8 $0.3 $0.7 ($0.8) $7.6
Price / margin (0.3) 2.4 (0.3) (0.1) - 1.7
Advantaged volume growth 0.6 0.1 0.0 0.0 - 0.8
Base volume (0.4) (0.3) 0.1 (0.0) - (0.6)
Structural cost savings 0.2 0.2 0.1 0.0 - 0.4
Expenses (0.6) (0.3) (0.0) 0.0 - (0.9)
Other 0.2 (0.3) 0.0 0.0 (0.3) (0.3)
1Q26 Earnings / (Loss) excluding identified items and estimated timing effects (non-GAAP) $6.3 $2.8 $0.1 $0.7 ($1.1) $8.8
1Q26 Estimated timing effects (0.5) (3.4) - - - (3.9)
1Q26 Earnings / (Loss) excluding identified items (non-GAAP) $5.7 ($0.6) $0.1 $0.7 ($1.1) $4.9
Other Middle East impacts - (0.7) - - - (0.7)
1Q26 GAAP Earnings / (Loss) $5.7 ($1.3) $0.1 $0.7 ($1.1) $4.2
Billions of dollars unless specified otherwise.
Due to rounding, numbers may not add.
See supplemental information for definitions.
ExxonMobil
14
Visuals: One table. Columns: unlabelled row-label column, UPSTREAM, ENERGY PROD, CHEMICAL PROD, SPECIALTY PROD, CORP & FIN, TOTAL. Header row is dark navy #022A6D with white semibold capitals. Rows in order: 1Q25 GAAP Earnings / (Loss): $6.8, $0.8, $0.3, $0.7, ($0.8), $7.7. 1Q25 Earnings / (Loss) excluding identified items (non-GAAP): $6.8, $0.8, $0.3, $0.7, ($0.8), $7.7. 1Q25 Estimated timing effects (indented): (0.2), 0.0, -, -, -, (0.1). 1Q25 Earnings / (Loss) excluding identified items and estimated timing effects (non-GAAP): $6.6, $0.8, $0.3, $0.7, ($0.8), $7.6. Price / margin: (0.3), 2.4, (0.3), (0.1), -, 1.7. Advantaged volume growth: 0.6, 0.1, 0.0, 0.0, -, 0.8. Base volume: (0.4), (0.3), 0.1, (0.0), -, (0.6). Structural cost savings: 0.2, 0.2, 0.1, 0.0, -, 0.4. Expenses: (0.6), (0.3), (0.0), 0.0, -, (0.9). Other: 0.2, (0.3), 0.0, 0.0, (0.3), (0.3). 1Q26 Earnings / (Loss) excluding identified items and estimated timing effects (non-GAAP): $6.3, $2.8, $0.1, $0.7, ($1.1), $8.8. 1Q26 Estimated timing effects: (0.5), (3.4), -, -, -, (3.9). 1Q26 Earnings / (Loss) excluding identified items (non-GAAP): $5.7, ($0.6), $0.1, $0.7, ($1.1), $4.9. Other Middle East impacts: -, (0.7), -, -, -, (0.7). 1Q26 GAAP Earnings / (Loss): $5.7, ($1.3), $0.1, $0.7, ($1.1), $4.2. Subtotal rows are light grey #D9D9D9 bands with bold text; detail rows are white with regular text; thin dark rules sit above the 1Q25 timing-adjusted row, below Other, above the 1Q26 estimated timing row and under the final 1Q26 GAAP row. No chart, legend or highlighted points. Header background photo is a subtle navy texture (2681 by 299 px) behind the title, not a chart.
Slide 15
1Q26 versus 4Q25: Corporate / Growing advantaged volumes and driving structural cost / savings to increase earnings / UPSTREAM / ENERGY PROD / CHEMICAL PROD / SPECIALTY PROD / CORP & FIN / TOTAL / 4Q25 GAAP Earnings / (Loss) / $3.5 / $3.4 / ($0.3) / $0.7 / ($0.8) / $6.5 / Impairments / (1.1) / (0.3) / (0.3) / (0.0) / - / (1.7) / Divestments / - / 0.7 / - / - / - / 0.7 / Tax-related items / 0.2 / 0.0 / 0.1 / 0.0 / (0.0) / 0.3 / Restructuring charges / - / - / - / - / (0.1) / (0.1) / 4Q25 Earnings / (Loss) excluding identified items (non-GAAP) / $4.4 / $2.9 / ($0.0) / $0.7 / ($0.7) / $7.3 / 4Q25 Estimated timing effects / 0.0 / (0.4) / - / - / - / (0.3) / 4Q25 Earnings / (Loss) excluding identified items and estimated timing effects (non-GAAP) / $4.4 / $2.5 / ($0.0) / $0.7 / ($0.7) / $7.0 / Price / margin / 2.7 / 1.0 / (0.0) / (0.3) / - / 3.4 / Advantaged volume growth / (0.4) / 0.0 / (0.0) / 0.0 / - / (0.4) / Base volume / (0.3) / (0.6) / 0.1 / (0.0) / - / (0.9) / Structural cost savings / 0.0 / 0.1 / 0.0 / 0.0 / - / 0.1 / Expenses / (0.2) / 0.1 / 0.2 / 0.2 / - / 0.3 / Other / (0.0) / (0.3) / (0.1) / 0.0 / (0.3) / (0.7) / 1Q26 Earnings / (Loss) excluding identified items and estimated timing effects (non-GAAP) / $6.3 / $2.8 / $0.1 / $0.7 / ($1.1) / $8.8 / 1Q26 Estimated timing effects / (0.5) / (3.4) / - / - / - / (3.9) / 1Q26 Earnings / (Loss) excluding identified items (non-GAAP) / $5.7 / ($0.6) / $0.1 / $0.7 / ($1.1) / $4.9 / Other Middle East impacts / - / (0.7) / - / - / - / (0.7) / 1Q26 GAAP Earnings / (Loss) / $5.7 / ($1.3) / $0.1 / $0.7 / ($1.1) / $4.2 / Billions of dollars unless specified otherwise. / Due to rounding, numbers may not add. / See supplemental information for definitions. / ExxonMobil / 15
Visuals: Table with 8 columns: row label (unlabelled), UPSTREAM, ENERGY PROD, CHEMICAL PROD, SPECIALTY PROD, CORP & FIN, TOTAL. Header row in #022A6D navy with white semibold capitals. Body rows: 4Q25 GAAP Earnings / (Loss) $3.5, $3.4, ($0.3), $0.7, ($0.8), $6.5 (grey #D9D9D9 band). Impairments (1.1), (0.3), (0.3), (0.0), -, (1.7). Divestments -, 0.7, -, -, -, 0.7. Tax-related items 0.2, 0.0, 0.1, 0.0, (0.0), 0.3. Restructuring charges -, -, -, -, (0.1), (0.1). 4Q25 Earnings / (Loss) excluding identified items (non-GAAP) $4.4, $2.9, ($0.0), $0.7, ($0.7), $7.3 (grey band). 4Q25 Estimated timing effects 0.0, (0.4), -, -, -, (0.3). 4Q25 Earnings / (Loss) excluding identified items and estimated timing effects (non-GAAP) $4.4, $2.5, ($0.0), $0.7, ($0.7), $7.0 (grey band). Price / margin 2.7, 1.0, (0.0), (0.3), -, 3.4. Advantaged volume growth (0.4), 0.0, (0.0), 0.0, -, (0.4). Base volume (0.3), (0.6), 0.1, (0.0), -, (0.9). Structural cost savings 0.0, 0.1, 0.0, 0.0, -, 0.1. Expenses (0.2), 0.1, 0.2, 0.2, -, 0.3. Other (0.0), (0.3), (0.1), 0.0, (0.3), (0.7). 1Q26 Earnings / (Loss) excluding identified items and estimated timing effects (non-GAAP) $6.3, $2.8, $0.1, $0.7, ($1.1), $8.8 (grey band). 1Q26 Estimated timing effects (0.5), (3.4), -, -, -, (3.9). 1Q26 Earnings / (Loss) excluding identified items (non-GAAP) $5.7, ($0.6), $0.1, $0.7, ($1.1), $4.9 (grey band). Other Middle East impacts -, (0.7), -, -, -, (0.7). 1Q26 GAAP Earnings / (Loss) $5.7, ($1.3), $0.1, $0.7, ($1.1), $4.2 (grey band with dark rule beneath). Thin grey horizontal rules separate sub-totals. Logo: ExxonMobil wordmark, red X-swoosh and dark blue lettering, bottom-right, with a thin blue vertical divider before the page number 15. No photographs or charts.
Slide 16
1Q26 versus 1Q25: Upstream
Growing advantaged volumes and driving
structural savings to increase earnings
Upstream year-over-year earnings excluding identified items
Million USD
$ 6,756
(280)
610
(380)
170
(650)
200
(160)
$6,265
(530)
$ 5,737
Includes ($270M)
Middle East
volume impact
1Q25 excluding identified items
Price
Advantaged assets volume
Base volume
Structural cost savings
Expenses
Other
Absence of 1Q25 estimated timing effects
Earnings excluding identified items and estimated timing effects
1Q26 estimated timing effects
1Q26 excluding identified items
Volume / mix
Due to rounding, numbers may not add.
See page 14 and supplemental information for footnotes, definitions, and reconciliations.
Record Guyana production underpinned by industry-leading reliability1
Base volume decrease from divestments and operational disruptions in Kazakhstan
Higher depreciation partly offset by additional structural cost savings
ExxonMobil | 16
Visuals: Chart: waterfall bar chart titled 'Upstream year-over-year earnings excluding identified items', unit Million USD, with no visible axis scale or gridlines; values are printed on each bar. Bars in order: 1Q25 excluding identified items $ 6,756 (solid blue #0C479D total bar); Price (280) (red #C00000 decrease); Advantaged assets volume 610 (green #00A14D increase); Base volume (380) (red decrease); Structural cost savings 170 (green increase); Expenses (650) (red decrease); Other 200 (green increase); Absence of 1Q25 estimated timing effects (160) (red decrease); Earnings excluding identified items and estimated timing effects $6,265 (solid blue total bar); 1Q26 estimated timing effects (530) (red decrease); 1Q26 excluding identified items $ 5,737 (solid blue total bar). Bracket under Advantaged assets volume and Base volume labelled 'Includes ($270M) Middle East volume impact' above a bracket grouping them as 'Volume / mix' below. No legend. No highlighted points beyond the colour coding of increases and decreases. Dark blue photographic panel on the right: abstract blue gradient texture, navy at top shading to royal blue at bottom, full-bleed within its panel, no subject.
Slide 17
1Q26 versus 1Q25: Energy Products
Growing advantaged volumes and driving
structural savings to increase earnings
Energy Products year-over-year earnings excluding identified items
Million USD
150
(260)
160
30
$2,799
(250)
(280)
2,420
Includes ($160M)
Middle East
volume impact
(3,350)
$ 827
($556)
1Q25
excluding
identified
items
Margin
Advantaged
projects
volume
Base
volume
Structural
cost savings
Expenses
Other
Absence
of 1Q25
estimated
timing
effects
Earnings
excluding
identified
items and
estimated
timing
effects
1Q26
estimated
timing
effects
1Q26
excluding
identified
items
Volume / mix
Due to rounding, numbers may not add.
See page 14 and supplemental information for definitions and reconciliations.
Improved margin includes
strong results from trading
and optimization
Structural cost savings
offset by planned
turnaround activity
Other reflects unfavorable
forex
ExxonMobil
17
Visuals: Chart: waterfall bar chart titled 'Energy Products year-over-year earnings excluding identified items', unit 'Million USD', with a thin dark grey horizontal zero axis line across the plot at about 72.6% of slide height; there is no printed y-axis scale and no legend. Bars left to right with printed values: 1Q25 excluding identified items blue total $ 827 (about 827); Margin green +2,420; Advantaged projects volume green +150; Base volume red (260); Structural cost savings green +160; Expenses red (250); Other red (280); Absence of 1Q25 estimated timing effects green +30; Earnings excluding identified items and estimated timing effects blue total $2,799; 1Q26 estimated timing effects red (3,350); 1Q26 excluding identified items blue total ($556) plotted below the axis. A bracket beneath Advantaged projects volume and Base volume is labelled 'Volume / mix', and a bracket above them is labelled 'Includes ($160M) Middle East volume impact'. Totals are blue #0C479D, increases green #00A14D, decreases red #C00000; the 2,420 and (3,350) labels are printed in white inside their bars and all other values sit above or below bars in grey. No highlighted points beyond the colour coding. Right panel: photographic or rendered dark navy gradient texture from near-black navy at the top to brighter cobalt toward the bottom, full height, not cropped.
Slide 18
1Q26 versus 1Q25: Chemical Products
Growing advantaged volumes and driving
structural savings to increase earnings
Chemical Products year-over-year earnings excluding identified items
Million USD
$ 273
(340)
50
90
70
(40)
10
$ 110
1Q25 / excluding / identified items
Margin
High-value / products / volume
Base / volume
Structural / cost savings
Expenses
Other
1Q26 / excluding / identified items
Volume / mix
Due to rounding, numbers may not add.
See page 14 and supplemental information for definitions, and reconciliations.
Compressed margins driven / by lower realizations and / increased feed costs
Volume increases from / China Chemical Complex / start-up
Structural cost savings more / than offset higher expenses / from advantaged / investments
18
ExxonMobil
Visuals: Waterfall chart titled Chemical Products year-over-year earnings excluding identified items, unit Million USD, with no printed axis scale or gridlines. Baseline is a thin black horizontal line at about 73% of slide height from about 4% to 93% width. Bars left to right: 1Q25 excluding identified items $ 273 blue total bar rising from baseline; Margin (340) red bar hanging below baseline; High-value products volume 50 green floating bar below baseline; Base volume 90 green bar straddling baseline; Structural cost savings 70 green floating bar; Expenses (40) red floating bar; Other 10 green thin floating bar; 1Q26 excluding identified items $ 110 blue total bar rising from baseline. A thin grey bracket beneath the High-value products volume and Base volume bars is labelled Volume / mix. Value labels are printed above totals in bold dark grey and inside or above the floating bars in white or grey regular type. Highlighted points: none. No legend. Right side panel contains no chart; it is a photograph-style textured navy background with no people or objects.
Slide 19
1Q26 versus 1Q25: Specialty Products
Growing advantaged volumes and driving
structural savings to increase earnings
Specialty Products year-over-year earnings excluding identified items
Million USD
$ 655
(110)
40
(10)
40
10
30
$ 651
1Q25 excluding identified items
Margin
High-value products volume
Base volume
Structural cost savings
Expenses
Other
1Q26 excluding identified items
Volume / mix
Due to rounding, numbers may not add.
See page 14 and supplemental information for footnotes, definitions, and reconciliations.
Compressed margins driven by increased feed costs
Record sales volume of high-value products 1 and structural cost savings
19
Visuals: Waterfall chart, titled 'Specialty Products year-over-year earnings excluding identified items', unit 'Million USD'. No y-axis, gridlines or tick values are printed; bars are scaled from their labelled values, and a thin dark horizontal baseline runs under all bars. Categories left to right, with values: 1Q25 excluding identified items $655 (total bar, blue #0C479D, rises from baseline to about 62% of plot height); Margin (110) (red #C00000, floating downward, label inside bar in white); High-value products volume 40 (green #00A14D, floating upward, label above bar); Base volume (10) (red #C00000, thin floating bar, label below bar); Structural cost savings 40 (green #00A14D, label above); Expenses 10 (green #00A14D, thin bar, label above); Other 30 (green #00A14D, label above); 1Q26 excluding identified items $651 (total bar, blue #0C479D, label above). Totals are labelled $ 655 and $ 651 in bold. A curly bracket below the High-value products volume and Base volume categories, joined and labelled 'Volume / mix'. No legend. Highlighted points: none beyond the colour coding (green increases, red decreases, blue totals). Bars are flat, with no shadows or gradients.
Slide 20
1Q26 versus 4Q25: Upstream
Growing advantaged volumes and driving
structural savings to increase earnings
Upstream quarter-on-quarter earnings excluding identified items
Million USD
$ 4,410
2,680
(380)
(290)
Includes ($270M)
Middle East
volume impact
0
(160)
(10)
20
$6,265
(530)
$ 5,737
4Q25 excluding identified items
Price
Advantaged assets volume
Base volume
Structural cost savings
Expenses
Other
Absence of 4Q25 estimated timing effects
Earnings excluding identified items and estimated timing effects
1Q26 estimated timing effects
1Q26 excluding identified items
Volume / mix
Due to rounding, numbers may not add.
See page 15 and supplemental information for footnotes, definitions, and reconciliations.
Record Guyana production underpinned by industry-leading reliability 1
Lower volumes from Middle East impacts, operational disruptions in Kazakhstan, and winter storm Fern
Higher depreciation expense
20
ExxonMobil
Visuals: Chart: waterfall bar chart titled 'Upstream quarter-on-quarter earnings excluding identified items', unit Million USD, no printed axes or scale. Bars run left to right: 4Q25 excluding identified items $ 4,410 (blue total bar); Price 2,680 (green increase bar, value shown inside bar); Advantaged assets volume (380) (red decrease); Base volume (290) (red decrease); bracket above these two labelled Includes ($270M) Middle East volume impact; Structural cost savings 0 (grey flat line); Expenses (160) (red decrease); Other (10) (red thin decrease); Absence of 4Q25 estimated timing effects 20 (green thin increase); Earnings excluding identified items and estimated timing effects $6,265 (blue total bar); 1Q26 estimated timing effects (530) (red decrease, label inside bar in white); 1Q26 excluding identified items $ 5,737 (blue total bar). A bracket under Advantaged assets volume and Base volume is labelled Volume / mix. No legend. No highlighted points beyond colour coding of increases (green), decreases (red) and totals (blue). Bars are estimated in height proportion only; the slide prints values as listed. Right panel: photograph-like textured gradient, no subject, see elements.
Slide 21
1Q26 versus 4Q25: Energy Products
Growing advantaged volumes and driving
structural savings to increase earnings
Energy Products quarter-on-quarter earnings excluding identified items
Million USD
0
(640)
80
80
(310)
(360)
$2,907
1,040
$2,799
(3,360)
($556)
Includes ($160M)
Middle East
volume impact
4Q25
Margin
Advantaged
projects
volume
Base
volume
Structural
cost savings
Expenses
Other
Absence
of 4Q25
estimated
timing
effects
Earnings
excluding
identified
items and
estimated
timing
effects
1Q26
estimated
timing
effects
1Q26
excluding
identified
items
Volume / mix
Due to rounding, numbers may not add.
See page 15 and supplemental information for definitions and reconciliations.
Margin improvement
driven by strong refining
and trading
Base volumes lower due to
scheduled maintenance and
Middle East disruptions
Additional structural
cost savings and lower
seasonal spend
Other includes absence
of favorable year-end
inventory effects
ExxonMobil
21
Visuals: Chart: vertical waterfall chart titled Energy Products quarter-on-quarter earnings excluding identified items, unit Million USD, with no printed axis scale or gridlines; a horizontal baseline runs across the bars at about 73% of slide height. Bars from left to right, with printed values: 1) 4Q25 excluding identified items, total bar, solid blue #0C479D, printed $ 2,907 above it; 2) Margin, increase, green #00A14D, printed 1,040 inside; 3) Advantaged projects volume, zero-height bar printed 0 above a thin grey line; 4) Base volume, decrease, red #C00000, printed (640) inside; 5) Structural cost savings, increase, green, printed 80 above; 6) Expenses, increase, green, printed 80 above; 7) Other, decrease, red, printed (310) inside; 8) Absence of 4Q25 estimated timing effects, decrease, red, printed (360) inside; 9) Earnings excluding identified items and estimated timing effects, total bar, solid blue, printed $2,799 above; 10) 1Q26 estimated timing effects, decrease, red bar extending below the baseline, printed (3,360) inside; 11) 1Q26 excluding identified items, total bar, solid blue below the baseline, printed ($556) below. A curly bracket above Advantaged projects volume and Base volume is labelled Includes ($160M) Middle East volume impact. A curly bracket below Advantaged projects volume, Base volume and Structural cost savings is labelled Volume / mix. No legend; no highlighted points beyond the colour coding of totals (blue), increases (green) and decreases (red). Right panel: a photographic or textured dark navy to royal blue background with a subtle fine texture; no imagery or figures visible.
Slide 22
1Q26 versus 4Q25: Chemical Products
Growing advantaged volumes and driving
structural savings to increase earnings
Chemical Products quarter-on-quarter earnings excluding identified items
Million USD
($11)
(50)
(20)
50
30
210
(100)
$ 110
4Q25
excluding
identified items
Margin
High-value
products
volume
Base
volume
Structural
cost savings
Expenses
Other
1Q26
excluding
identified items
Volume / mix
Due to rounding, numbers may not add.
See page 15 and supplemental information for definitions and reconciliations.
Compressed margins driven
by increased feed costs
Additional structural
cost savings and lower
seasonal spend
Other reflects absence
of favorable tax items
22
Visuals: Chart: vertical waterfall (bridge) chart, Chemical Products quarter-on-quarter earnings excluding identified items, Million USD. Title above the plot: 'Chemical Products quarter-on-quarter earnings excluding identified items'; unit line 'Million USD'. No printed y-axis or gridlines; a single black horizontal zero line at about 70.1% of slide height spans the plot from about x 4.2% to 64.8%. Bars, left to right, with printed values: 1) 4Q25 excluding identified items, blue (#0C479D) total bar below zero, value ($11) (bold, dark grey #404040, label under bar). 2) Margin, red (#C00000) bar, value (50), label inside bar. 3) High-value products volume, red bar, value (20), label inside bar. 4) Base volume, green (#00A14D) bar, value 50, label inside bar. 5) Structural cost savings, green bar, value 30, label inside bar. 6) Expenses, green bar rising to top of plot, value 210, label inside bar. 7) Other, red bar hanging from top, value (100), label inside bar. 8) 1Q26 excluding identified items, blue total bar above zero, value $ 110 (bold dark grey label above bar). Negative bars are red, positive increases green, totals blue. No legend. No highlighted points beyond colour coding. A thin grey bracket (brace) spans beneath the High-value products volume and Base volume categories (about x 19.9% to 34.0%, y 91.7% to 93.0%) with the label 'Volume / mix' centred beneath it. Right panel: no chart or photo content beyond the dark navy texture background.
Slide 23
1Q26 versus 4Q25: Specialty Products
Growing advantaged volumes and driving
structural savings to increase earnings
Specialty Products quarter-on-quarter earnings excluding identified items
Million USD
$ 682
(280)
40
(0)
20
160
30
$ 651
4Q25 excluding identified items
Margin
High-value products volume
Base volume
Structural cost savings
Expenses
Other
1Q26 excluding identified items
Volume / mix
Compressed margins driven by increased feed costs
Record sales volume of high-value products1 and structural cost savings
Lower seasonal spend
Due to rounding, numbers may not add.
See page 15 and supplemental information for footnotes, definitions, and reconciliations.
ExxonMobil
23
Visuals: Waterfall chart, titled 'Specialty Products quarter-on-quarter earnings excluding identified items', unit 'Million USD'. No y-axis, gridlines or scale are printed; bar heights are relative only. Eight bars left to right: 4Q25 excluding identified items $682 (blue total bar, labelled above); Margin (280) (red decrease bar, label inside in white); High-value products volume 40 (green increase, label inside in white); Base volume (0) (thin red decrease bar, label below in grey); Structural cost savings 20 (green increase, label above in grey); Expenses 160 (green increase, label inside in white); Other 30 (green increase, label above in grey); 1Q26 excluding identified items $651 (blue total bar, labelled above). A curly bracket beneath the High-value products volume and Base volume bars is labelled 'Volume / mix'. Thin dark grey baseline under all bars. Legend: none. Highlighted points: none beyond the colour coding of totals (blue), decreases (red) and increases (green). Right panel photograph: abstract dark navy to royal blue textured gradient, full-bleed in the right third with no recognisable subject, slight darkening toward the top-left corner.
Slides 24 to 45 continue in the full text file.
Download this deck
The hosted PDF of every library deck is free for readers of the SlideDeck Co newsletter. Join with your email and the viewer and download appear here.
Preparing a results presentation or business update of your own? The SlideDeck Co Standard Deck is a slide library for business reviews, updates and plans.







