
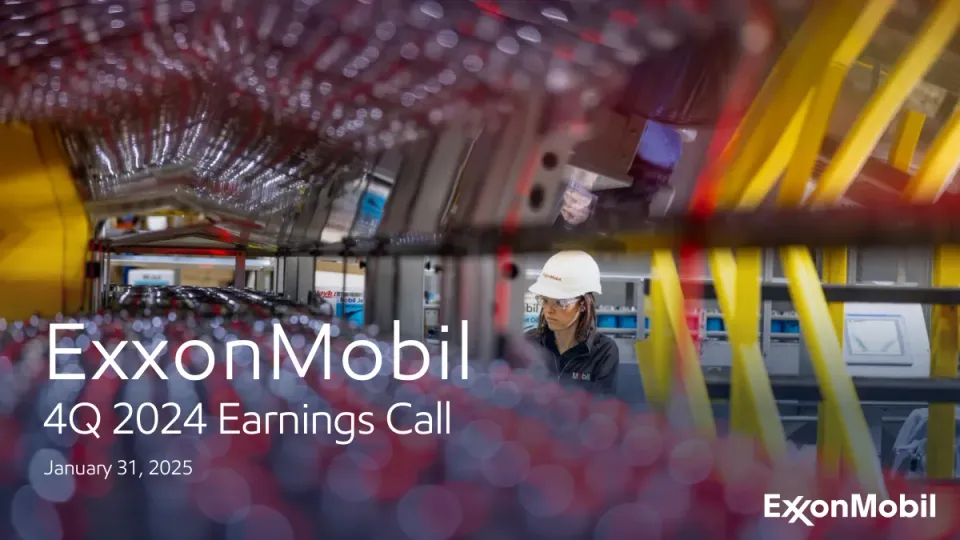
The deck opens with a title slide for the 4Q 2024 earnings call held on January 31, 2025, followed by a long cautionary statement on forward-looking information. It then sets out the headline results for 2024: full-year earnings of $34 billion, cash capex of $26 billion, and industry-leading total shareholder return. The core argument follows in sections on competitive advantages and long-term earnings growth across Upstream, Product Solutions and company-wide cost savings, then the 2025 project start-ups and a track record against the IOCs. Financial sections come next, including macro conditions, full-year and quarter-on-quarter earnings bridges for each segment, the cash flow waterfall and a look ahead to 1Q25. A Q&A slide follows, and the appendix holds project details, sensitivities, definitions and non-GAAP reconciliations. The deck closes with supplemental material rather than a closing message. Slides worth studying are the headline summary on slide 3, the three-column advantage layout on slide 4, the cash flow waterfall on slide 11 and the segment earnings bridges on slides 15 to 18, which use one consistent waterfall format throughout.
Slides worth studying
- Slide 4: Three equal columns each lead with a bold heading and then bullet-style evidence, so the message reads at a glance.
- Slide 11: The cash flow waterfall uses colour to separate inflows and outflows and puts the free cash flow figure in a bracket above the bars.
- Slide 15: The earnings bridge uses one consistent waterfall layout with the driver categories labelled, and the same format is reused for the other segments.
- Slide 5: Three side-by-side charts with small captions show the upstream, product solutions and company-wide story in a single view.
Details
- Company: ExxonMobil
- Year: 2025
- Type: Investor presentation
- Industry: Oil and gas
- Pages: 47
The hosted copy of this deck is being prepared. Newsletter readers will find the download here.
Review score: 7 out of 10, Effective
Presentation quality, judged with the SlideDeck Co review heuristic. Ask, evidence and idea merit are not rated here.
The strength is a well-organised analytical back half: slide 9 reconciles 2023 GAAP $36.0 to 2024 GAAP $33.7 by segment and driver, every segment slide carries a period eyebrow such as '2024 vs. 2023: Upstream', slide 15 labels each bar from $ 23,609 to $ 25,175, and slide 30 defines the new driver names. The bottleneck is that the first seven slides are a promotional case in which results and plan share the page: slide 4 lists 2024 facts such as 'Share repurchases of >$19B in 2024' in the same column as 'Firm plans to grow earnings $20B and cash flow $30B by 2030', and the first results table arrives only at slide 9. Titles also run against the exhibits, as on slide 22 where 'reliably delivering strong earnings' heads a move from $ 794 to $ 759, and on slide 16 (contact sheet) where 'improving underlying results' sits over a fall from $ 11,998 to $ 3,954. Slide 5 does label '2030 Plan' on each chart and slide 12 keeps the 1Q25 outlook separate, which is why the core remains easy to use.
Worth keeping: Keep the period eyebrow above each title and the driver definitions on slide 30.
Most useful repair: On slide 4 separate 2024 results from 2030 plan items into marked groups, and retitle slides 16 and 22 to state the direction of the change shown.
What would change the score: Slide 16 was read from the contact sheet only; if its bars or title differ at readable size, or if the audience treats slides 3 to 7 as a clearly understood strategy preamble, the score could rise to 8.
Confidence medium. 47 of 47 pages inspected on contact sheets, 12 at readable size. Reviewed 2026-11-15. Model-assisted review (claude-fable-5-2, in session).
Full text of the slides (47 slides)
Every slide's words and a description of its charts and images, so the deck can be searched and rebuilt. Also available as Markdown.
Slide 1
ExxonMobil
4Q 2024 Earnings Call
January 31, 2025
ExxonMobil
1
Visuals: Full-bleed photograph of a factory interior: a worker in a white ExxonMobil hard hat, clear safety glasses and a dark Mobil jacket stands in the middle-right looking down at a work station. Foreground is out-of-focus rows of red and silver bottle-like cylinders with bokeh highlights; background shows yellow safety railings and diagonal yellow beams, grey machinery, blue plastic bins and a small Mobil branded sign. Composition is horizontal with the worker at about the centre-right third; the image is cropped to full slide. Lighting is diffuse industrial with bright specular highlights on metal. Dominant colours: red, silver grey, yellow, white. A dark purple-grey tint overlay darkens the lower part behind the text. Ssmall white ExxonMobil logo at bottom right (filled white rectangle behind logo at x 79.6, y 91.5, w 17.8, h 5.9 is the white logo band). Top band of solid blue #0C479D occupies the top 19.2% of the slide behind the photo area.
Slide 2
Cautionary statement
FORWARD-LOOKING STATEMENTS. Statements of future events, conditions, expectations, plans, future earnings power, potential addressable markets, ambitions, or results in this
presentation or the subsequent discussion period are forward-looking statements. Similarly, discussions of future carbon capture, transportation, and storage, as well as biofuels,
hydrogen, ammonia, lithium, direct air capture, and other low carbon business plans to reduce emissions and emission intensity of ExxonMobil, its affiliates, or third parties are dependent
on future market factors, such as continued technological progress, stable policy support, and timely rule-making and permitting, and represent forward-looking statements. Actual future
results, including financial and operating performance; potential earnings, cash flow, dividends or shareholder returns, including the timing and amount of share repurchases; total capital
expenditures and mix, including allocations of capital to low carbon investments; realization and maintenance of structural cost reductions and efficiency gains, including the ability to
offset inflationary pressures; plans to reduce future emissions and emissions intensity; ambitions to reach Scope 1 and Scope 2 net zero from operated assets by 2050, to reach Scope 1
and 2 net zero in heritage Upstream Permian Basin unconventional operated assets by 2030 and Pioneer Permian assets by 2035, to eliminate routine flaring in-line with World Bank Zero
Routine Flaring, to reach near-zero methane emissions from operated assets and other methane initiatives, to meet ExxonMobil’s emission reduction plans and goals, divestment and
start-up plans, and associated project plans as well as technology advances, including in the timing and outcome of projects to capture and store CO2, produce hydrogen and ammonia,
produce biofuels, produce lithium, create new advanced carbon materials, and use plastic waste as feedstock for advanced recycling; maintenance and turnaround activity; drilling and
improvement programs; price and margin recovery; planned Pioneer or Denbury integration benefits; resource recoveries and production rates; and product sales levels and mix could
differ materially due to a number of factors. These include global or regional changes in oil, gas, petrochemicals, or feedstock prices, differentials, seasonal fluctuations, or other market or
economic conditions affecting the oil, gas, and petrochemical industries and the demand for our products; new or changing government policies supporting lower carbon and new market
investment opportunities or policies limiting the attractiveness of investments such as European taxes on energy and unequal support for different methods of carbon capture; consumer
preferences including for emission-reduction products and technology; variable impacts of trading activities; the outcome of competitive bidding and project awards; regulatory actions in
any part of the world targeting public companies in the oil and gas industry; the development or changes in local, national, or international laws, regulations, and policies affecting our
business including with respect to the environment, taxes, and trade sanctions; adoption of regulatory incentives consistent with law; the ability to realize efficiencies within and across our
business lines and to maintain current cost reductions as efficiencies without impairing our competitive positioning; decisions to invest in future reserves; reservoir performance, including
variability and timing factors applicable to unconventional projects and the success of new unconventional technologies; the level, outcome, and timing of exploration and development
projects and decisions to invest in future resources; timely completion of construction projects; war, civil unrest, attacks against the company or industry, decoupling of trade networks,
and other political or security disturbances; expropriations, seizures, and capacity, insurance, or shipping limitations by foreign governments or international embargoes; changes in market
strategy by national oil companies; opportunities for and regulatory approval of investments or divestments; the outcome of other energy companies’ research efforts and the ability to
bring new technology to commercial scale on a cost-competitive basis; the development and competitiveness of alternative energy and emission reduction technologies; unforeseen
technical or operating difficulties, including the need for unplanned maintenance; and other factors discussed here and in Item 1A. Risk Factors of our Form 10-K and under the heading
“Factors Affecting Future Results” available through the Investors page of our website at www.exxonmobil.com. All forward-looking statements are based on management’s knowledge
and reasonable expectations at the time of this presentation and we assume no duty to update these statements as of any future date. Neither future distribution of this material nor the
continued availability of this material in archive form on our website should be deemed to constitute an update or re-affirmation of these figures as of any future date. Any future update of
these figures will be provided only through a public disclosure indicating that fact.
Reconciliations and definitions of factors, non-GAAP, and other terms are provided in the text or in the supplemental information accompanying these slides beginning on page 28.
2 of 47 ExxonMobil 2
Slide 3
Delivering leading shareholder value from / fundamental transformation of the business / Full-year earnings of $34B / underpinned by advantaged / growth and strong / operational performance / Cash capex of $26B; / disciplined investing in / unmatched opportunities / across traditional and new / businesses / Industry-leading / total shareholder return of / 11%; 10 percentage points / higher than closest IOC / See page 9 and supplemental information for definitions and reconciliations. / ExxonMobil / 3
Visuals: One photograph: a woman worker in a white full-brim hard hat printed ExxonMobil in red, clear safety glasses, a blue earplug in her right ear, long dark hair, a light grey long-sleeved work shirt with a red logo, and a Motorola radio clipped to her shoulder. She is looking down toward work at the lower left, with a blurred grey industrial background and red equipment at the bottom edge. The frame is cropped at the top and right, and the photograph is full-bleed with a dark grey tint. No charts, tables or diagrams. Three solid rectangles act as cards, and the only logo is the ExxonMobil wordmark at bottom right.
Slide 4
Competitive advantages deliver leading value today
and a long runway of profitable growth
Delivering advantaged
growth and strong
operational performance
Investing in unmatched
opportunities in traditional
and new businesses
Delivering leading
shareholder returns
Continuing industry leadership
in safety performance¹
Upstream production of 4.3 Moebd
with >50% from advantaged assets;
highest in more than a decade
Reducing emissions intensity:
>60% reduction in operated
methane emissions intensity
since 2016²
Successfully closed Pioneer
acquisition; synergies of
>$3B/year over next decade³
Grew high-value products by 10% vs.
2023; established carbon materials
and Proxxima™ businesses
6.7 Mta of CO₂ under contract
underpinned by the world’s only end-
to-end CCS system⁴
Increased annual
dividends per share for
42 consecutive years
Share repurchases of
>$19B in 2024;
highest in more than a decade
Firm plans to grow earnings $20B
and cash flow $30B by 2030 with
long runway of profitable growth⁵
See supplemental information for footnotes and definitions.
4
Visuals: No photographs, charts, tables or icons. Three thin horizontal blue rules in each column, two per column, spanning about 23% of slide width and centred under the column, at about 57.1% and 73.2% of slide height. A vertical thin blue rule at about 97.6% x between the logo and the page number. ExxonMobil wordmark logo in red with the x-letter stylised, bottom right.
Slide 5
Driving long-term earnings growth
Upstream
% advantaged assets of total Upstream production1
4.3
~5.4
>60%
>50%
Upstream Production (Moebd)
2024
2030
Plan
Advantaged assets
Base
Upstream unit earnings ex. identified items
Constant price basis3
2019
2024
2030 Plan
$/oeb
~$5
~$10
~$13
Product Solutions
Advantaged projects and high-value product sales growth2
~25 Mt
~$6.0B
14.0 Mt
$2.1B
2024
2030
Plan
Earnings contributions from advantaged projects
High-value product sales volume
Product Solutions unit earnings ex. identified items
Constant margin basis3
2019
2024
2030 Plan
EP ($/bbl)
CP ($/T)
SP ($/T)
~$1
~$2
~$6
~$165
~$215
~$310
~$150
~$295
~$385
Company-wide
Cumulative structural cost savings ($B) vs. 2019
~$6 B
Additional structural
cost savings vs. YE’24
$12.1
~$18
2024
2030
Plan
Upstream
Energy Products
Chemical Products
Specialty Products
~$18B structural cost savings
by 2030 vs. 2019
See supplemental information for footnotes, definitions, and reconciliations.
ExxonMobil
5
Visuals: Three bar-chart panels and two data tables, plus a logo. (1) Upstream chart: title 'Upstream', subtitle '% advantaged assets of total Upstream production1'. Vertical axis labelled 'Upstream Production (Moebd)' with no printed tick values or range. Two stacked columns: 2024 and 2030 Plan. 2024 column total labelled 4.3, split into advantaged assets (dark blue #025C98, labelled >50%) and base (light grey #C5C5C5). 2030 Plan column total labelled ~5.4, advantaged assets labelled >60% in dark blue with a fading gradient transition to grey at the top of the blue segment; base in grey. Legend below: dark blue square 'Advantaged assets', grey square 'Base'. (2) Product Solutions chart: subtitle 'Advantaged projects and high-value product sales growth2'. No value axis printed. Two columns: 2024 is dark blue #025C98 labelled $2.1B with a grey diamond marker above labelled 14.0 Mt; 2030 Plan is a column with a gradient from pale blue-grey at the top to dark blue #025C98 at the bottom, labelled ~$6.0B, with a grey diamond marker above labelled ~25 Mt. Legend: dark blue square 'Earnings contributions from advantaged projects'; grey diamond 'High-value product sales volume'. (3) Company-wide stacked chart: subtitle 'Cumulative structural cost savings ($B) vs. 2019'. Two stacked columns, 2024 total $12.1 and 2030 Plan total ~$18. Segments bottom to top: Upstream dark blue #025C98, Energy Products #00A3E0, Chemical Products #37CBFF, Specialty Products very pale blue (about #B3ECFF). 2030 segments are taller, the thin pale top band is Specialty Products. A dashed blue (#3A6DB5) bracket line runs from above the 2024 column up to a horizontal line and down to above the 2030 column, labelled ~$6 B 'Additional structural cost savings vs. YE’24'. Legend in a 2 by 2 grid of colour squares. (4) Table 'Upstream unit earnings ex. identified items, Constant price basis3': columns 2019, 2024, 2030 Plan; row $/oeb with values ~$5, ~$10, ~$13. (5) Table 'Product Solutions unit earnings ex. identified items, Constant margin basis3': columns 2019, 2024, 2030 Plan; rows EP ($/bbl) ~$1, ~$2, ~$6; CP ($/T) ~$165, ~$215, ~$310; SP ($/T) ~$150, ~$295, ~$385. Table text is dark grey, not boxed, with no rules. (6) Logo: ExxonMobil wordmark in red with a blue vertical rule and page number 5 at bottom right. No photographs or icons. The bars have no axis tick values; the 2024 and 2030 columns are not labelled with units other than those printed.
Slide 6
2025 project start-ups: executing our uniquely advantaged / growth plans
China Chemical Complex
U.K. Fawley Hydrofiner
U.S. Advanced Recycling Units
Canada Strathcona Renewable Diesel
Singapore Resid Upgrade
Brazil Bacalhau
Guyana Yellowtail
U.S. Golden Pass LNG Train 1
U.S. Proxxima TM Systems Expansion
U.S. CF Industries CCS
>$3B potential earnings contribution in 2026 from these projects 1
See supplemental information for footnotes and definitions.
6
Visuals: Ten rectangular photographs, unframed, full-cell and uncropped to their cells, each with a white label in its top-left corner. Row 1 left to right: (1) China Chemical Complex: a construction site of tall multi-storey modular steel structures wrapped in scaffolding, a yellow tower crane at right, pale blue sky above, daylight, grey and yellow-green dominant colours. (2) U.K. Fawley Hydrofiner: looking up between two large white-grey cylindrical reactor vessels, with red-orange handrails, ladders and platforms, pale sky in the centre, cool grey and red dominant colours. (3) U.S. Advanced Recycling Units: aerial view of a dense refinery with towers, pipe racks and a white tanker truck at lower left, flat daylight, grey and tan dominant colours. (4) Canada Strathcona Renewable Diesel: two workers in blue coveralls and white hard hats standing on a yellow elevated platform among orange steel beams, dark background, warm orange and yellow dominant colours. (5) Singapore Resid Upgrade: aerial view of a dense process plant with a tall lattice tower, stairs and pipe racks under a grey sky, grey and dark tones with rust-coloured steel. Row 2 left to right: (6) Brazil Bacalhau: a floating production vessel with dark red hull on a teal-green sea with several tugboats around it, hazy sky, teal and grey dominant colours. (7) Guyana Yellowtail: a large FPSO hull under construction in a dry dock, surrounded by scaffolding and colourful pipework, orange hull, yellow and green accents. (8) U.S. Golden Pass LNG Train 1: aerial view of an LNG process site with pipe racks, vessels and grey buildings on tan ground, slightly hazy, grey and tan dominant colours. (9) U.S. Proxxima Systems Expansion: workers in orange hi-vis vests beside concrete foundations and a tall steel frame, pine trees behind, red clay ground, dominant red-brown and green. (10) U.S. CF Industries CCS: aerial view of a plant beside a river with a long pipeline crossing green fields and bare autumn trees, dusky sky, green and brown dominant colours. A blue bar across the lower part of the slide: solid fill #0C479D, square corners, no border, no shadow. The headline figure is set in white text on the bar. No logos other than the ExxonMobil wordmark at bottom right.
Slide 7
Track record of delivering leading shareholder value,
outperforming IOCs on key financial metrics
2024 GAAP earnings
$34
B
Earnings ex. identified items of $33.5B
with 5-year CAGR of ~30%1
2024 cash flow from operations
$55
B
5-year CAGR of ~15%
Structural cost savings vs. 2019
>$12
B
2024 ROCE
13
%
5-year average of 11%2
5-year shareholder distributions
>$125
B
5-year total shareholder return CAGR
14
%
IOC earnings, cash flow, and shareholder distributions are sourced from Bloomberg. 2024 figures are actuals for IOCs that reported results on or before January 30, 2025, or estimated using Bloomberg consensus as of January 30, 2025.
Due to rounding to nearest whole or 0.5 billion, numbers presented may not align precisely with item indicated.
See page 9 and supplemental information for footnotes, definitions, and reconciliations.
7
Visuals: Six solid navy rectangles, each a KPI tile with no imagery, no chart and no border. Tile 1 (top-left): label '2024 GAAP earnings', large figure '$34' with unit 'B', caption 'Earnings ex. identified items of $33.5B with 5-year CAGR of ~30%' with superscript 1. Tile 2 (top-middle): label '2024 cash flow from operations', figure '$55' with unit 'B', caption '5-year CAGR of ~15%'. Tile 3 (top-right): label 'Structural cost savings vs. 2019', figure '>$12' with unit 'B', no caption. Tile 4 (bottom-left): label '2024 ROCE', figure '13' with unit '%', caption '5-year average of 11%' with superscript 2. Tile 5 (bottom-middle): label '5-year shareholder distributions', figure '>$125' with unit 'B', no caption. Tile 6 (bottom-right): label '5-year total shareholder return CAGR', figure '14' with unit '%', no caption. No charts, axes, legends or highlighted points. A red ExxonMobil wordmark logo sits bottom-right, and a thin blue vertical rule separates it from the page number.
Slide 8
Macro
Integrated portfolio delivers leading
performance across commodity cycles
Industry prices / margins
10-year annual range1
2024 crude and gas prices
near 10-year average;
4Q24 gas prices higher on
seasonal demand
Refining margins declined
in 2024 as additional
supply outpaced demand;
4Q24 margins improved
slightly driven by Asia
Pacific and Europe
Chemical margins remain
bottom-of-cycle driven by
Asia Pacific
Crude
prices2
($/bbl)
Natural gas
prices3
($/mbtu)
Refining
margins4
($/bbl)
Chemical
margins5
($/tonne)
2023
2024
3Q24
4Q24
10-year annual range
(2010-2019)
See supplemental information for footnotes.
8
Visuals: Chart: a categorical range-and-marker chart titled Industry prices / margins, subtitled 10-year annual range with superscript 1. Vertical axis line at the left with no tick labels, no numeric axis values and no units on the axis; units are stated under each category: Crude prices ($/bbl), Natural gas prices ($/mbtu), Refining margins ($/bbl), Chemical margins ($/tonne). Each category has a flat mid-grey (#B5B5B5) rectangle representing the 10-year annual range (2010-2019), with no printed values. Markers are diamonds for 2023 (black) and 2024 (green #00A03C-style green), circles for 3Q24 (red) and 4Q24 (blue). Crude prices: markers cluster inside the box, with 2024 green diamond at left, 3Q24 red circle and 4Q24 blue circle at left-centre, and 2023 black diamond slightly right of centre, all near the same height. Natural gas prices: 2023 black diamond above the box, 4Q24 blue circle just above the top edge, 3Q24 red circle in the upper part of the box, 2024 green diamond lower in the box. Refining margins: 2023 black diamond above the box, 2024 green diamond in the lower half of the box, 3Q24 red circle near the bottom edge, 4Q24 blue circle slightly right of it at the bottom. Chemical margins: the grey range box is empty; markers sit below it, with 3Q24 red circle highest, 2024 green diamond next, 2023 black diamond slightly lower and right, and 4Q24 blue circle lowest. No values are printed, so positions are relative only. Legend below the chart in one row: black diamond 2023, green diamond 2024, red circle 3Q24, blue circle 4Q24, grey square 10-year annual range (2010-2019). No highlighted points beyond colour coding.
Slide 9
2024 vs. 2023
Business transformation driving leading financial performance
UPSTREAM
ENERGY PROD
CHEMICAL PROD
SPECIALTY PROD
CORP & FIN
TOTAL
2023 GAAP Earnings / (Loss)
Additional European taxes on energy sector
Impairments
Tax-related items
Announced divestments / other
2023 Earnings / (Loss) ex. identified items (non-GAAP)
Price / margin
Advantaged volume growth
Base volume
Structural cost savings
Expenses
Other
Timing effects
2024 Earnings / (Loss) ex. identified items (non-GAAP)
Announced divestments
Impairments
Tax-related items
2024 GAAP Earnings / (Loss)
Billions of dollars unless specified otherwise.
Due to rounding, numbers may not add.
See supplemental information for definitions.
ExxonMobil
9
Visuals: One table, no chart. Columns: a blank row-label column (x 2.1% to 41.3%), then UPSTREAM, ENERGY PROD, CHEMICAL PROD, SPECIALTY PROD, CORP & FIN, and TOTAL. Header row in white capitals on blue. Rows, with values in billions of dollars: 2023 GAAP Earnings / (Loss) | $21.3 | $12.1 | $1.6 | $2.7 | ($1.8) | $36.0. Additional European taxes on energy sector | (0.2) | (0.1) | - | - | - | (0.2). Impairments | (2.7) | - | (0.3) | (0.1) | - | (3.0). Tax-related items | 0.2 | 0.2 | 0.1 | 0.0 | 0.1 | 0.6. Announced divestments / other | 0.3 | - | (0.1) | (0.0) | - | 0.1. 2023 Earnings / (Loss) ex. identified items (non-GAAP) | $23.6 | $12.0 | $2.0 | $2.8 | ($1.9) | $38.6. Price / margin | (1.3) | (6.3) | 0.9 | 0.6 | - | (6.1). Advantaged volume growth | 3.8 | 0.1 | 0.4 | 0.1 | - | 4.4. Base volume | (0.8) | (1.2) | (0.3) | (0.0) | - | (2.3). Structural cost savings | 0.8 | 0.6 | 0.2 | 0.1 | - | 1.8. Expenses | (1.3) | (1.0) | (0.5) | (0.3) | - | (3.1). Other | 0.1 | (0.3) | (0.1) | (0.2) | 0.5 | (0.0). Timing effects | 0.3 | (0.0) | - | - | - | 0.3. 2024 Earnings / (Loss) ex. identified items (non-GAAP) | $25.2 | $4.0 | $2.7 | $3.1 | ($1.4) | $33.5. Announced divestments | 0.4 | - | - | - | 0.0 | 0.4. Impairments | (0.4) | (0.1) | (0.1) | (0.0) | - | (0.6). Tax-related items | 0.2 | 0.2 | - | (0.0) | - | 0.4. 2024 GAAP Earnings / (Loss) | $25.4 | $4.0 | $2.6 | $3.1 | ($1.4) | $33.7. Subtotal and GAAP total rows are bold with grey bands; line-item rows are regular weight with no band. Thin black horizontal rules sit above the 2023 non-GAAP subtotal row, above the 2024 non-GAAP subtotal row, and below the final row. No photographs, icons or illustrations.
Slide 10
4Q24 vs. 3Q24
Business transformation driving leading financial performance
UPSTREAM ENERGY PROD CHEMICAL PROD SPECIALTY PROD CORP & FIN TOTAL
3Q24 GAAP Earnings / (Loss) $6.2 $1.3 $0.9 $0.8 ($0.5) $8.6
3Q24 Earnings / (Loss) ex. identified items (non-GAAP) $6.2 $1.3 $0.9 $0.8 ($0.5) $8.6
Price / margin (0.4) (0.3) (0.4) 0.1 - (1.1)
Advantaged volume growth 0.3 0.0 (0.0) (0.0) - 0.3
Base volume (0.2) 0.1 (0.0) (0.0) - (0.2)
Structural cost savings 0.1 0.0 0.0 0.0 - 0.1
Expenses (0.1) (0.3) (0.1) (0.1) - (0.7)
Other 0.5 0.2 (0.1) 0.1 0.4 1.1
Timing effects (0.0) (0.7) - - - (0.8)
4Q24 Earnings / (Loss) ex. identified items (non-GAAP) $6.3 $0.3 $0.2 $0.8 ($0.2) $7.4
Announced divestments 0.4 - - - 0.0 0.4
Impairments (0.4) (0.1) (0.1) (0.0) - (0.6)
Tax-related items 0.2 0.2 - (0.0) - 0.4
4Q24 GAAP Earnings / (Loss) $6.5 $0.4 $0.1 $0.7 ($0.2) $7.6
Billions of dollars unless specified otherwise.
Due to rounding, numbers may not add.
See supplemental information for definitions.
ExxonMobil
10
Visuals: Table: columns are the row-label column (no heading), UPSTREAM, ENERGY PROD, CHEMICAL PROD, SPECIALTY PROD, CORP & FIN, TOTAL. Rows in order: 3Q24 GAAP Earnings / (Loss) $6.2 $1.3 $0.9 $0.8 ($0.5) $8.6; 3Q24 Earnings / (Loss) ex. identified items (non-GAAP) $6.2 $1.3 $0.9 $0.8 ($0.5) $8.6; Price / margin (0.4) (0.3) (0.4) 0.1 - (1.1); Advantaged volume growth 0.3 0.0 (0.0) (0.0) - 0.3; Base volume (0.2) 0.1 (0.0) (0.0) - (0.2); Structural cost savings 0.1 0.0 0.0 0.0 - 0.1; Expenses (0.1) (0.3) (0.1) (0.1) - (0.7); Other 0.5 0.2 (0.1) 0.1 0.4 1.1; Timing effects (0.0) (0.7) - - - (0.8); 4Q24 Earnings / (Loss) ex. identified items (non-GAAP) $6.3 $0.3 $0.2 $0.8 ($0.2) $7.4; Announced divestments 0.4 - - - 0.0 0.4; Impairments (0.4) (0.1) (0.1) (0.0) - (0.6); Tax-related items 0.2 0.2 - (0.0) - 0.4; 4Q24 GAAP Earnings / (Loss) $6.5 $0.4 $0.1 $0.7 ($0.2) $7.6. Values are in billions of dollars; parentheses denote negatives and '-' denotes zero or none. Subtotal rows (3Q24 GAAP, 3Q24 ex. items, 4Q24 ex. items, 4Q24 GAAP) are bold and shaded; the 3Q24 ex. items row and the 4Q24 ex. items row have a thin black rule above them, and the 4Q24 GAAP row has a thin black rule below. No chart, photograph, or icons. Corner logo: ExxonMobil wordmark in red with a small blue vertical bar before the page number.
Slide 11
Effective capital allocation growing / shareholder value
Cash flow
Billion USD
5.0
(25.6)
55.0
(36.0)
$ 31.6
(6.8)
$ 23.2
$34.4 billion / free cash flow1
YE'23 / cash
CFO
Asset / sales
Cash / capex2
Shareholder / distributions
Debt / repayment / other
YE'24 / cash
Strong earnings drove / free cash flow of >$34B
Full-year cash capex of / $26B supporting / advantaged growth
Free cash flow ex-working / capital of $36.2B / covered distributions3
13% debt-to-capital; / 6% net debt-to-capital
See supplemental information for footnotes, definitions, and reconciliations.
11
Visuals: Waterfall chart titled 'Cash flow', unit 'Billion USD', with a horizontal baseline. Bars left to right: YE'23 cash $31.6 (solid blue total bar, #0C479D, value label above); CFO +55.0 (green #00A14D floating bar, value inside); Asset sales +5.0 (small green floating bar, value above); Cash capex2 (25.6) (grey #C0C0C0 floating bar, value inside); Shareholder distributions (36.0) (grey floating bar, value inside); Debt repayment / other (6.8) (small grey floating bar, value inside); YE'24 cash $23.2 (solid blue total bar, value above). Bar values are printed, so no estimates. A bracket beneath the CFO through Cash capex bars is labelled '$34.4 billion free cash flow1'. No legend, no axis scale printed, no highlighted points beyond colour coding: green for inflows, grey for outflows, blue for totals.
Slide 12
LOOKING AHEAD TO 1Q25
Upstream
Product Solutions
Corporate
Lower seasonal scheduled
maintenance to increase
volumes by ~80 Koebd
~70 Koebd impact from
Nigeria JV and Argentina
divestments
Absence of ~$400M
net favorable tax impacts
Higher seasonal
scheduled maintenance
First full quarter without
Fos-sur-Mer refinery
(~130 Kbd)
Absence of ~$300M net
favorable year-end inventory,
asset management, and
tax impacts
Corporate & financing
expenses expected to be
$400M-$600M
See supplemental information for definitions.
ExxonMobil
12
Visuals: none. No photographs, charts, tables or illustrations. Decorative geometry only: a dark blue header band, a light blue pointed banner behind the title, three navy column header boxes, three light grey column cards, and short horizontal blue divider rules inside the Upstream and Product Solutions cards.
Slide 13
Extending our track record of / leading performance into 2025 / Lead in safety, operating, / and financial performance / Leveraging advantages to capitalize / on unmatched opportunity set / Executing capital allocation priorities / and returning cash to shareholders / Growing Upstream production to / 4.7 Moebd; 1.5 Moebd from Permian / Achieving additional structural cost / savings; ~$18B by 2030 / Cash capex of $27B-$29B underpins / long runway of profitable growth / On track for 10 key project start-ups; / >$3B earnings potential in 2026¹ / Sustainable, competitive, and / growing dividend / Annual share buybacks of $20B, / assuming reasonable market conditions / See supplemental information for footnotes and definitions. / 13 / ExxonMobil
Visuals: Full-bleed photograph of a man in a tan long-sleeve work shirt and dark wraparound safety glasses, wearing a grey carbon-textured hard hat printed with red 'ExxonMobil' and white 'Chemical' lettering, and an orange earplug in his right ear. He is climbing or looking upward through dark grey metal railings and a staircase, with his face turned up toward the upper right. The photo is shot from a high, steep angle with the subject in the centre-left and the railings radiating diagonally across the frame. Lighting is natural and diffuse, with a bright white sky area at the top left. Dominant colours are charcoal grey, tan, khaki and muted brown, with a yellow painted stripe on the ground at the upper right. The image is cropped to the full slide with no border. No overlay is visible on the photo itself, but the three body panels are translucent light grey boxes over it. Header bars are solid opaque blue boxes. Thin blue divider rules sit inside each body panel.
Slide 14
Q&A / ExxonMobil / 14
Visuals: Photograph, full-bleed, covering 100% of the slide with no crop border. Subject: a man in a white hard hat, dark sunglasses, a blue-and-purple checked long-sleeve shirt, blue jeans, a brown leather belt, yellow-and-red work gloves tucked in the belt, and brown work boots. He stands on dry, grey-brown scrubland holding a black handheld drone controller with a small screen, looking up at a black quadcopter drone with a camera gimbal hovering in the upper-left-centre of the frame. Behind and to the left stands a white and red oil drilling rig with a yellow crown block, and a few small structures and dead shrubs sit on the horizon. Composition: low-angle wide shot taken from below, with the sky occupying the upper two-thirds and the man on the right third. Lighting: bright natural daylight. Dominant colours: deep blue sky #2F5BB0 with white wispy cirrus, grey-brown ground #8A8478, blue denim, and yellow and red gloves. No overlay or tint is visible.
Slide 15
2024 vs. 2023: Upstream | Advantaged assets delivering strong | earnings growth | Upstream year-over-year earnings ex. ident. items | Million USD | $ 23,609 | (1,250) | 3,760 | (820) | 830 | (1,350) | 120 | 280 | $ 25,175 | 2023 / ex. ident. / items | Price | Advantaged / assets / volume | Base / volume | Structural / cost savings | Expenses | Other | Timing / effects | 2024 / ex. ident. / items | Volume / mix | 2023: ($600M) | 2024: ($320M) | See page 9 and supplemental information for definitions and reconciliations. | 2024 production of 4.3 / Moebd; record Permian / volumes of 1.2 Moebd | Lower base volume due / to divestments and / entitlements | Structural cost savings / partially offset higher / expenses primarily from / higher depreciation | 15
Visuals: Chart: waterfall bar chart titled 'Upstream year-over-year earnings ex. ident. items', unit 'Million USD', no printed axis scale or gridlines, horizontal baseline at about 76.6% of slide height. Bars left to right with printed values: 2023 ex. ident. items total $ 23,609 (blue, about 0 to 23,609 height); Price (1,250) (red, step down); Advantaged assets volume 3,760 (green, step up, printed inside bar); Base volume (820) (red, step down, printed below bar); Structural cost savings 830 (green, step up, printed above bar); Expenses (1,350) (red, step down, printed inside bar); Other 120 (green, small step up, printed above bar); Timing effects 280 (green, step up, printed above bar); 2024 ex. ident. items total $ 25,175 (blue, printed above bar in semibold). Bracket under Advantaged assets volume and Base volume labelled 'Volume / mix'. Bracket under Timing effects labelled '2023: ($600M)' and '2024: ($320M)'. No legend. No highlighted points beyond colour coding: blue totals, green increases, red decreases. Bars are flat rectangles with no outlines. Right-hand panel contains no images.
Slide 16
2024 vs. 2023: Energy Products
Portfolio high-grading and structural cost
savings improving underlying results
Energy Products year-over-year earnings ex. ident. items
Million USD
$ 11,998
Margin
(6,280)
Advantaged
projects
volume
140
Base
volume
(1,240)
Structural
cost savings
630
Expenses
(970)
Other
(320)
Timing
effects
(10)
2024
ex. ident.
items
$ 3,954
2023
ex. ident.
items
2023: $50M
2024: $40M
Volume / mix
See page 9 and supplemental information for definitions and reconciliations.
16
Margins down from
historic 2023 levels
Lower base volume due
to scheduled maintenance
and divestment of
non-core assets
Structural cost savings
partially offset higher
scheduled maintenance
and advantaged project
spend
Visuals: Chart: vertical waterfall chart, Energy Products year-over-year earnings excluding identified items, in Million USD. Title: Energy Products year-over-year earnings ex. ident. items; unit line: Million USD. No printed value axis or gridlines; values are printed above or inside each bar. Bars left to right with printed values: 2023 ex. ident. items $ 11,998 (blue total bar, #0C479D, full height from baseline to about 36.3% of slide height); Margin (6,280) (red decrease bar #C00000, hanging from top of 2023 level down to about 57.4%); Advantaged projects volume 140 (green increase bar #00A14D, thin, at about 57.0%); Base volume (1,240) (red decrease, about 57.0% to 61.1%); Structural cost savings 630 (green increase, about 58.9% to 61.1%); Expenses (970) (red decrease, about 58.9% to 62.3%); Other (320) (red decrease, about 62.3% to 63.4%, value printed below bar); Timing effects (10) (very thin pinkish-red bar about 63.4%, value printed below); 2024 ex. ident. items $ 3,954 (blue total bar from baseline to about 63.4%). Connector lines are not drawn between bars. Legend: none. Highlighted points: none; colour codes increases green and decreases red. Brackets: a thin grey bracket under Advantaged projects volume and Base volume labelled Volume / mix; a thin grey bracket under Timing effects with two sub-lines 2023: $50M and 2024: $40M. Baseline: thin dark grey horizontal axis line from about 4.1% to 64.6% at about 76.6%.
Slide 17
2024 vs. 2023: Chemical Products
Earnings growth driven by advantaged
footprint and high-value product sales
Chemical Products year-over-year earnings ex. ident. items
Million USD
$ 2,025
Margin
890
High-value
products
volume
410
Base
volume
(270)
Structural
cost savings
190
Expenses
(490)
Other
(80)
$ 2,672
2023
ex. ident.
items
2024
ex. ident.
items
Volume / mix
See page 9 and supplemental information for definitions and reconciliations.
Improved margins on
North America
feed advantage and
higher realizations
Record high-value
product sales
Portfolio optimization
drove lower base volumes
Structural cost savings
more than offset inflation
Higher advantaged
project spend
17
Visuals: Chart: vertical waterfall (bridge) chart titled 'Chemical Products year-over-year earnings ex. ident. items', axis unit 'Million USD', no visible numeric axis scale or gridlines; values are printed on each bar. Categories left to right: 2023 ex. ident. items total $ 2,025 (blue, total bar); Margin +890 (green, floating up); High-value products volume +410 (green); Base volume (270) (red, floating down); Structural cost savings +190 (green); Expenses (490) (red); Other (80) (red, thin); 2024 ex. ident. items total $ 2,672 (blue, total bar). A bracket under High-value products volume and Base volume is labelled 'Volume / mix'. Totals are shown above the bars in bold, deltas inside (positive green bars, positive values in white text) or above/below the bar (negative values in grey in parentheses below red bars). No legend. No highlighted points beyond the colour coding of increases (green) and decreases (red). Bars share a common baseline at the horizontal black axis line. Bar values are exact as printed; no estimates.
Slide 18
2024 vs. 2023: Specialty Products
High-margin differentiated products yield / consistently strong earnings
Specialty Products year-over-year earnings ex. ident. items
Million USD
$ 2,807
590
70
130
(10)
(300)
(220)
$ 3,065
2023 / ex. ident. / items
Margin
High-value / products / volume
Base / volume
Structural / cost savings
Expenses
Other
2024 / ex. ident. / items
Volume / mix
Delivered record earnings / ex. identified items1
Results driven by mix / improvement, revenue / management, and / optimization
Higher new product / development spend
Other reflects unfavorable / forex and absence of / favorable 2023 year-end / inventory effects
See page 9 and supplemental information for footnotes, definitions, and reconciliations.
18
Visuals: Chart: waterfall bar chart titled 'Specialty Products year-over-year earnings ex. ident. items', units Million USD, no printed axis scale or gridlines; the baseline is a thin dark grey horizontal line. Bars left to right with printed values: 2023 ex. ident. items $ 2,807 (total bar, blue #0C479D, full height from baseline); Margin +590 (green #00A14D floating bar, value printed inside the bar in white); High-value products volume +70 (thin green floating bar, value printed above); Base volume (10) (very thin red #C00000 line, value printed below); Structural cost savings +130 (green floating bar, value above); Expenses (300) (red #C00000 floating bar, value in white inside); Other (220) (red #C00000 floating bar, value in white inside); 2024 ex. ident. items $ 3,065 (total bar, blue #0C479D, value printed above). Only the printed values are given; bar heights are not scaled numerically. A thin grey bracket beneath High-value products volume and Base volume is labelled 'Volume / mix'. No legend; no points highlighted beyond colour coding (green increases, red decreases, blue totals).
Slide 19
4Q24 vs. 3Q24: Upstream
Continued strong earnings driven by
record advantaged asset production
Upstream quarter-on-quarter earnings ex. ident. items
Million USD
$ 6,158
(410)
310
(200)
110
(120)
470
(40)
$ 6,283
4Q24 production of
4.6 Moebd; record Guyana
and Permian volumes
Higher gas prices partially
offset lower liquids
realizations
Other reflects favorable
tax impacts
3Q24
ex. ident.
items
Price
Advantaged
assets
volume
Base
volume
Structural
cost savings
Expenses
Other
Timing
effects
4Q24
ex. ident.
items
3Q24: ($70M)
4Q24: ($110M)
Volume / mix
See page 10 and supplemental information for definitions and reconciliations.
19
Visuals: Waterfall chart titled 'Upstream quarter-on-quarter earnings ex. ident. items', unit 'Million USD', with no visible y-axis scale or gridlines; a single horizontal baseline runs across the bottom of the bars. Bars from left to right: 3Q24 ex. ident. items total $ 6,158 (solid blue #0C479D, full height from baseline); Price (410) (red #C00000, floating down); Advantaged assets volume 310 (green #00A14D, floating up); Base volume (200) (red, floating down); Structural cost savings 110 (green, floating up); Expenses (120) (red, floating down); Other 470 (green, floating up); Timing effects (40) (thin red bar, floating down); 4Q24 ex. ident. items total $ 6,283 (solid blue, full height). Value labels: positive values in green bars are printed inside the bar in white (310, 470) or above the bar in grey (110); negative values in red bars are printed inside in white ((410), (200)) or below the bar in grey ((120)) and above in grey for (40); totals are printed above their bars in bold dark grey. No legend; colour alone encodes direction (blue total, green increase, red decrease). Brackets: a thin grey bracket spans Advantaged assets volume and Base volume beneath the category labels, labelled 'Volume / mix' with a short centre tick; a second thin grey bracket sits under 'Timing effects' with the notes '3Q24: ($70M)' and '4Q24: ($110M)' below it. No highlighted points beyond the colour coding. Bar geometry as percentages of slide: 3Q24 total bar x 4.9 y 36.0 w 5.2 h 40.6; Price bar x 11.6 y 36.0 w 5.2 h 7.7; Advantaged bar x 18.3 y 37.9 w 5.2 h 5.9; Base bar x 25.0 y 37.9 w 5.2 h 3.7; Structural bar x 31.7 y 39.6 w 5.2 h 2.0; Expenses bar x 38.5 y 39.6 w 5.2 h 2.1; Other bar x 45.2 y 33.0 w 5.2 h 8.8; Timing bar x 51.9 y 33.0 w 5.2 h 0.7; 4Q24 total bar x 58.6 y 33.7 w 5.2 h 42.9.
Slide 20
4Q24 vs. 3Q24: Energy Products / Operational excellence underpins solid results in lower-margin environment / Energy Products quarter-on-quarter earnings ex. ident. items / Million USD / $ 1,309 / (340) / 0 / 100 / 20 / (270) / 240 / (740) / $ 323 / 3Q24 ex. ident. items / Margin / Advantaged projects volume / Base volume / Structural cost savings / Expenses / Other / Timing effects / 4Q24 ex. ident. items / 3Q24: $560M / 4Q24: ($180M) / Volume / mix / See page 10 and supplemental information for definitions and reconciliations. / Lower margins driven by North America / Base volumes higher on strong reliability and Joliet recovery from tornado / Other reflects favorable year-end inventory and asset management impacts / Negative timing effects driven by crude price increase and absence of prior-quarter favorable MTM impacts / 20 / ExxonMobil
Visuals: Waterfall chart titled 'Energy Products quarter-on-quarter earnings ex. ident. items', unit 'Million USD', with no printed axis, scale or gridlines. Bars left to right with printed values: 3Q24 ex. ident. items $1,309 (total, blue); Margin (340) (negative, red); Advantaged projects volume 0 (flat, green hairline); Base volume 100 (positive, green); Structural cost savings 20 (positive, green); Expenses (270) (negative, red); Other 240 (positive, green); Timing effects (740) (negative, red, tallest drop, annotated beneath with 3Q24: $560M and 4Q24: ($180M)); 4Q24 ex. ident. items $323 (total, blue). Values are printed on all bars, so no estimates are needed beyond bar heights, which are drawn to scale of the printed values. A thin dark grey horizontal baseline runs under the bars. A thin grey bracket spans Advantaged projects volume and Base volume beneath the category labels, labelled 'Volume / mix'. A thin grey bracket spans Timing effects with the two annotations below it. No legend. No highlighted points beyond colour coding of totals, increases and decreases. Logo: ExxonMobil wordmark in white at bottom right, with a thin cyan vertical rule before the page number.
Slide 21
4Q24 vs. 3Q24: Chemical Products / Generating positive earnings and cash flow / at bottom-of-cycle conditions / Chemical Products quarter-on-quarter earnings ex. ident. items / Million USD / $ 893 / (430) / (10) / (40) / 0 / (150) / (50) / $ 215 / 3Q24 / ex. ident. / items / Margin / High-value / products / volume / Base / volume / Structural / cost savings / Expenses / Other / 4Q24 / ex. ident. / items / Volume / mix / See page 10 and supplemental information for definitions and reconciliations. / Margins declined on / higher feed costs in / North America / Seasonally lower sales / volumes / Higher seasonal expenses / and China Chemical / Complex start-up / preparation / ExxonMobil / 21
Visuals: Chart: waterfall bar chart titled 'Chemical Products quarter-on-quarter earnings ex. ident. items', units Million USD, no visible numeric axis or gridlines; values are printed on each bar. Categories left to right: 3Q24 ex. ident. items $893 (blue, total bar, full height from baseline to top); Margin (430) (red, floating down from 893); High-value products volume (10) (red, thin sliver); Base volume (40) (red); Structural cost savings 0 (thin light-green line, no bar height); Expenses (150) (red); Other (50) (red); 4Q24 ex. ident. items $215 (blue, total bar from baseline). Bracket under High-value products volume and Base volume labelled 'Volume / mix'. Legend: none. Highlighted points: none beyond the colour coding of blue totals and red decreases. Right panel contains three white statements separated by two white horizontal rules; no photograph or icon.
Slide 22
4Q24 vs. 3Q24: Specialty Products / Portfolio of high-value products reliably / delivering strong earnings / Specialty Products quarter-on-quarter earnings ex. ident. items / Million USD / $ 794 / 60 / (30) / (30) / 0 / (130) / 100 / $ 759 / 3Q24 / ex. ident. / items / Margin / High-value / products / volume / Base / volume / Structural / cost savings / Expenses / Other / 4Q24 / ex. ident. / items / Volume / mix / Higher margins offset / seasonally lower / basestocks sales / Seasonally higher / expenses and new / product development / spend / Favorable year-end / inventory and tax impacts / See page 10 and supplemental information for definitions and reconciliations. / 22
Visuals: Vertical waterfall bar chart titled 'Specialty Products quarter-on-quarter earnings ex. ident. items' with unit 'Million USD'; no y-axis scale, gridlines or axis ticks are printed. Dark grey #404040 baseline runs across the bottom of the bars at about 76.6% of slide height. Series, left to right: 3Q24 ex. ident. items total $ 794 (blue bar #0C479D); Margin +60 (green #00A14D); High-value products volume (30) (red #C00000); Base volume (30) (red #C00000); Structural cost savings 0 (flat grey hairline, no bar); Expenses (130) (red #C00000); Other 100 (green #00A14D); 4Q24 ex. ident. items total $ 759 (blue bar #0C479D). Totals are blue, increases green, decreases red; values are printed inside the bars, totals printed above them in bold dark grey. A thin bracket under the High-value products volume and Base volume columns is labelled Volume / mix. No legend and no other highlighted points. Right-hand panel contains only text statements and rules. Bottom-right ExxonMobil wordmark in white with a stylised X and a thin light-blue vertical rule before the page number.
Slide 23
1Q25 maintenance outlook
Upstream scheduled maintenance earnings impact1
Million USD
900
600
300
0
~230
~310
~400
~310
-180
130
-220
90
1Q24
2Q24
3Q24
4Q24
1Q25 est.
Product Solutions scheduled maintenance earnings impact2
Million USD
900
600
300
0
~30
~150
~750
~30
~170
~590
~30
~190
~280
~30
~190
~250
+280
~750
+90
~560
1Q24
2Q24
3Q24
4Q24
1Q25 est.
Energy Products
Chemical Products
Specialty Products
Total Product Solutions Outlook
See supplemental information for footnotes.
ExxonMobil
23
Visuals: Two bar charts. Left chart: Upstream scheduled maintenance earnings impact (footnote 1), Million USD, y-axis 0 to 900 with gridline labels 0, 300, 600, 900 (no gridlines); x-axis categories 1Q24, 2Q24, 3Q24, 4Q24, 1Q25 est.; single series, dark blue #0C479D solid bars with printed values 1Q24 ~230, 2Q24 ~310, 3Q24 ~400, 4Q24 ~310; for 1Q25 est. no bar, instead a grey dashed diagonal line from top of 4Q24 bar down-right with printed labels -180 (upper), 130, -220 (lower) and a grey I-beam range marker labelled 90 beneath it. No legend. No highlighted points. Right chart: Product Solutions scheduled maintenance earnings impact (footnote 2), Million USD, y-axis 0 to 900 with labels 0, 300, 600, 900; stacked columns for 1Q24, 2Q24, 3Q24, 4Q24 with segments Energy Products (#00A3E0, bottom) labelled ~750, ~590, ~280, ~250; Chemical Products (#37CBFF, middle) labelled ~150, ~170, ~190, ~190; Specialty Products (#B4ECFF, top) with total labels ~30 above each stack. Top of 1Q24 stack about 930 (printed ~30 only). For 1Q25 est. there is no column; a grey dashed fan from top of 4Q24 stack to a grey I-beam range marker with labels ~750 (top), +280 (upper left), +90 (lower right), ~560 (bottom). Legend below chart in two columns: Energy Products (square #00A3E0), Chemical Products (square #37CBFF), Specialty Products (square #B4ECFF), Total Product Solutions Outlook (grey I-beam symbol). Logo: ExxonMobil red wordmark bottom-right with a thin blue vertical rule before page number 23.
Slide 24
Enhanced disclosures and transparency
Modeling Toolkit
(located in Investors section of our website)
What is included?
Sensitivities and Key Assumptions
Interactive Analyst Center
‘How to model XOM’ Overview
Earnings sensitivities
for Upstream,
Energy Products, and
Chemical Products
Platform containing
select historical and
forward-looking financial
and operating data
Guide to modeling
ExxonMobil earnings and
cash flow growth plans
24
Visuals: Four images. (1) Screenshot of the ExxonMobil website 'Modeling Toolkit' page, boxed with a thin light-grey border at x 2.8, y 17.9, w 32.3, h 39.4 (948 by 650 px). Top band: a dark, blue-tinted photograph of a modern glass and steel building with a darkened overlay, with the white text 'Modeling Toolkit' at left-centre. Top navigation bar in white with small dark text and red ExxonMobil wordmark at left: Overview, News & events, Company info, Earnings, Stock info, SEC filings, Sustainability, Modeling Toolkit (red underline). Below the band on white: the line 'Key public information to assist with financial modeling of ExxonMobil.' centred, followed by a list of red underlined links with icons at right: Modeling Basics (PDF icon, PDF); Sensitivities and Key Assumptions (PDF icon, PDF); Interactive Analyst Center (HTML icon, HTML); Disclosure Library (HTML icon, HTML); Frequently used terms (PDF icon, PDF); Events Library (HTML icon, HTML); Sustainability Metrics and Data (HTML icon, HTML). (2) Thumbnail at x 2.8, y 64.3, w 19.5, h 19.5 (572 by 322 px) of a spreadsheet-style page titled 'Sensitivities and Key Assumptions' with a blue header bar, tables of 'Annual Earnings Sensitivities' and '1Q25 Key Items' in small grey text and an ExxonMobil logo at bottom right. (3) Thumbnail at x 23.5, y 64.3, w 19.5, h 19.5 (572 by 322 px) of a white spreadsheet-like page titled 'Interactive Analyst Center' with a left navigation menu, a dense grid of income-statement rows and columns with small grey and black figures, and a left blue-accent sidebar of export and chart buttons. (4) Thumbnail at x 44.2, y 64.3, w 19.5, h 19.5 (520 by 292 px) of a cover photograph: a modern multi-storey glass office building with a grey-blue sky, shown in a cool blue-grey tint, with the white title 'ExxonMobil / Modeling Basics' at left, the subtitle 'How to model earnings and cash flow growth plans' beneath in smaller white text, 'December 2024' in italic at bottom left, and the ExxonMobil wordmark at bottom right. No chart or table elements on the main canvas.
Slide 25
Upstream
Project details
Location
Projects
Gross Investment Basis Capacity1
Next Milestone
Guyana
Yellowtail
Uaru
Whiptail
Hammerhead
Longtail
+250 Kbd
+250 Kbd
+250 Kbd
+150 Kbd
+240 Kbd
Start-up in 2025
Start-up in 2026
Start-up in 2027
FID in 2025
FID in 2027
LNG
Golden Pass
Papua
Rovuma
+16 MTA
+6 MTA
+18 MTA
Start-up in 2025
FID in 2025
FID in 2026
Brazil
Bacalhau
+220 Kbd
Start-up in 2025
1 LNG projects name plate capacity is based on external basis (MTA annual average).
See supplemental information for definitions.
ExxonMobil
25
Visuals: Table with four columns: Location, Projects, Gross Investment Basis Capacity (with superscript 1), Next Milestone. Row group 1 Guyana: Projects Yellowtail, Uaru, Whiptail, Hammerhead, Longtail; capacity +250 Kbd, +250 Kbd, +250 Kbd, +150 Kbd, +240 Kbd; milestones Start-up in 2025, Start-up in 2026, Start-up in 2027, FID in 2025, FID in 2027. Row group 2 LNG: Projects Golden Pass, Papua, Rovuma; capacity +16 MTA, +6 MTA, +18 MTA; milestones Start-up in 2025, FID in 2025, FID in 2026. Row group 3 Brazil: Project Bacalhau; capacity +220 Kbd; milestone Start-up in 2025. Cell text is white, centred in each cell. Thin vertical lines in a lighter blue separate the columns. The ExxonMobil logo is a red wordmark with a blue vertical divider bar before the page number.
Slide 26
Product Solutions / Project details / Aggregate investment basis / Estimated / Product Solutions Segment / Projects / volume/capacity impact / start-up timing / +1,650 Kta Polyethylene Capacity / Chemical Products / China Chemical Complex / 2025 / +850 Kta Polypropylene Capacity / +37 Kbd Low-Sulfur Diesel, / Energy Products / Fawley Hydrofiner / 2025 / -16 Kbd Other Products, including High-Sulfur Distillates / Energy Products, Chemical Products, / +20 Kbd Group II Basestocks, +50 Kbd Distillate / Singapore Resid Upgrade / 2025 / Specialty Products / -80 Kbd Fuel Oil / Energy Products / Strathcona Renewable Diesel / +20 Kbd Renewable Diesel / 2025 / Multiple from / Chemical Products / Advanced Recycling / +460 Kta Waste Plastic Recycling Capacity / 2025-2027 / Energy Products / U.S. Gulf Coast Asset Reconfiguration / +40 Kbd Distillate, -40 Kbd Gasoline / 2028-2030 / Energy Products / Next Renewable Fuels / +10 Kbd Renewable Fuels / 2028-2030 / Product Solutions Segment / New Businesses / Aggregate investment basis / volume/capacity impact / Estimated / start-up timing / Multiple from / Specialty Products / Proxxima™ Resin Systems / +190 Kta Proxxima™ Polyolefin Thermoset Resin Systems Capacity / 2025-2030 / Specialty Products / Advanced Coke for Battery Anode / Materials (Carbon Materials) / +30 Kta Advanced Coke / 2028-2030 / See supplemental information for definitions. / 26 / ExxonMobil
Visuals: One table occupying most of the slide, in two blocks. Block 1 (upper) has a header row and seven body rows with columns Product Solutions Segment, Projects, Aggregate investment basis volume/capacity impact, Estimated start-up timing. Rows: (1) Chemical Products | China Chemical Complex | +1,650 Kta Polyethylene Capacity and +850 Kta Polypropylene Capacity | 2025. (2) Energy Products | Fawley Hydrofiner | +37 Kbd Low-Sulfur Diesel, and -16 Kbd Other Products, including High-Sulfur Distillates | 2025. (3) Energy Products, Chemical Products, Specialty Products | Singapore Resid Upgrade | +20 Kbd Group II Basestocks, +50 Kbd Distillate and -80 Kbd Fuel Oil | 2025. (4) Energy Products | Strathcona Renewable Diesel | +20 Kbd Renewable Diesel | 2025. (5) Chemical Products | Advanced Recycling | +460 Kta Waste Plastic Recycling Capacity | Multiple from 2025-2027. (6) Energy Products | U.S. Gulf Coast Asset Reconfiguration | +40 Kbd Distillate, -40 Kbd Gasoline | 2028-2030. (7) Energy Products | Next Renewable Fuels | +10 Kbd Renewable Fuels | 2028-2030. Block 2 (lower) has the same four column headers except the second is New Businesses, and three rows: (1) Specialty Products | Proxxima™ Resin Systems | +190 Kta Proxxima™ Polyolefin Thermoset Resin Systems Capacity | Multiple from 2025-2030. (2) Specialty Products | Advanced Coke for Battery Anode Materials (Carbon Materials) | +30 Kta Advanced Coke | 2028-2030. No charts, photographs or icons. The only logo is the ExxonMobil wordmark in the bottom-right corner.
Slides 27 to 47 continue in the full text file.
Download this deck
The hosted PDF of every library deck is free for readers of the SlideDeck Co newsletter. Join with your email and the viewer and download appear here.
Preparing a results presentation or business update of your own? The SlideDeck Co Standard Deck is a slide library for business reviews, updates and plans.







