
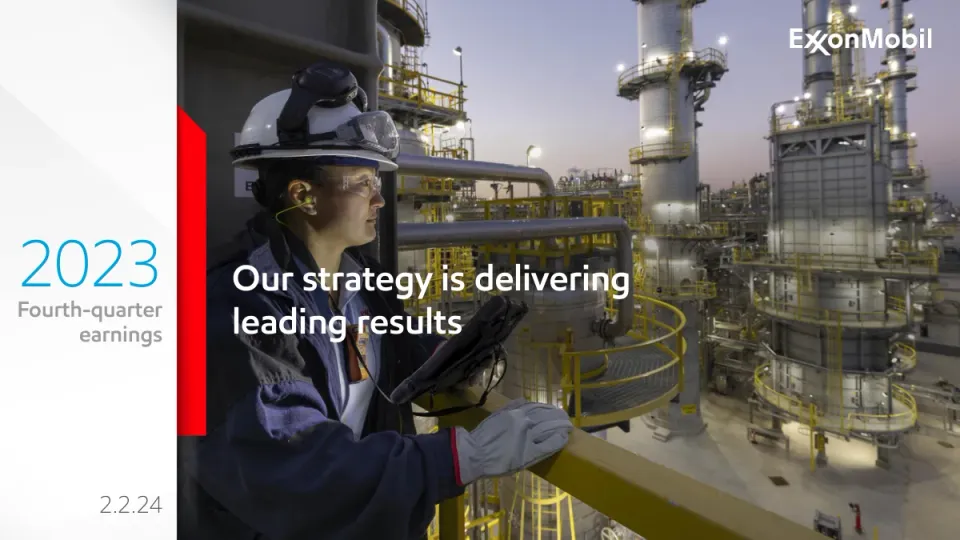
The deck opens with a title slide reading 'Our strategy is delivering leading results' for the fourth-quarter 2023 earnings call, dated 2.2.24. It then sets out legal notices on the proposed Pioneer Natural Resources transaction, a cautionary statement on forward-looking statements, and a summary slide listing performance themes such as safety, financial results, portfolio, innovative solutions and development. The middle section covers production growth and emissions progress, energy and chemical market conditions, and full-year and fourth-quarter financial results with earnings bridges by segment. Segment slides for Upstream, Energy Products, Chemical Products and Specialty Products each pair a waterfall chart of earnings drivers with short bullet commentary. Later sections cover capital allocation, project delivery, the 2024 outlook and a Q&A slide. The appendix holds supplemental information with definitions, non-GAAP reconciliations and cash flow tables. Slides worth studying are the segment waterfall charts and the financial overview tiles, which carry the headline numbers large and let short captions do the explaining.
Slides worth studying
- Slide 8: A dense earnings bridge table is kept readable by consistent column alignment and bold totals rows that give the eye clear anchors.
- Slide 10: The waterfall chart with colour-coded positive and negative steps shows the drivers of change in one glance, paired with three short bullets.
- Slide 7: Large numeric tiles with small captions and photography create a clear financial summary that reads quickly from a distance.
Details
- Company: ExxonMobil
- Year: 2024
- Type: Investor presentation
- Industry: Energy
- Pages: 40
The hosted copy of this deck is being prepared. Newsletter readers will find the download here.
Review score: 8 out of 10, Strong
Presentation quality, judged with the SlideDeck Co review heuristic. Ask, evidence and idea merit are not rated here.
The strength is reconciliation that runs through the whole deck. Slide 7 gives six headline figures and immediately qualifies earnings of "$36B" with "Earnings ex. ident. items of $38.6 billion", slide 8 walks 2022 GAAP earnings of $55.7 to 2023 GAAP of $36.0 with each identified item on its own row, and slide 9 does the same for the quarter. Every segment bridge on slides 10 to 13 and 21 to 24 carries causes and a page reference, slides 15 and 20 separate the outlook, and slide 29 goes as far as defining "Industry-leading performance" and naming the peer group. The bottleneck is tone and a few loose ends: slide 8 is titled "Excellence in execution consistently driving industry-leading results" over a table of falling earnings, slide 7 repeats "leading peers" in five of six tiles, and slide 15 leaves the Chemical Products and Specialty Products rows blank.
Worth keeping: Keep the full-year and quarter reconciliation tables on slides 8 and 9 and the on-page definition of comparative terms on slide 29.
Most useful repair: Retitle slides 8 and 22 to state the year-over-year change shown, and either fill or remove the empty outlook rows on slide 15.
What would change the score: If a reader takes the titles as the summary and does not read the tables, the gap between headline and exhibit on slides 8 and 22 becomes the main impression and the score would be 7.
Confidence medium. 40 of 40 pages inspected on contact sheets, 12 at readable size. Reviewed 2026-11-15. Model-assisted review (claude-fable-5-2, in session).
Full text of the slides (40 slides)
Every slide's words and a description of its charts and images, so the deck can be searched and rebuilt. Also available as Markdown.
Slide 1
2023 / Fourth-quarter / earnings / Our strategy is delivering / leading results / ExxonMobil / 2.2.24
Visuals: One photograph filling the right of the slide, full-bleed to the top, bottom and right edges, partly hidden behind the white left panel. Subject: a female plant worker in a white hard hat with clear safety goggles, a green earplug cord, a navy jacket with dark shoulder panels and grey leather gloves, holding a black handheld tablet and resting on a yellow handrail while looking left. Behind her is a refinery at dusk with tall grey steel distillation columns, yellow access platforms and handrails, grey pipes, and a lavender-to-pale-blue dusk sky. Lighting is warm artificial light on the worker and columns against the cool sky. Composition: medium close-up on the worker in the left-centre, with the columns receding to the right. Dominant colours: navy, white, yellow, steel grey and lavender. A red vertical bar sits on the left edge of the photograph, overlapping the boundary between the white panel and the image. The ExxonMobil wordmark is a white logo, with the X drawn as a stylised cross. The file also lists a 24 by 272 pixel image at x 0 and y 2.5 percent, which does not appear as a distinct visible element on the slide.
Slide 2
Important information for investors and stockholders / IMPORTANT INFORMATION ABOUT THE PROPOSED TRANSACTION AND WHERE TO FIND IT / In connection with the proposed transaction between Exxon Mobil Corporation (the “Company”) and Pioneer Natural Resources Company (“Pioneer”), the Company and Pioneer have filed and will file relevant materials with the Securities and Exchange Commission (the “SEC”). On November 21, 2023, the Company filed with the SEC a registration statement on Form S-4 (the “Form S-4”), as amended (No. 333-275695) to register the shares of the Company common stock to be issued in connection with the proposed transaction. The Form S-4, which was declared effective by the SEC on January 5, 2024, includes a definitive proxy statement of Pioneer that also constitutes a prospectus of the Company (the “definitive proxy statement/prospectus”). The definitive proxy statement/prospectus was mailed to the stockholders of Pioneer on January 8, 2024. This communication is not a substitute for the Form S-4, definitive proxy statement/prospectus or any other document that the Company or Pioneer (as applicable) has filed or may file with the SEC in connection with the proposed transaction. BEFORE MAKING ANY VOTING OR INVESTMENT DECISION, INVESTORS AND SECURITY HOLDERS OF THE COMPANY AND PIONEER ARE URGED TO READ THE FORM S-4, THE DEFINITIVE PROXY STATEMENT/PROSPECTUS FILED WITH THE SEC AND ANY OTHER RELEVANT DOCUMENTS THAT ARE FILED OR WILL BE FILED WITH THE SEC, AS WELL AS ANY AMENDMENTS OR SUPPLEMENTS TO THESE DOCUMENTS, CAREFULLY AND IN THEIR ENTIRETY WHEN THEY BECOME AVAILABLE BECAUSE THEY CONTAIN OR WILL CONTAIN IMPORTANT INFORMATION ABOUT THE PROPOSED TRANSACTION AND RELATED MATTERS. Investors and security holders may obtain free copies of the Form S-4 and the definitive proxy statement/prospectus, as well as other filings containing important information about the Company or Pioneer, without charge at the SEC’s Internet website (http://www.sec.gov). Copies of the documents filed with the SEC by the Company are and will be available free of charge on the Company’s internet website at www.exxonmobil.com under the tab “investors” and then under the tab “SEC Filings” or by contacting the Company’s Investor Relations Department at [email protected]. Copies of the documents filed with the SEC by Pioneer are and will be available free of charge on Pioneer’s internet website at https://investors.pxd.com/investors/financials/sec-filings/. The information included on, or accessible through, the Company’s or Pioneer’s website is not incorporated by reference into this communication. / PARTICIPANTS IN THE SOLICITATION / The Company, Pioneer, their respective directors and certain of their respective executive officers may be deemed to be participants in the solicitation of proxies in respect of the proposed transaction. Information about the directors and executive officers of Pioneer and a description of their direct or indirect interests, by security holdings or otherwise, is set forth in the Form S-4 in the section entitled “Interests of Pioneer’s Directors and Executive Officers in the Merger”, including the documents incorporated by reference therein. Information about the directors and executive officers of the Company is set forth in the sections entitled “Board of Directors” and “Director and Executive Officer Stock Ownership” included in the Company’s proxy statement for its 2023 annual meeting of stockholders, which was filed with the SEC on April 13, 2023 (and which is available at https://www.sec.gov/Archives/edgar/data/34088/000119312523100079/d429320ddef14a.htm), in the sections entitled “Information about our Executive Officers” and “Directors, Executive Officers and Corporate Governance” included in the Company’s Form 10-K for the year ended December 31, 2022, which was filed with the SEC on February 22, 2023 (and which is available at https://www.sec.gov/Archives/edgar/data/34088/000003408823000020/xom-20221231.htm), in the Company’s Form 8-K filed on June 6, 2023 (and which is available at https://www.sec.gov/Archives/edgar/data/34088/000003408823000036/xom-20230531.htm) and in the Company’s Form 8-K filed on February 24, 2023 (and which is available at https://www.sec.gov/Archives/edgar/data/34088/000003408823000022/xom-20230221.htm). Additional information regarding the participants in the proxy solicitations and a description of their direct or indirect interests, by security holdings or otherwise, are contained in the definitive proxy statement/prospectus and will be contained in other relevant materials filed with the SEC when they become available. / NO OFFER OR SOLICITATION / This communication is for informational purposes and is not intended to, and shall not, constitute an offer to sell or the solicitation of an offer to buy any securities or a solicitation of any vote or approval, nor shall there be any offer, solicitation or sale of securities in any jurisdiction in which such offer, solicitation or sale would be unlawful prior to registration or qualification under the securities laws of any such jurisdiction. No offering of securities shall be made except by means of a prospectus meeting the requirements of Section 10 of the U.S. Securities Act of 1933, as amended. / 2
Visuals: Non-text visuals: an ExxonMobil logo (red wordmark) at top right; a solid red vertical accent bar on the left edge running from about 2.5% to 20.7% of the height; and a very faint light-grey geometric, angular background pattern across the white slide. No charts, photographs or tables.
Slide 3
Cautionary statement / FORWARD-LOOKING STATEMENTS. Statements of future events, conditions, expectations, plans or ambitions in this presentation or the subsequent discussion period are forward-looking / statements. Similarly, discussions of future carbon capture, transportation, and storage, as well as biofuels, hydrogen, and other plans to reduce emissions of ExxonMobil, its affiliates, or companies / it is seeking to acquire, are dependent on future market factors, such as continued technological progress, policy support and timely rule-making and permitting, and represent forward-looking / statements. Actual future results, including financial and operating performance; potential earnings, cash flow, and rates of return; total capital expenditures and mix, including allocations of capital / to low carbon investments; realization and maintenance of structural cost reductions and efficiency gains, including the ability to offset inflationary pressures, plans to reduce future emissions / intensity; ambitions to reach Scope 1 and Scope 2 net zero from operated assets by 2050, to reach Scope 1 and 2 net zero in Upstream Permian Basin unconventional operated assets by 2030 and / Pioneer Permian assets by 2035, to eliminate routine flaring in-line with World Bank Zero Routine Flaring, to reach near-zero methane emissions from operated assets and other methane initiatives, / to meet ExxonMobil’s emission reduction plans and goals, divestment and start-up plans, and associated project plans as well as technology advances, including in the timing and outcome of / projects to capture and store CO2, produce hydrogen, produce biofuels, produce lithium, and use plastic waste as feedstock for advanced recycling; maintenance and turnaround activity; drilling and / improvement programs; price and margin recovery; shareholder distributions; planned Pioneer or Denbury integration benefits; resource recoveries and production rates; and product sales levels / and mix could differ materially due to a number of factors. These include global or regional changes in oil, gas, petrochemicals, or feedstock prices, differentials, seasonal fluctuations, or other / market or economic conditions affecting the oil, gas, and petrochemical industries and the demand for our products; government policies supporting lower carbon investment opportunities such as / the U.S. Inflation Reduction Act or policies limiting the attractiveness of investments such as European taxes on energy and unequal support for different methods of carbon capture; policy and / consumer support for emission-reduction products and technology; variable impacts of trading activities; the outcome of competitive bidding and project wins; regulatory actions targeting public / companies in the oil and gas industry; changes in local, national, or international laws, regulations, and policies affecting our business including with respect to the environment; taxes, trade / sanctions, and actions taken in response to pandemic concerns; the ability to realize efficiencies within and across our business lines and to maintain current cost reductions as efficiencies without / impairing our competitive positioning; decisions to invest in future reserves; reservoir performance, including variability in unconventional projects; the level, outcome, and timing of exploration and / development projects and decisions to invest in future resources; timely completion of construction projects; war, civil unrest, attacks against the company or industry, and other political or security / disturbances; expropriations, seizures, and capacity, insurance or shipping limitations by foreign governments or internation / al embargoes; changes in consumer preferences; opportunities for and / regulatory approval of investments or divestments that may arise such as the Pioneer acquisition; the outcome of our or competitors’ research efforts and the ability to bring new technology to / commercial scale on a cost-competitive basis; the development and competitiveness of alternative energy and emission reduction technologies; unforeseen technical or operating difficulties / including the need for unplanned maintenance; and other factors discussed here and in Item 1A. Risk Factors of our Form 10-K and under the heading “Factors Affecting Future Results” available / through the Investors page of our website at www.exxonmobil.com. All forward-looking statements are based on management’s knowledge and reasonable expectations at the time of this / presentation and we assume no duty to update these statements as of any future date. Neither future distribution of this material nor the continued availability of this material in archive form on our / website should be deemed to constitute an update or re-affirmation of these figures as of any future date. Any future update of these figures will be provided only through a public disclosure / indicating that fact. / The Pioneer transaction (merger) referenced throughout this presentation is subject to customary regulatory reviews and approvals, and approval by Pioneer shareholders. / Reconciliations and definitions of non-GAAP and other terms are provided in the text or in the supplemental information accompanying these slides beginning on page 26. / 3
Visuals: Decorative faint grey diagonal wedge shapes on a white background image covering the whole slide, a red vertical accent bar on the left edge at the top, and the ExxonMobil red wordmark logo at top right. There are no charts, tables, photographs or diagrams.
Slide 4
Meeting society's needs and growing shareholder value
ExxonMobil
Leading Performance | Essential Partner | Advantaged Portfolio | Innovative Solutions | Meaningful Development
Demonstrating strong safety, operational, and reliability performance
Continuing improvement in process safety; sustained our industry-leading personnel safety performance1
Record refining reliability and project execution at industry-leading cost and schedule performance2
Delivering industry-leading financial results
Earnings of $36 billion driven by consistent strategy and strong execution; 15% ROCE
Improved earnings power with more than doubled earnings versus 2019 on a constant price basis3
Strengthening our advantaged portfolio
Investing in industry-advantaged, high-return opportunities
Making value-accretive acquisitions: Denbury and Pioneer Natural Resources
More than $4 billion of cash generated with divestments of non-core assets
Developing innovative solutions
Potential to produce lithium to supply up to ~1 million EVs per year by 2030
Transforming lower-value fuels into high-value manufacturing materials; ProxximaTM earnings potential of ~$1 billion by 20404
Completed construction of a direct air capture (DAC) prototype piloting proprietary technology
Continuing business transformation and expanding employee development opportunities
See page 8 and Supplemental information for footnotes, definitions, and reconciliations.
4
Visuals: None photographic. A full-width horizontal gradient band runs from red at the left edge through magenta-purple to dark blue at the right edge, carrying the white section navigation line. The ExxonMobil wordmark in red with a stylised X sits top-right. A faint light-grey geometric background texture with diagonal tonal shapes fills the upper and right areas. A thin red vertical bar sits at the top-left edge of the slide.
Slide 5
Increasing supply and reducing emissions / >18% / growth from Guyana and Permian, / reflecting record annual production / 250 Kbd / refining expansion in Beaumont, TX, / contributed to record throughput1 / 750 Kta / performance chemical capacity / expansion in Baytown, TX / >50% / reduction in operated methane / emissions intensity since 20162 / 100% / electrification of operated drilling fleet in / the Permian Basin / 5 Mta / CO2 under contract to be captured and / permanently stored for third parties / See Supplemental information for footnotes and definitions. / 5
Visuals: Decorative background photograph-like image of a very faint light-grey abstract geometric pattern of diagonal angular shapes on white, covering the full slide. A short vertical red bar, about 0.9% wide and 18% tall, sits at the left edge under the top. The ExxonMobil wordmark logo in red is at top-right. No charts, tables or photographs of subjects. Thin light-grey hairline dividers (about #E6E6E6) form the grid. Pale grey tint over the pattern, no overlay.
Slide 6
Energy markets normalizing in 2023; integrated | portfolio resilient across price / margin cycles | ExxonMobil | Industry prices / margins | 10-year annual range1 | 2023: | • Energy prices and refining margins moving to more typical levels with record liquids demand met by supply growth | • Chemical margins remained bottom-of-cycle due to supply additions outpacing continued demand growth | 4Q: | • Natural gas prices increased on seasonally higher demand | • Refining margins declined on seasonally lower demand | • Chemical margins improved on lower U.S. Gulf Coast feed costs | Crude prices2 ($/bbl) | Natural gas prices3 ($/mbtu) | Refining margins4 ($/bbl) | Chemical margins5 ($/tonne) | 2022 | 2023 | 3Q23 | 4Q23 | 10-year annual range (2010-2019) | See Supplemental information for footnotes. | Natural gas prices and refining margins for 2022 and 3Q23 not to scale outside of 10-year annual range. | 6
Visuals: Chart: a categorical dot-and-box chart titled 'Industry prices / margins' with subtitle '10-year annual range' (superscript 1). It has four categories along the horizontal axis: Crude prices (superscript 2, $/bbl), Natural gas prices (superscript 3, $/mbtu), Refining margins (superscript 4, $/bbl), and Chemical margins (superscript 5, $/tonne). The vertical axis is an unlabelled thin grey line from about y 29 to 74 percent with a small break mark near y 41 percent; no numeric scale or tick values are printed, so all positions are relative only. Each category has a grey rectangle (#B5B5B5) spanning about y 47.3 to 58.5 percent representing the 10-year annual range (2010-2019). Series: 2022 black diamonds, 2023 red diamonds, 3Q23 green circles, 4Q23 blue circles. Crude prices: about 2022 slightly above the box middle at about y 49 percent, about 3Q23 and 2023 near y 51 to 52 percent, about 4Q23 near y 52 percent, all inside the box. Natural gas prices: 2022 well above the box at about y 32 percent, 2023 about y 44 percent, 4Q23 about y 45 percent, 3Q23 inside the box at about y 51 percent. Refining margins: 2022 about y 36 percent, 3Q23 about y 39.5 percent, 2023 about y 45 percent, 4Q23 inside the box at about y 53 percent. Chemical margins: all four points below the empty box, 2022 about y 65 percent, 2023 about y 67.5 percent, 4Q23 about y 69 percent, 3Q23 about y 71 percent. No points are highlighted. Legend below the chart, left to right: black diamond 2022, red diamond 2023, green circle 3Q23, blue circle 4Q23, grey square '10-year annual range (2010-2019)'. Logo: ExxonMobil wordmark in red at top right. Accent: a short vertical red bar at the far left edge beside the title.
Slide 7
Delivering industry-leading financial results
Earnings
$36
B
Earnings ex. ident. items of $38.6 billion1,
>40% CAGR vs. 2019; leading peers2
Cash flow from operations
$55
B
>15% CAGR vs. 2019; leading peers2
Structural cost savings
$9.7
B
vs. 2019; leading peers3
Share repurchases
$17.5
B
consistent with full-year guidance;
leading peers2
Dividends
$15
B
41 years of consecutive annual dividend
increases; leading peers
Total shareholder return
15
%
CAGR since 2019; leading peers
1 Reconciliation to U.S. GAAP of $36.0 billion on page 8.
Industry peer group includes BP, Chevron, Shell, and TotalEnergies.
Due to rounding to nearest whole or 0.5 billion, numbers presented may not align precisely with the item indicated.
See Supplemental information for footnotes, definitions, and reconciliations.
7
Visuals: Six stat cards and three photographs, no charts or tables. Card 1 Earnings: $36 B, with description Earnings ex. ident. items of $38.6 billion (superscript 1), >40% CAGR vs. 2019; leading peers (superscript 2). Card 2 Cash flow from operations: $55 B, >15% CAGR vs. 2019; leading peers (superscript 2). Card 3 Structural cost savings: $9.7 B, vs. 2019; leading peers (superscript 3). Card 4 Share repurchases: $17.5 B, consistent with full-year guidance; leading peers (superscript 2). Card 5 Dividends: $15 B, 41 years of consecutive annual dividend increases; leading peers. Card 6 Total shareholder return: 15 %, CAGR since 2019; leading peers. Photo 1 (bottom-left): two workers in bright orange flame-resistant coveralls and green hard hats walking along a green-floored walkway beside yellow pipework and yellow railings in an industrial plant; warm yellow and orange tones dominate, full frame, rectangular, no overlay. Photo 2 (bottom-centre): a woman in a white hard hat and navy coverall holding an orange gas detector, and a man in a white hard hat, safety glasses and navy shirt, looking down, set against a tall steel structure and clear blue sky seen from below; blue and grey tones, rectangular, no overlay. Photo 3 (bottom-right): a man with safety glasses and teal gloves working at a white laboratory instrument, with a navy shirt bearing a name badge, background of shelving and grey panels; cool white and teal tones, rectangular, no overlay. ExxonMobil red wordmark logo at top-right. A thin red vertical bar at the left edge.
Slide 8
Excellence in execution consistently driving / industry-leading results
U/S EP CP SP C&F TOTAL
2022 GAAP Earnings / (Loss) $36.5 $15.0 $3.5 $2.4 ($1.7) $55.7
Sakhalin-1 expropriation / charges (2.2) - - - (0.1) (2.3)
Additional European taxes on energy sector (1.4) (0.4) - - - (1.8)
Announced divestments 0.9 - - - - 0.9
Impairments, tax, and other items (0.2) (0.3) - (0.0) 0.4 (0.1)
2022 Earnings / (Loss) ex. identified items (non-GAAP) $39.4 $15.7 $3.5 $2.5 ($2.0) $59.1
Price / margin (14.3) (3.2) (0.9) 0.4 - (17.9)
Volume / mix 1.0 0.1 (0.2) (0.1) - 0.8
Expenses (0.4) (0.5) (0.5) 0.0 - (1.4)
Other 0.3 (0.0) (0.0) 0.0 0.1 0.4
Unsettled derivatives mark-to-market (MTM) (2.4) (0.0) - - - (2.4)
2023 Earnings / (Loss) ex. identified items (non-GAAP) $23.6 $12.0 $2.0 $2.8 ($1.9) $38.6
Additional European taxes on energy sector (0.2) (0.1) - - - (0.2)
Impairments (2.7) - (0.3) (0.1) - (3.0)
Tax items 0.2 0.2 0.1 0.0 0.1 0.6
Announced divestments 0.3 - - - - 0.3
Other - - (0.1) (0.0) - (0.2)
2023 GAAP Earnings / (Loss) $21.3 $12.1 $1.6 $2.7 ($1.8) $36.0
Billions of dollars unless specified otherwise.
Due to rounding, numbers presented above may not add up precisely to the totals indicated.
See Supplemental information for definitions.
8
Visuals: One table with 7 columns (row labels, U/S, EP, CP, SP, C&F, TOTAL) and 22 rows including the header. Row values are as listed in the text: the 2022 GAAP row runs $36.5, $15.0, $3.5, $2.4, ($1.7), $55.7; the 2022 non-GAAP subtotal runs $39.4, $15.7, $3.5, $2.5, ($2.0), $59.1; the 2023 non-GAAP subtotal runs $23.6, $12.0, $2.0, $2.8, ($1.9), $38.6; the 2023 GAAP row runs $21.3, $12.1, $1.6, $2.7, ($1.8), $36.0. Subtotal rows are bold on light grey #D9D9D9 bands with thin black rules above them. Body rows are regular weight with dashes for zero entries. No chart, photo or icon.
Slide 9
Strong performance across all business segments / ExxonMobil / U/S / EP / CP / SP / C&F / TOTAL / 3Q23 GAAP Earnings / (Loss) / $6.1 / $2.4 / $0.2 / $0.6 / ($0.4) / $9.1 / Additional European taxes on energy sector / (0.0) / (0.0) / - / - / - / (0.0) / 3Q23 Earnings / (Loss) ex. identified items (non-GAAP) / $6.1 / $2.5 / $0.2 / $0.6 / ($0.4) / $9.1 / Price / margin / 0.1 / (1.0) / 0.4 / 0.1 / - / (0.4) / Volume / mix / 0.6 / (0.1) / (0.1) / (0.1) / - / 0.3 / Expenses / 0.0 / (0.2) / (0.0) / (0.1) / - / (0.2) / Other / (0.4) / 0.6 / 0.0 / 0.1 / (0.3) / 0.1 / Unsettled derivatives mark-to-market (MTM) / (0.1) / 1.2 / - / - / - / 1.1 / 4Q23 Earnings / (Loss) ex. identified items (non-GAAP) / $6.3 / $3.0 / $0.6 / $0.7 / ($0.6) / $10.0 / Additional European taxes on energy sector / 0.0 / (0.0) / - / - / - / (0.0) / Impairments / (2.7) / - / (0.3) / (0.1) / - / (3.0) / Tax items / 0.2 / 0.2 / 0.1 / 0.0 / 0.1 / 0.6 / Announced divestments / 0.3 / - / - / - / - / 0.3 / Other / - / - / (0.1) / (0.0) / - / (0.2) / 4Q23 GAAP Earnings / (Loss) / $4.1 / $3.2 / $0.2 / $0.7 / ($0.6) / $7.6 / Billions of dollars unless specified otherwise. / Due to rounding, numbers presented above may not add up precisely to the totals indicated. / See Supplemental information for definitions. / 9
Visuals: Table with 7 value columns after a label column: header row (blank label cell, then U/S, EP, CP, SP, C&F, TOTAL) on a blue gradient bar; then rows: 3Q23 GAAP Earnings / (Loss) ($6.1, $2.4, $0.2, $0.6, ($0.4), $9.1); Additional European taxes on energy sector (0.0), (0.0), -, -, -, (0.0); 3Q23 Earnings / (Loss) ex. identified items (non-GAAP) ($6.1, $2.5, $0.2, $0.6, ($0.4), $9.1); Price / margin (0.1, (1.0), 0.4, 0.1, -, (0.4)); Volume / mix (0.6, (0.1), (0.1), (0.1), -, 0.3); Expenses (0.0, (0.2), (0.0), (0.1), -, (0.2)); Other (,(0.4), 0.6, 0.0, 0.1, (0.3), 0.1); Unsettled derivatives mark-to-market (MTM) ((0.1), 1.2, -, -, -, 1.1); 4Q23 Earnings / (Loss) ex. identified items (non-GAAP) ($6.3, $3.0, $0.6, $0.7, ($0.6), $10.0); Additional European taxes on energy sector (0.0, (0.0), -, -, -, (0.0)); Impairments ((2.7), -, (0.3), (0.1), -, (3.0)); Tax items (0.2, 0.2, 0.1, 0.0, 0.1, 0.6); Announced divestments (0.3, -, -, -, -, 0.3); Other (-, -, (0.1), (0.0), -, (0.2)); 4Q23 GAAP Earnings / (Loss) ($4.1, $3.2, $0.2, $0.7, ($0.6), $7.6). Rows with bold totals are shaded light grey #D9D9D9 (rows 1, 3, 7 and last row), the other rows are white. Dark grey rules separate the subtotal rows. Flat, unboxed, no photograph. Logo: red ExxonMobil wordmark. Decorative: faint light grey diagonal geometric shapes on white background.
Slide 10
Upstream: higher-margin volumes driving
profitable growth
ExxonMobil
Upstream
Contributing factors to change in earnings
Million USD
$ 6,139
60
550
20
(450)
$ 6,324
(60)
$ 6,266
3Q23
ex. ident.
items
Price
Volume
/ mix
Expenses
Other
4Q23 ex.
unsettled
derivatives
MTM
Unsettled
derivatives
MTM
4Q23
ex. ident.
items
•
Higher gas prices partly offset by lower liquids price
•
Volume / mix improvement driven by advantaged
Guyana and Permian assets
- ~440 Kbd record quarterly gross production in Guyana as
Payara development comes online ahead of schedule
- Permian volumes improved by ~25 Koebd
•
Other driven by net unfavorable one-time tax items,
forex effects, and year-end inventory effects
See page 9 and Supplemental information for definitions and reconciliations.
10
Visuals: Waterfall chart. Title block above chart: 'Upstream' / 'Contributing factors to change in earnings' / 'Million USD'. Units: million USD. No printed value axis or gridlines; baseline is a thin dark horizontal line at about y 80. Bars run left to right as follows. 1) 3Q23 ex. ident. items: total bar, value $ 6,139, solid blue #0C479D, from baseline up to about y 42.9. 2) Price: increase of 60, green #00A14D, thin bar just above the top of the 3Q23 bar. 3) Volume / mix: increase of 550, green #00A14D, value printed inside the bar in white. 4) Expenses: increase of 20, thin green bar, value printed above. 5) Other: decrease of (450), red #C00000, value printed inside the bar in white. 6) 4Q23 ex. unsettled derivatives MTM: total bar, $ 6,324, solid blue #0C479D. 7) Unsettled derivatives MTM: decrease of (60), thin red bar, value printed below its bar. 8) 4Q23 ex. ident. items: total bar, $ 6,266, solid blue #0C479D. No legend. No points are highlighted beyond the colour coding of increases (green) and decreases (red). Bars are flat with no shadows. Scale is not printed; bar heights are proportional to the printed values.
Slide 11
Energy Products: advantaged portfolio delivering
strong performance
Energy Products
Contributing factors to change in earnings
Million USD
$ 2,475
Margin
(1,340)
Volume
/ mix
(120)
Expenses
(170)
Other
640
$ 1,488
4Q23 ex.
derivative
and price
timing
Unsettled
derivatives
MTM
1,190
Price /
timing
340
$ 3,018
4Q23
ex. ident.
items
3Q23
ex. ident.
items
•
Lower margins driven by seasonally weaker
gasoline demand
•
Continued high-grading of portfolio with
strategic projects and divestments
•
Demonstrated first-quartile turnaround
competitiveness during period of increased
planned maintenance1
•
Other primarily reflects tax, net favorable
year-end inventory, and forex effects
•
Positive unsettled derivatives MTM and full
unwinding of 3Q trading price / timing impacts
due to declining price environment
See page 9 and Supplemental information for footnotes, definitions, and reconciliations.
11
Visuals: Vertical waterfall chart titled 'Energy Products / Contributing factors to change in earnings / Million USD' (no y-axis or gridlines; values printed on or above each bar). Bars left to right: 3Q23 ex. ident. items $ 2,475 (total, blue #0C479D, from baseline up to top at about y 43%); Margin (1,340) (red #C00000, decrease, hanging from about y 43% to 67%); Volume / mix (120) (red, decrease, about 4% wide, y about 63% to 65%); Expenses (170) (red, decrease, y about 65% to 68%); Other 640 (green #00A14D, increase, y about 58% to 68%); 4Q23 ex. derivative and price timing $ 1,488 (total, blue, top at about y 58%); Unsettled derivatives MTM 1,190 (green, increase, y about 40% to 58%); Price / timing 340 (green, increase, y about 35% to 40%); 4Q23 ex. ident. items $ 3,018 (total, blue, top at about y 35%). Values in parentheses are decreases; values with no sign are increases. A dark grey #404040 horizontal baseline runs under all bars at about y 80%. No legend. No highlighted points beyond the colour coding of totals (blue), decreases (red) and increases (green). Bar value labels are white inside the coloured bars for large bars (1,190; 640; 340; (1,340)) and dark grey #434343 above or below the others. Right column contains no visuals other than bullets and a superscript 1 after 'maintenance'.
Slide 12
Chemical Products: performance chemicals and
North American footprint improving earnings
Chemical Products
Contributing factors to change in earnings
Million USD
(130)
40
$ 577
(10)
430
$ 249
3Q23 / ex. ident. / items
Margin
Volume / mix
Expenses
Other
4Q23 / ex. ident. / items
• Strong performance chemicals sales and lower U.S. Gulf Coast feed costs driving improved margin
• Seasonally lower sales volumes, partially offset by Baytown chemical expansion production
• Other reflects favorable tax and year-end inventory effects
See page 9 and Supplemental information for definitions and reconciliations.
12
Visuals: Waterfall chart, Chemical Products, contributing factors to change in earnings, Million USD. The chart has six categories along a horizontal baseline at about 80% of slide height, with the baseline running from about 2.8% to 50.9% of slide width. No y-axis, no gridlines, and no numeric axis range are printed. Bars are labelled with values. Categories left to right: 3Q23 ex. ident. items $249 (blue total bar, #0C479D, value label above in bold); Margin +430 (green #00A14D floating bar, label 430 in white inside the bar, rising from about 32.9% to 62.6% of height); Volume / mix (130) (red #C00000 floating bar, label (130) in white inside the bar, top about 32.9% of height, height about 9.8% of height); Expenses (10) (small red bar about 41.7% to 42.7% of slide height, label (10) below the bar in dark grey); Other 40 (green bar about 39.7% to 42.7% of height, label 40 above the bar in dark grey); 4Q23 ex. ident. items $577 (blue total bar #0C479D, top at about 39.7% of height, bold label above). Bar widths are about 4% of slide width for totals and about 4% for the margin bar. No legend. No highlighted points beyond colour coding: blue for totals, green for positive changes, red for negative changes. Background image is a faint light-grey diagonal texture, not a photograph.
Slide 13
Specialty Products: portfolio of high-value products
consistently delivering solid earnings
Specialty Products
Contributing factors to change in earnings
Million USD
$ 619
120
(50)
(80)
130
$ 743
Margin
Volume / mix
Expenses
Other
3Q23 / ex. ident. / items
4Q23 / ex. ident. / items
•
Margin improvement driven by strong performance lubricants sales and lower feed costs
•
Seasonally lower sales volume
•
Seasonally higher expenses
•
Other primarily reflects favorable year-end inventory effects
See page 9 and Supplemental information for definitions and reconciliations.
13
Visuals: Waterfall chart titled 'Specialty Products / Contributing factors to change in earnings / Million USD', with no printed y-axis, gridlines or scale. Bars run left to right: 3Q23 ex. ident. items total $619 (blue #0C479D, x 4.9%, y 43.2%, w 4.0%, h 36.6%); Margin +120 (green, about #009A44, floating, x 13.8% to 17.8%, top about y 33%, bottom about y 40%); Volume / mix (50) (red #C00000, x 20.9%, y 36.1%, w 12.0%, h 7.6%, floating); Expenses (80) (red #C00000, about x 29.8% to 35.8%, floating just below the volume bar); Other +130 (green, about x 37.9% to 43.9%, floating, top about y 33.5%); 4Q23 ex. ident. items total $743 (blue #0C479D, x 44.9%, y 35.9%, w 4.0%, h 43.9%). Totals are printed above their bars in bold dark grey; the change values are printed inside the bars in white. Category labels sit under the baseline. A dark grey horizontal baseline runs under the bars from about x 2.9% to 51%, y about 77.5%. No legend and no highlighted points. Decorative image: a faint light-grey diagonal angular texture on white covering the whole slide. Logo: ExxonMobil wordmark in red (about #E0001B) at top right.
Slide 14
Strong results continuing to support capital
allocation priorities
ExxonMobil
Cash flow
Billion USD
$ 33.0
13.7
(6.7)
1.0
(8.2)
(1.2)
$ 31.6
$ 8.0 billion
free cash flow
3Q23
cash
CFO
Cash capex1
Asset
sales
Shareholder
distributions
Other
4Q23
cash
4Q:
$15.9 billion of CFO ex-working capital
$8.0 billion of free cash flow on strong earnings and
asset sales
4Q dividend of $0.95 per share, an increase of 4.4%
versus 3Q
2023:
Progressed advantaged projects with $26 billion of
capital and exploration expenditures
- Accelerated Permian and Guyana activity
- Launched new lithium business
Returned >$32 billion to shareholders, including ~$17.5
billion of share repurchases in 2023
16% debt-to-capital; 5% net debt-to-capital
1 Includes PP&E additions of ($6.2) billion and net investments / advances of ($0.5) billion in fourth quarter 2023.
See Supplemental information for definitions and reconciliations.
14
Visuals: Chart: waterfall (bridge) chart titled 'Cash flow' with unit label 'Billion USD'. Categories left to right: 3Q23 cash, CFO, Cash capex (with superscript 1), Asset sales, Shareholder distributions, Other, 4Q23 cash. Values: 3Q23 cash $ 33.0 (blue total bar, #0C479D, value label above bar); CFO 13.7 (green #00A14D bar, label inside bar in white); Cash capex (6.7) (grey #C0C0C0 floating bar, label inside); Asset sales 1.0 (grey floating bar, label above); Shareholder distributions (8.2) (grey floating bar, label inside); Other (1.2) (grey floating bar, label below); 4Q23 cash $ 31.6 (blue total bar, #0C479D, label above). No printed y-axis or gridlines; baseline is a thin dark grey horizontal line under the bars. A bracket below the CFO, Cash capex and Asset sales columns spans them with the label '$ 8.0 billion' over 'free cash flow' in bold. Legend: none. Highlighted points: the CFO green bar is the only coloured positive bar; the two totals are dark blue. Bar heights are proportional to values; the printed values are the only numeric labels.
Slide 15
1Q24 outlook
Upstream
• Lower volumes driven by absence of
favorable 4Q entitlement impacts, partly
offset by Payara development ramp-up
Product
Solutions
Energy Products
• Higher scheduled maintenance
Chemical Products
Specialty Products
Corporate
• Corporate and financing expenses expected
to be $300-$500 million
• Share repurchases to resume following
Pioneer's special shareholder meeting
15
Visuals: Photograph (full-height, right panel x 65.7% to 100%, y 0% to 100%, full-bleed to top and bottom edges, not boxed): a refinery operator seen from the waist up, wearing a navy hard hat with a white circular emblem, clear safety glasses, black zip jacket with a small white logo on the chest, and grey work gloves, turning a valve handle on a steel pipe assembly. Behind him are steel pipework, grey vertical tanks, yellow safety railings and walkways, and a steel pillar. Lighting is natural daylight, cool and even. Dominant colours are grey, steel, yellow and navy blue, with a blue bag at the right edge. Composition is vertical with the subject in the lower centre-right. The image is cropped at the top, bottom and right edges. No overlay or tint is visible. ExxonMobil wordmark logo at top right (x 86.8%, y 5.8%, w 10.0%, h 3.6%): red bold wordmark 'ExxonMobil' with a stylised red X crossing the 'x'. Decorative red accent bar at left edge (x 0%, y 2.5%, w 0.9%, h 18.2%), solid red, flush with the slide edge. Horizontal rules: four thin grey lines, about 1 px, colour #A6A6A6, at y 36.3% (x 3.5% to 72.5%), y 46.0% (x 17.3% to 72.5%), y 55.6% (x 17.3% to 72.5%) and y 65.3% (x 3.5% to 72.5%).
Slide 16
Delivered $30 billion portfolio of strategic projects / on budget and ahead of schedule since 2018 / 2018 project plans delivering >$5 billion in 2024 earnings1 / Liza Phase II development, Guyana / Gulf Coast Growth Ventures, Corpus Christi, TX / Refinery Expansion, Beaumont, TX / Guyana Payara / Guyana Liza Phase 2 / Permian Cowboy Central / Delivery Point Expansion / Guyana Liza Phase 1 / Baytown Chemical Expansion / Baton Rouge Polypropylene Expansion / Gulf Coast Growth Ventures / Beaumont Polyethylene Expansion / Baytown Steamcracker / Singapore Butyl Polymer Plant / Beaumont Refinery Expansion / Permian Crude Venture / Rotterdam Advanced Hydrocracker / Beaumont SCANfiner / See Supplemental information for footnotes and definitions. / 16
Visuals: Three photographs of industrial sites. Left: Liza Phase II floating production vessel (FPSO) at sea, seen from an aerial angle, with a green helipad marked 'LIZA UNITY' on the deck, yellow process modules, flare stacks and a grey-blue ocean with white wave crests under an overcast sky; boxed with square corners, a small grey label box in the top-left corner reads 'Liza Phase II development, Guyana'. Centre: aerial view of Gulf Coast Growth Ventures petrochemical plant, Corpus Christi, TX, showing tall grey columns, pipe racks, horizontal vessels and yellow stairways and railings under a clear blue sky; boxed, label 'Gulf Coast Growth Ventures, Corpus Christi, TX' in top-left grey box. Right: Beaumont refinery expansion, steel structures, pipe racks and yellow walkways against a blue sky with white clouds, shot from a low angle; boxed with a soft drop shadow, label 'Refinery Expansion, Beaumont, TX' in top-left grey box. Photos are cool blue and grey with yellow accents; no overlay tint. ExxonMobil red wordmark logo at top right, red #E31837 with the X stylised.
Slide 17
On track to deliver large portfolio of high-value projects / in 2025 / Yellowtail development, Guyana / Golden Pass LNG terminal, Sabine Pass, TX / Bacalhau development, Brazil / Fawley Hydrofiner, United Kingdom / Strathcona Renewable Diesel, Canada / Resid Upgrade, Singapore / Petrochemical Complex, China / 7 Advanced Recycling Units, worldwide / See Supplemental information for definitions. / 17
Visuals: Eight rectangular photographs in a 4 by 2 grid, all boxed (not cropped to shapes, not full-bleed) with soft grey drop shadows. Row 1, left to right: (1) Yellowtail development, Guyana: aerial view of a large FPSO hull under construction in a dry dock, with cranes, scaffolding and yellow and orange deck structures, blue water at top right, daylight. (2) Golden Pass LNG terminal, Sabine Pass, TX: three large white cylindrical LNG storage tanks on a pier above calm water, the front tank showing a blue and red Golden Pass LNG logo, warm pale sky with a soft sunset tint. (3) Bacalhau development, Brazil: an FPSO with a red hull and a dense multicoloured topside of modules at sea, a red and white tugboat at lower left, turquoise water, blue sky with white clouds. (4) Fawley Hydrofiner, United Kingdom: dense process plant with green steel structures, pipe racks and two tall grey columns at right, under a clear blue sky. Row 2, left to right: (5) Strathcona Renewable Diesel, Canada: two workers in blue coveralls and white hard hats standing on a steel grating platform, with a refinery of lit towers and orange lights behind them at dusk. (6) Resid Upgrade, Singapore: construction site with tall grey vessels and towers wrapped in scaffolding, a red crane and sandy ground, pale blue sky. (7) Petrochemical Complex, China: a multi-storey structure under construction, fully wrapped in yellow scaffolding, with yellow tower cranes and a green mobile crane boom, blue sky. (8) 7 Advanced Recycling Units, worldwide: a tall white column tower rising above pipework and vessels, shot from low angle against a clear blue sky. Lighting is natural daylight throughout, with strong contrast on the Strathcona and Golden Pass images. Dominant colours across the grid are blue sky, grey and white steel, and yellow and green construction equipment. Each photo is shown in full frame with no overlay other than the caption label. Also a logo: the ExxonMobil wordmark in red at top right. A faint light-grey abstract background pattern of diagonal shapes covers the slide behind everything.
Slide 18
2024: continued growth in shareholder value
ExxonMobil
• Leading industry in safety, operating, and financial performance
• Capitalizing on growing array of advantaged opportunities, leveraging unmatched capability and scale
- 2024 capex of $23-$25 billion underpins profitable growth, improvements in portfolio mix, and emissions reductions 1
- Progressing 2025 strategic project start-ups
- Continual progress in structural cost savings; $15 billion by 2027
- Integrating Denbury; pursuing value-accretive low carbon opportunities and executing our 2030 emission reduction plans 2,3
- Expect to close and initiate integration of Pioneer in 2Q 2024
• Consistently returning more cash to shareholders
• Progressing plans to deliver further earnings and cash flow growth over next 4 years
See Supplemental information for footnotes, definitions and reconciliations.
18
Visuals: ExxonMobil corporate logo (red wordmark with stylised X) top-right, color #ED1C24. A solid red vertical accent bar on the left edge, from y 2.5% to 20.7% (0.9% wide), color #ED1C24, sharp corners, no shadow. Behind all text is a very pale grey-white abstract background image of soft diagonal light and grey planes, covering the full slide, no visible photograph or chart. No other graphics.
Slide 19
Q&A / 2.2.24 / New Advancing Climate Solutions report and / Sustainability report available on www.exxonmobil.com
Visuals: Photograph: a smiling woman with long dark hair wearing a white full-brim hard hat and reflective brown-lensed sunglasses, leaning forward with her forearms resting on a light grey metal rail/bar in the foreground. She looks to the right; the sunglasses reflect industrial equipment and a pipe structure. Background is a bright hazy sky over a distant flat horizon. Composition: waist-up crop, subject right of centre, rail running diagonally across the top third. Lighting: soft, bright daylight with warm highlights on the face and hair. Dominant colours: white, light grey, warm skin tones, dark brown hair. The photo is full-bleed, not boxed, with no visible tint. The white hard hat has small grey lettering reading 'Exxon' partially visible. Red vertical rectangle: solid red (#FF0000) bar at the left edge of the photo, about 4.7% of width wide and 40% of height, with a small angled top edge; it overlaps the boundary between the left panel and the photo. ExxonMobil logo: white wordmark with a stylised X, top-right. Q&A is a large light-weight blue title; 2.2.24 is a grey bold date beneath it. Left panel: a faint white-to-light-grey gradient with a subtle diagonal sheen.
Slide 20
Outlook for first quarter of 2024 / ExxonMobil / Upstream scheduled maintenance earnings impact1 / Million USD / 310 / 880 / +60 / ~390 / 400 / 900 / +440 / ~280 / ~630 / ~410 / 720 / 600 / ~440 / 200 / ~345 / ~250 / +280 / -40 / ~160 / 210 / 300 / 0 / 0 / 1Q23 / 2Q23 / 3Q23 / 4Q23 / 1Q24 est. / 1Q23 / 2Q23 / 3Q23 / 4Q23 / 1Q24 est. / Chemical Products scheduled maintenance earnings impact2 / Specialty Products scheduled maintenance earnings impact4 / Million USD / Million USD / 300 / 60 / ~250 / ~50 / 40 / ~40 / ~40 / +0 / ~200 / -20 / ~190 / 180 / 200 / ~30 / ~150 / 30 / -60 / -10 / 100 / 140 / 30 / 0 / 0 / 1Q23 / 2Q23 / 3Q23 / 4Q23 / 1Q24 est. / 1Q23 / 2Q23 / 3Q23 / 4Q23 / 1Q24 est. / Energy Products scheduled maintenance earnings impact3 / See Supplemental information for footnotes. / 20
Visuals: Four vertical bar charts, all filled #0C479D with no outlines, each with a horizontal baseline and a 0-based value axis. Upstream scheduled maintenance earnings impact (Million USD, axis 0 to 400, labelled ticks 0, 200, 400): 1Q23 about 160 (~160), 2Q23 about 390 (~390), 3Q23 about 280 (~280), 4Q23 about 250 (~250); a dashed estimate fan from the 4Q23 bar top goes to a grey vertical range bar for 1Q24 est. with labels +60 (upper change), -40 (lower change), 310 (upper value) and 210 (lower value). Energy Products scheduled maintenance earnings impact (Million USD, axis 0 to 900, ticks 0, 300, 600, 900): 1Q23 about 630 (~630), 2Q23 about 410 (~410), 3Q23 about 345 (~345), 4Q23 about 440 (~440); dashed fan from 4Q23 to a grey range bar for 1Q24 est. with +440 (upper change), +280 (lower change), 880 (upper value) and 720 (lower value). Chemical Products scheduled maintenance earnings impact (Million USD, axis 0 to 300, ticks 0, 100, 200, 300): 1Q23 about 250 (~250), 2Q23 about 150 (~150), 3Q23 about 190 (~190), 4Q23 about 200 (~200); dashed fan from 4Q23 to a range bar for 1Q24 est. with -20 (upper change), -60 (lower change), 180 (upper value) and 140 (lower value). Specialty Products scheduled maintenance earnings impact (Million USD, axis 0 to 60, ticks 0, 30, 60): 1Q23 about 30 (~30), 2Q23 about 50 (~50), 3Q23 about 40 (~40), 4Q23 about 40 (~40); dashed fan from 4Q23 to a grey range bar for 1Q24 est. with +0 (upper change), -10 (lower change), 40 (upper value) and 30 (lower value). Estimate ranges are drawn as dark grey dashed lines and grey I-shaped error bars. No legend. No highlighted points. Value labels are printed above each bar in grey, with ~ marking approximate values.
Slide 21
Upstream: improved mix from advantaged growth
projects partially offsetting lower realizations
Upstream
Contributing factors to change in earnings
Million USD
$ 39,418
(14,290)
970
310
$ 25,994
(420)
(2,380)
$ 23,609
2022
ex. ident.
items
Price
Volume
/ mix
Expenses
Other
2023
ex.
unsettled
derivatives
MTM
Unsettled
derivatives
MTM
2023
ex. ident.
items
Lower liquids and gas realizations
Achieved full-year production of 3.7 Moebd
Full-year Permian production of >610 Koebd
Full-year Guyana gross production of >390 Koebd
Improving portfolio mix with advantaged growth
from Guyana and Permian, offsetting divested
volumes, primarily U.S. unconventional gas
>120 Koebd of growth from Permian and Guyana
Strong cost control partly offset inflation and
increased activity
Other reflects favorable forex, tax, and
divestment-related impacts
Unsettled derivatives MTM mainly reflects
absence of prior-year favorable impacts
See page 8 and Supplemental information for definitions and reconciliations.
21
Visuals: Chart: vertical waterfall (bridge) chart titled Upstream, subtitle Contributing factors to change in earnings, units Million USD. No y-axis scale or gridlines are printed; only a horizontal baseline. Eight columns left to right with printed values: 2022 ex. ident. items $ 39,418 (blue total bar, value above bar); Price (14,290) (red negative bar, value below bar); Volume / mix 970 (green positive bar, value above); Expenses (420) (red negative bar, value below); Other 310 (green positive bar, value above); 2023 ex. unsettled derivatives MTM $ 25,994 (blue total bar, value above); Unsettled derivatives MTM (2,380) (red negative bar, value below); 2023 ex. ident. items $ 23,609 (blue total bar, value above). Bars are floating in sequence: the Price bar spans from the top of the 2022 bar downward, and the Volume, Expenses and Other bars are small steps at the level of the running total. The baseline is a single black horizontal axis line with no tick marks. No legend. No highlighted points beyond the colour coding: blue totals, red decreases, green increases. Two additional visual items: the ExxonMobil logo (red wordmark) top-right, and a thin red accent bar at the left edge beside the title. No photographs.
Slide 22
Energy Products: excellence in execution delivering / strong earnings performance
22
Energy Products
Contributing factors to change in earnings
Million USD
$ 15,650
(3,150)
80
(540)
(0)
$ 12,032
(30)
$ 11,998
2022 / ex. ident. / items
Margin
Volume / / mix
Expenses
Other
2023 / ex. / unsettled / derivatives / MTM
Unsettled / derivatives / MTM
2023 / ex. ident. / items
•
Refining margins declined due to lower diesel / cracks driven by rebalancing of trade flows
•
Record reliability and Beaumont expansion / delivered record throughput, more than / offsetting higher scheduled maintenance and / divestments1
•
Expenses up mainly on higher turnaround and / project activity
•
Unsettled derivatives MTM and price / timing / impacts were neutral for the full year
See page 8 and Supplemental information for footnotes, definitions, and reconciliations.
22
Visuals: Waterfall bar chart titled 'Energy Products' with subtitle 'Contributing factors to change in earnings' and unit label 'Million USD'. Vertical axis unlabelled, no gridlines; horizontal baseline at about y 80 percent spanning about x 2.9 to 56.9 percent. Eight columns from left to right, with category labels below the baseline: 2022 ex. ident. items (blue, total) labelled $ 15,650; Margin (red, decrease) labelled (3,150); Volume / mix (green, increase, very thin bar) labelled 80; Expenses (red, decrease, small) labelled (540); Other (thin black line, near zero) labelled (0); 2023 ex. unsettled derivatives MTM (blue, total) labelled $ 12,032; Unsettled derivatives MTM (red, thin line) labelled (30); 2023 ex. ident. items (blue, total) labelled $ 11,998. Values are printed on every bar; no estimates are needed. Bar scale is approximately: blue total bars and the red Margin bar span about 10 percent of slide height for the 2022 total of 15,650 and about 33 percent for the 2023 totals at 12,032 and 11,998, with the Margin bar hanging from the top of the 2022 total down to the 12,032 level. Green 80 bar and grey Other line are hairline-thin. No legend. Highlighted points: none beyond the colour coding (blue totals, red decreases, green increase). Superscript 1 marks a footnote after 'divestments' in the commentary. No photographs, logos other than ExxonMobil, or icons apart from the logo.
Slide 23
Chemical Products: generating positive earnings / and cash flow at bottom-of-cycle conditions / ExxonMobil / Chemical Products / Contributing factors to change in earnings / Million USD / $ 3,543 / (870) / (160) / (470) / $ 2,025 / (20) / 2022 / ex. ident. / items / Margin / Volume / / mix / Expenses / Other / 2023 / ex. ident. / items / Record performance chemicals volumes and advantaged / North American footprint driving improvement / Lower margins as continued supply additions outpaced / demand growth; partially offset by declining feed costs / Volume and product mix improvements from strategic / projects more than offset by regional sales mix / Expenses consistent with higher turnaround, scheduled / maintenance, and project spend / See page 8 and Supplemental information for definitions and reconciliations. / 23
Visuals: Waterfall chart titled 'Chemical Products / Contributing factors to change in earnings / Million USD' (units: million USD, no printed axis scale or gridlines, no y-axis drawn). Categories along the horizontal baseline, left to right: 2022 ex. ident. items, Margin, Volume / mix, Expenses, Other, 2023 ex. ident. items. Series: two totals in blue #0C479D, shown as full bars from the baseline: 2022 ex. ident. items $ 3,543 and 2023 ex. ident. items $ 2,025 (value labels printed above the bars). Four changes in red #C00000 floating between levels, with values printed in or beside each bar: Margin (870) printed in white inside the bar; Volume / mix (160) printed in dark grey below the bar; Expenses (470) printed in white inside the bar; Other (20) printed in dark grey below a very thin red bar. No legend. No highlighted points beyond the colour coding. Bars are approximately 4 percent of slide width each, evenly spaced; the baseline is a thin dark grey line running from about 2.7 to 91 percent of width at about 80 percent of height. No photographs, icons or other graphics.
Slide 24
Specialty Products: product differentiation and brand
strength drove sustained portfolio performance
Specialty Products
Contributing factors to change in earnings
Million USD
$ 2,455
440
(120)
20
10
$ 2,807
2022
Margin
Volume
Expenses
Other
2023
ex. ident.
/ mix
ex. ident.
items
items
• Improved margins from high-value products and lower
feed costs
- Record Mobil 1TM sales for second straight year
• Lower volumes on weaker demand globally
• Expenses down on disciplined cost control
See page 8 and Supplemental information for definitions and reconciliations.
24
Visuals: Waterfall chart (floating column bridge), titled 'Specialty Products / Contributing factors to change in earnings', units Million USD. No y-axis or gridlines are drawn; values are printed on or above each bar. A dark grey horizontal baseline (#333333, about 0.1% of slide height) runs under all bars from about 2.9% to 50.9% horizontally at about 80.1% vertically. Bars left to right: (1) 2022 ex. ident. items, total bar, solid blue #0C479D, value $ 2,455, label above in semibold dark grey #434343, spanning about 4.8% to 8.8% horizontally and 46.7% to 80.1% vertically. (2) Margin, increase, green #00A14D, value 440 printed in white inside the bar, floating from about 32.7% to 46.7% vertically, about 12.9% to 16.9% horizontally. (3) Volume / mix, decrease, dark red #C00A14, value (120) printed in white inside the bar, about 20.8% to 24.8% horizontally and 32.7% to 36.6% vertically. (4) Expenses, increase, green #00A14D, value 20 printed above, a thin floating bar about 28.8% to 32.9% horizontally and 35.6% to 36.6% vertically. (5) Other, increase, green #00A14D, value 10 printed above, a very thin floating bar about 36.8% to 40.9% horizontally at about 35.6% vertically. (6) 2023 ex. ident. items, total bar, solid blue #0C479D, value $ 2,807 printed above in semibold, about 44.9% to 48.9% horizontally and 35.6% to 80.1% vertically. No legend. No points are highlighted beyond the colour coding of increases (green) and decreases (red). Category labels sit below the baseline in regular dark grey. No photographs, icons or other graphics.
Slides 25 to 40 continue in the full text file.
Download this deck
The hosted PDF of every library deck is free for readers of the SlideDeck Co newsletter. Join with your email and the viewer and download appear here.
Preparing a results presentation or business update of your own? The SlideDeck Co Standard Deck is a slide library for business reviews, updates and plans.







