
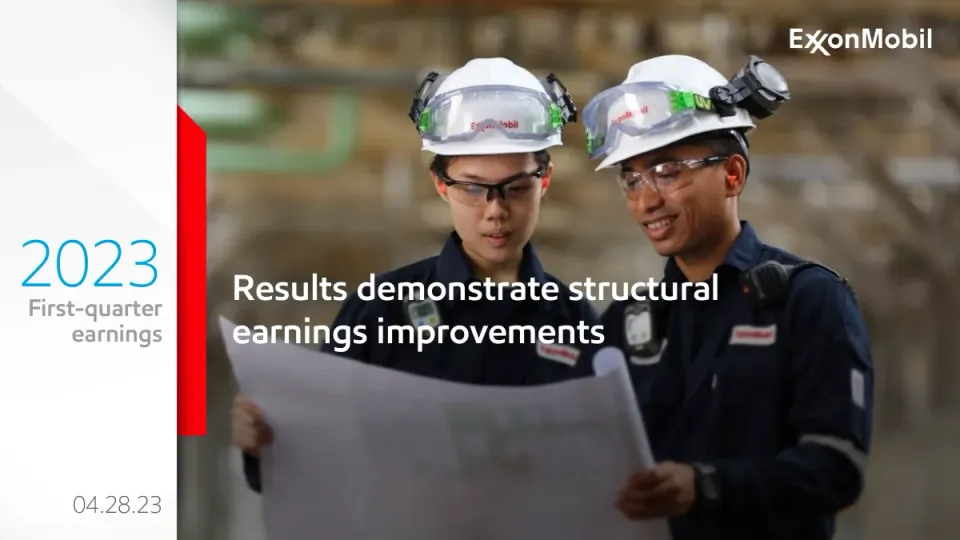
The deck opens with a title slide reading 'Results demonstrate structural earnings improvements' dated 04.28.23, followed by a long cautionary statement on forward-looking statements and a note on non-GAAP reconciliations. It then sets out the quarter's strategic priorities, the industry price and margin backdrop against a ten-year range, and a headline summary of earnings, cash flow, production growth, debt-to-capital and shareholder distributions. The core of the deck is a segment-by-segment walk through results: a waterfall reconciliation from fourth-quarter to first-quarter earnings, then Upstream volume and earnings bridges, Energy Products, Chemical Products and Specialty Products, followed by a cash flow slide. Outlook slides cover the second quarter, including scheduled maintenance impacts and advantaged project start-ups. The deck closes with key takeaways, a Q&A slide, and a set of supplemental pages with definitions, non-GAAP reconciliations, a structural cost savings calculation and a free cash flow table. Slides 6, 7 and 12 are the most worth studying for how bridge charts and dense financial tables are turned into readable visuals.
Slides worth studying
- Slide 5: Large numeric callouts in a four-tile grid, with one headline figure per tile and a short qualifier underneath, make the key results readable at a glance.
- Slide 7: A waterfall bridge with colour-coded positive and negative bars and a bracketed subtotal for volume and mix shows how a change in earnings is explained step by step.
- Slide 12: A cash flow waterfall labelled with the free cash flow figure as a bracketed callout summarises a complex sequence of flows in one chart.
Details
- Company: ExxonMobil
- Year: 2023
- Type: Investor presentation
- Industry: Energy
- Pages: 24
The hosted copy of this deck is being prepared. Newsletter readers will find the download here.
Review score: 8 out of 10, Strong
Presentation quality, judged with the SlideDeck Co review heuristic. Ask, evidence and idea merit are not rated here.
The strength is waterfalls that decompose rather than lump: slide 7 splits the price bar into Gas and Liquids, brackets day effect and other volume as '$ 350 million Volume / mix', and shows $ 8,628 before a separate (2,010) unsettled derivatives bar leads to $ 6,615, with the Other bar explained in the bullets. Slide 9 does the same for Energy Products, separating scheduled maintenance (340) from other volume 320. The system is navigable: slide 6 reconciles GAAP to ex-identified items, footers point to 'page 6', slide 13 and slide 17 hold the outlook, and slide 22 shows the full calculation behind the structural savings figure down to -7.2. The bottleneck is titles that claim more than the exhibit shows: slide 11 is headed 'consistently strong performance' over a move from $ 800 to $ 774, and slide 7 says 'continued strong earnings' over a fall to $ 6,615.
Worth keeping: Keep the bracketed Volume / mix grouping and the pre-derivatives subtotal bar on slides 7 and 9.
Most useful repair: Retitle slides 7 and 11 to state the direction and main driver of the change, for example the derivatives effect on slide 7.
What would change the score: If a reader took the titles alone as the summary, the mismatch on slides 7 and 11 would mislead and the score would fall to 7.
Confidence high. 24 of 24 pages inspected on contact sheets, 12 at readable size. Reviewed 2026-11-15. Model-assisted review (claude-fable-5-2, in session).
Full text of the slides (24 slides)
Every slide's words and a description of its charts and images, so the deck can be searched and rebuilt. Also available as Markdown.
Slide 1
2023
First-quarter
earnings
Results demonstrate structural
earnings improvements
04.28.23
ExxonMobil
Visuals: Photograph: two ExxonMobil field workers in navy coveralls and white hard hats with clear safety goggles, standing in an industrial interior. The woman on the left looks down at a large unrolled blueprint held by both; the man on the right smiles and looks at the blueprint. Background is a heavily blurred warm beige/brown industrial wall with green pipework. Soft natural lighting, dominant colours navy, white, warm brown and grey. The photo is full-bleed behind everything, with a white gradient/tint panel overlaying the left 22% of the slide. Blueprint paper crosses the lower centre of the frame, partly behind the title. Logo: ExxonMobil wordmark in white at top right. Red vertical bar (#FF0000) with a slight angled top edge sits at the boundary of the left panel, about 1.8% wide and 18% to 73% of height.
Slide 2
Cautionary Statement
FORWARD-LOOKING STATEMENTS. Statements of future events, conditions, expectations, plans, or ambitions in this presentation or the subsequent discussion period are forward-looking statements. Similarly, discussions of future carbon capture, transportation and storage, as well as biofuels, hydrogen and other plans to reduce emissions are dependent on future market factors, such as continued technological progress, policy support and timely rule-making and permitting, and represent forward-looking statements. Actual future results, including financial and operating performance; potential earnings, cash flow, and rates of return; total capital expenditures and mix, including allocations of capital to low carbon solutions; structural earnings improvement and structural cost reductions and efficiency gains, including the ability to offset inflationary pressures; ambitions to reach Scope 1 and Scope 2 net zero from operated assets by 2050, plans to reach net zero Scope 1 and 2 emissions in Upstream Permian Basin unconventional operated assets by 2030, eliminating routine flaring in-line with World Bank Zero Routine Flaring, reaching near-zero methane emissions from its operations, meeting ExxonMobil's emission reduction plans and goals, divestment and start-up plans, and associated project plans as well as technology efforts; success in or development of future business markets like carbon capture, transportation and storage, hydrogen or biofuels; maintenance and turnaround activity; drilling and improvement programs; price and margin recovery; shareholder distributions; planned integration benefits; resource recoveries and production rates; and product sales levels and mix could differ materially due to a number of factors. These include global or regional changes in oil, gas, petrochemicals, or feedstock prices, differentials, seasonal fluctuations, or other market factors, economic conditions or seasonal fluctuations affecting the oil, gas, and petrochemical industries and the demand for our products; government policies supporting lower carbon investment opportunities such as the U.S. Inflation Reduction Act or policies limiting the attractiveness of investments such as European taxes on the energy sector; variable impacts of trading activities each quarter; policy and consumer support for emission-reduction products and technology; the outcome of competitive bidding and project wins; regulatory actions targeting public companies in the oil and gas industry; changes in local, national, or international laws, regulations, and policies affecting our business including with respect to the environment; taxes, trade sanctions, and actions taken in response to pandemic concerns; the ability to realize efficiencies within and across our business lines and to maintain current cost reductions as efficiencies without impairing our competitive positioning; the outcome and timing of exploration and development projects; decisions to invest in future reserves; reservoir performance, including variability in unconventional projects; the level and outcome of exploration projects and decisions to invests in future resources; timely completion of construction projects; war, civil unrest, attacks against the company or industry, and other political or security disturbances; expropriations, seizures, and capacity, insurance or shipping limitations by foreign governments or international embargoes; changes in consumer preferences; opportunities for and regulatory approval of investments or divestments that may arise; the outcome of our or competitors' research efforts and the ability to bring new technology to commercial scale on a cost-competitive basis; the development and competitiveness of alternative energy and emission reduction technologies; unforeseen technical or operating difficulties including the need for unplanned maintenance; and other factors discussed here and in Item 1A. Risk Factors of our Annual Report on Form 10-K and under the heading "Factors Affecting Future Results" available through the Investors page of our website at exxonmobil.com. All forward-looking statements are based on management's knowledge and reasonable expectations at the time of this presentation and we assume no duty to update these statements as of any future date. Neither future distribution of this material nor the continued availability of this material in archive form on our website should be deemed to constitute an update or re-affirmation of these figures as of any future date. Any future update of these figures will be provided only through a public disclosure indicating that fact.
Reconciliations and definitions of non-GAAP and other terms are provided in the text or in the supplemental information accompanying these slides beginning on page 19.
2
Slide 3
Executing on our strategic priorities
ExxonMobil
Leading Performance | Essential Partner | Advantaged Portfolio | Innovative Solutions | Meaningful Development
•
Delivering structural earnings improvements driven by growing advantaged assets, mix improvements, and structural cost
reductions, consistent with Corporate Plan
•
Expanded energy supply to meet growing demand by increasing production in Guyana and Permian and started up the 250 Kbd
Beaumont refinery expansion
•
Announced final investment decision for the Uaru offshore development and two new discoveries in Guyana
•
Delivered reliable operations and top-quartile turnaround performance1
•
Continued growth in Low Carbon Solutions business with a new CCS agreement
•
Further enhancing execution and efficiency by forming three new centralized organizations: Global Business Solutions,
ExxonMobil Supply Chain, and Global Trading
See Supplemental Information for footnotes and definitions.
3
Visuals: A full-width horizontal gradient band running from red on the left to deep blue on the right, carrying five white section labels separated by vertical bars. A red ExxonMobil wordmark logo at top right. A short red vertical tab at the left edge beside the title. The background is a light grey-white abstract texture with faint diagonal shapes. No charts, photographs or tables.
Slide 4
Diversified portfolio provides resiliency across cycles / Industry prices / margins / 10-year annual range 1 / Crude prices 2 / ($/bbl) / Natural gas / prices 3 / ($/mbtu) / Refining / margins 4 / ($/bbl) / Chemical / margins 5 / ($/tonne) / 1Q22 / 4Q22 / 1Q23 / 10-year annual range / (2010-2019) / • Crude and gas prices lower on higher inventories / • Refining margins moderated slightly; remained above / 10-year range reflecting continued low product / inventories / • Chemical margins improved on North America ethane / feed cost; remained low due to continued bottom-of- / cycle conditions in Asia Pacific / See Supplemental Information for footnotes. / Natural gas prices and refining margins not to scale outside of 10-year annual range. / 4
Visuals: Chart: scatter-style range chart (industry prices and margins, 10-year annual range). Title printed as 'Industry prices / margins' with subtitle '10-year annual range' (superscript 1). Vertical y-axis line at x about 3.1% from y about 30% to 75%, with a break mark (two short slanted lines) at about x 2.3% to 3.8%, y 48% to 50%; no tick labels or numeric scale are printed, so values are described only by position. Four categories along the x-axis: Crude prices ($/bbl), Natural gas prices ($/mbtu), Refining margins ($/bbl), Chemical margins ($/tonne). Each category has a grey rectangle (10-year annual range 2010-2019) with a 1Q22 black, 4Q22 red, and 1Q23 blue diamond marker series. Rectangles: Crude about x 6.6% to 11.2%, y 51.4% to 63.8%; Natural gas about x 18.2% to 22.8%, same y; Refining about x 29.8% to 34.4%, same y; Chemical about x 41.3% to 45.9%, same y. Marker positions (estimated, no values printed): Crude: 1Q22 black about 8.7% from the top of the box region, sitting near the top of the box; 4Q22 red and 1Q23 blue sit just below it, inside the box. Natural gas: 4Q22 red well above the box (about y 32%), 1Q22 black above the box (about y 40%), 1Q23 blue just above the box (about y 48%). Refining margins: 4Q22 red and 1Q23 blue just above the box (about y 39% and 41%, nearly overlapping), 1Q22 black inside the box near its lower-middle (about y 56.5%). Chemical margins: all three markers below the box: 1Q22 black about y 70.5%, 1Q23 blue about y 72.3%, 4Q22 red about y 74.8%. Legend below the chart at y about 87%: black diamond '1Q22', red diamond '4Q22', blue diamond '1Q23', then a grey square with '10-year annual range (2010-2019)'. Note: natural gas and refining margins are marked as not to scale outside the 10-year range. Highlighted points: none beyond the colour coding. Diamonds are small, about 1.2% of slide width. Grey 10-year range boxes are solid, with no outline.
Slide 5
Structural earnings improvements delivering shareholder value
ExxonMobil
Earnings
$11.4
billion
Earnings ex. identified items were $11.6 billion
Structural cost savings
$7.2
billion
vs. 2019; on track to deliver $9 billion by year-end
Production growth
~300
Koebd
vs. 1Q22, ex. divestments, Sakhalin-1 expropriation, and entitlements1
Cash flow from operations
$16.3
billion
Increased cash balance by $3.0 billion
Debt-to-capital ratio
17
%
Reduced net debt-to-capital to 4%
Shareholder distributions
$8.1
billion
including $3.7 billion of dividends
See page 6 and Supplemental Information for footnotes, definitions, and reconciliations.
5
Visuals: Six stat cards, each a light grey gradient rectangle with a number and label, and three photographs of industrial workers in the bottom row. Card 1 (Earnings): label 'Earnings', large value '$11.4' with unit 'billion', description 'Earnings ex. identified items were $11.6 billion'. Card 2 (Structural cost savings): value '$7.2' with unit 'billion', description 'vs. 2019; on track to deliver $9 billion by year-end'. Card 3 (Production growth): value '~300' with unit 'Koebd', description 'vs. 1Q22, ex. divestments, Sakhalin-1 expropriation, and entitlements' with superscript 1. Card 4 (Cash flow from operations): value '$16.3' with unit 'billion', description 'Increased cash balance by $3.0 billion'. Card 5 (Debt-to-capital ratio): value '17' with unit '%', description 'Reduced net debt-to-capital to 4%'. Card 6 (Shareholder distributions): value '$8.1' with unit 'billion', description 'including $3.7 billion of dividends'. Photograph 1 (bottom left): two workers in hardhats walk across an oil refinery site among tall steel towers and pipe racks; one wears a blue shirt and the other black coveralls; the composition is a wide, eye-level, full-width crop inside a box with a soft drop shadow; warm late-day sunlight with a clear blue sky; dominant colours blue, tan and steel grey. Photograph 2 (bottom centre): a woman in a white hardhat and safety glasses works a large steel valve wheel while a man in a white hardhat and green-striped vest holds a tablet beside her; pipes and red-painted structure fill the background; close framing, daylight; dominant colours steel grey, white and red. Photograph 3 (bottom right): three workers in white hardhats and navy coveralls stand beside large olive-green pipes, one woman with dark hair on the left, two men on the right; daylight with warm yellow machinery behind; dominant colours navy, olive and yellow. The three photos are boxed rectangles, not cropped to circles, with no overlay or tint. The ExxonMobil logo is the only logo, in red at top right. The red vertical bar at the left edge is a decorative shape.
Slide 6
Continued cost control and mix improvements drove
record first-quarter results
Table: (blank) / U/S / EP / CP / SP / C&F / TOTAL / 4Q22 GAAP Earnings / (Loss) / $8.2 / $4.1 / $0.3 / $0.8 / ($0.5) / $12.8 / Additional European taxes on energy sector / (1.4) / (0.4) / - / - / - / (1.8) / Sakhalin-1 expropriation / 1.1 / - / - / - / - / 1.1 / Impairments / (0.2) / (0.3) / - / (0.0) / - / (0.5) / 4Q22 Earnings / (Loss) ex. identified items (non-GAAP) / $8.8 / $4.8 / $0.3 / $0.8 / ($0.5) / $14.0 / Price / margin / (1.4) / (0.1) / 0.2 / (0.1) / - / (1.5) / Volume / mix / 0.3 / (0.2) / 0.0 / 0.1 / - / 0.3 / Expenses / 0.2 / (0.0) / (0.1) / 0.1 / - / 0.2 / Other / 0.8 / (0.6) / (0.0) / (0.1) / 0.2 / 0.2 / Unsettled derivatives mark-to-market (MTM) / (2.0) / 0.4 / - / - / - / (1.6) / 1Q23 Earnings / (Loss) ex. identified items (non-GAAP) / $6.6 / $4.2 / $0.4 / $0.8 / ($0.4) / $11.6 / Additional European taxes on energy sector / (0.2) / (0.0) / - / - / - / (0.2) / 1Q23 GAAP Earnings / (Loss) / $6.5 / $4.2 / $0.4 / $0.8 / ($0.4) / $11.4
Liquids and natural gas realizations decreased due to higher industry inventories / Advantaged growth projects, reliability, and mix improvements more than offset higher scheduled maintenance and fewer days in the quarter / Disciplined cost management and seasonally lower expenses offset higher scheduled maintenance / Other driven by absence of year-end inventory effects and lower corporate and financing costs / Unsettled derivatives mainly reflects absence of favorable Upstream MTM impact in prior quarter
Billions of dollars unless specified otherwise. / Due to rounding, numbers presented above may not add up precisely to the totals indicated. / See Supplemental Information for definitions.
6
Visuals: No charts, photographs or icons. One table: a financial earnings bridge in billions of US dollars, with a header row and columns U/S, EP, CP, SP, C&F and TOTAL. The first column holds row labels. Rows, top to bottom: 4Q22 GAAP Earnings / (Loss) with values $8.2, $4.1, $0.3, $0.8, ($0.5), $12.8 (grey band); Additional European taxes on energy sector with (1.4), (0.4), -, -, -, (1.8); Sakhalin-1 expropriation with 1.1, -, -, -, -, 1.1; Impairments with (0.2), (0.3), -, (0.0), -, (0.5); 4Q22 Earnings / (Loss) ex. identified items (non-GAAP) with $8.8, $4.8, $0.3, $0.8, ($0.5), $14.0 (grey band); Price / margin with (1.4), (0.1), 0.2, (0.1), -, (1.5); Volume / mix with 0.3, (0.2), 0.0, 0.1, -, 0.3; Expenses with 0.2, (0.0), (0.1), 0.1, -, 0.2; Other with 0.8, (0.6), (0.0), (0.1), 0.2, 0.2; Unsettled derivatives mark-to-market (MTM) with (2.0), 0.4, -, -, -, (1.6); 1Q23 Earnings / (Loss) ex. identified items (non-GAAP) with $6.6, $4.2, $0.4, $0.8, ($0.4), $11.6 (grey band); Additional European taxes on energy sector with (0.2), (0.0), -, -, -, (0.2); 1Q23 GAAP Earnings / (Loss) with $6.5, $4.2, $0.4, $0.8, ($0.4), $11.4 (grey band). Thin black rules separate the subtotal rows. The table is not highlighted beyond the grey subtotal bands.
Slide 7
Upstream: continued strong earnings driven by growth | from advantaged projects and disciplined cost management | Upstream | Contributing factors to change in earnings | Million USD | $ 8,762 | Gas | Liquids | (1,440) | (220) | 570 | 180 | 770 | $ 8,628 | (2,010) | $ 6,615 | $ 350 million | Volume / mix | 4Q22 ex. | ident. items | Price | Day | effect | Other | volume | / mix | Expenses | Other | 1Q23 ex. | unsettled | derivatives | MTM | Unsettled | derivatives | MTM | 1Q23 ex. | ident. items | • | Growth in our advantaged Permian, | Guyana, and LNG assets contributed to | volume / mix improvement | • | Robust cost control and seasonally lower | expenses | • | Other reflects absence of year-end | inventory effects | • | Unsettled derivatives mainly reflects | absence of favorable MTM impact from | prior quarter | See page 6 for reconciliations. | 7
Visuals: Chart: vertical waterfall bar chart titled 'Upstream / Contributing factors to change in earnings / Million USD'. Eight-plus bars, columns in order: 4Q22 ex. ident. items $8,762 (total, blue); Price (1,440) (red, split into Gas and Liquids segments with a black divider line across the bar, Gas label above divider and Liquids label below); Day effect (220) (red); Other volume / mix 570 (green); Expenses 180 (green); Other 770 (green, white value label inside bar); 1Q23 ex. unsettled derivatives MTM $8,628 (total, blue); Unsettled derivatives MTM (2,010) (red, white label inside bar); 1Q23 ex. ident. items $6,615 (total, blue). Values are printed on every bar, so no estimates are needed. Axis: no numeric y-axis is printed; the baseline is a thin dark grey horizontal line at about y 80% from x 3% to x 64%, with a faint vertical axis line at about x 3%. Bracket: a thin grey curly brace spanning the Day effect and Other volume / mix columns (about x 17.6% to 29%, y 78%) labelled '$ 350 million / Volume / mix' in bold above it. Legend: none; the Gas/Liquids labels act as the only key. Highlighted points: none beyond the colour coding (blue totals, red decreases, green increases). Other graphics: a red vertical accent bar at the top-left edge (x 0 to 0.9%, y 2.5% to 20.7%) and the ExxonMobil wordmark logo in red (x 86.8%, y 5.8%, w 10%, h 3.6%).
Slide 8
Upstream production growth supported by
advantaged projects
Upstream
Contributing factors to change in volumes
Koebd, net
3,675
(130)
(70)
60
210
90
3,831
1Q22
Divest-
ments
Sakhalin-1
Entitle-
ments
Growth
Downtime
/ other
1Q23
•
Increased production by ~160 Koebd versus 1Q22
- Growth of ~300 Koebd, excluding impacts from
divestments, Sakhalin-1 expropriation, and
entitlements1
•
Advantaged projects delivered growth despite loss from
divestments and Sakhalin-1 expropriation
- 40% production growth in Guyana and Permian
versus 1Q22
•
Improved reliability
See Supplemental Information for footnotes and definitions.
8
Visuals: Waterfall chart titled 'Upstream / Contributing factors to change in volumes / Koebd, net', showing volume change in thousand oil-equivalent barrels per day (Koebd, net). No y-axis scale or gridlines are printed; the category axis is a horizontal baseline. Bars left to right: 1Q22 total 3,675 (blue, full height from baseline); Divestments (130) (red, floating down); Sakhalin-1 (70) (red, floating down); Entitlements 60 (green, floating up); Growth 210 (green, floating up); Downtime / other 90 (green, floating up); 1Q23 total 3,831 (blue, full height). Totals are printed above the blue bars in bold; deltas are printed inside or beside their bars in white (on red and green) with negatives in parentheses. No legend. No highlighted points beyond the colour coding of increases (green) and decreases (red) versus totals (blue). The ExxonMobil wordmark logo sits top-right in red.
Slide 9
Energy Products: reliable execution and cost control / drove strong performance / ExxonMobil / Energy Products / Contributing factors to change in earnings / Million USD / $ 4,754 / (110) / (140) / (340) / 320 / (10) / (640) / $ 3,838 / 380 / $ 4,213 / ($ 160) million / Volume / mix / 4Q22 / Margin / Day / Scheduled / Other / Expenses / Other / 1Q23 ex. / Unsettled / 1Q23 ex. / ex. ident. / effect / maintenance / volume / unsettled / derivatives / ident. / items / (volume) / / mix / derivatives / MTM / items / MTM / • Beaumont refinery expansion start-up and reliable operations partially offset higher scheduled maintenance and fewer days in the quarter / • Disciplined cost management and seasonally lower expenses offset higher spend from scheduled maintenance / • Other reflects absence of fourth quarter favorable inventory and forex impacts / • Unsettled derivatives mainly reflects absence of unfavorable MTM impact from prior quarter / See page 6 for reconciliations. / 9
Visuals: Waterfall chart titled 'Energy Products / Contributing factors to change in earnings / Million USD', plotted in million USD; no value axis, gridlines or axis tick values are printed, and the baseline is a thin dark grey horizontal line at about 79% of slide height. Ten bars run left to right: 4Q22 ex. ident. items total bar $ 4,754 (blue #0C479D); Margin (110) red decrease; Day effect (140) red decrease; Scheduled maintenance (volume) (340) red decrease; Other volume / mix 320 green (#00A050 approx) increase; Expenses (10) thin red decrease; Other (640) red decrease; 1Q23 ex. unsettled derivatives MTM subtotal $ 3,838 (blue); Unsettled derivatives MTM 380 green increase; 1Q23 ex. ident. items total $ 4,213 (blue). Bar values are printed above or inside each bar; decrease values are in parentheses. A bracket beneath the Day effect, Scheduled maintenance and Other volume / mix bars, spanning about 23% to 39% of width, is labelled '($ 160) million / Volume / mix'. Totals are blue #0C479D filled columns (about 4.1% wide); the red #C00000 decreases and green increases are floating bars. Highlighted points: none beyond colour coding. Legend: none.
Slide 10
Chemical Products: advantaged geographic footprint / and improved mix drove earnings growth
ExxonMobil
Chemical Products
Contributing factors to change in earnings
Million USD
$ 250
180
30
(50)
(40)
$ 371
4Q22 / ex. ident. / items
Margin
Volume / / mix
Expenses
Other
1Q23 / ex. ident. / items
• North American ethane advantage strengthened / margins
• Baton Rouge polypropylene expansion delivered / positive cash and earnings in first full quarter of / operation
• Favorable product mix drove volume / mix improvement
• Scheduled maintenance spend more than offset lower / expenses
See page 6 for reconciliations.
10
Visuals: Chart: waterfall (bridge) chart titled 'Chemical Products / Contributing factors to change in earnings', units Million USD, no printed axis scale or gridlines. Categories left to right: 4Q22 ex. ident. items (total bar, value $ 250, blue #0C479D), Margin (increase, value 180, green #00A14D, label inside bar), Volume / mix (increase, value 30, green #00A14D, label inside bar), Expenses (decrease, value (50), red #C00000, label inside bar), Other (decrease, value (40), red #C00000, label inside bar), 1Q23 ex. ident. items (total bar, value $ 371, blue #0C479D, label above bar). Bar heights are proportional to values; the totals sit on a common baseline. Horizontal category axis is a thin dark grey line along the bottom of the bars. Labels: positive and negative deltas are printed inside their bars in white, totals are printed above their bars in bold dark grey. No legend. No highlighted points beyond colour coding. Logo: ExxonMobil wordmark in red at top right. Background: a faint light grey geometric shape pattern on white.
Slide 11
Specialty Products: consistently strong performance
ExxonMobil
Specialty Products
Contributing factors to change in earnings
Million USD
$ 800
(140)
100
110
(100)
$ 774
4Q22 / ex. ident. / items
Margin
Volume / mix
Expenses
Other
1Q23 / ex. ident. / items
• Strong finished lubricants earnings contribution partially / offset lower basestocks prices / • Higher sales driven by China recovery and strengthening / U.S. market position for full synthetic finished lubricants / • Tight cost control and seasonally lower expenses / • Other reflects absence of favorable year-end / inventory impacts
See page 6 for reconciliations.
11
Visuals: One waterfall chart titled 'Specialty Products / Contributing factors to change in earnings / Million USD' with no legend and no gridlines or y-axis scale. Categories left to right: 4Q22 ex. ident. items (total bar, blue, labelled $ 800); Margin (decrease, red, labelled (140)); Volume / mix (increase, green, labelled 100); Expenses (increase, green, labelled 110); Other (decrease, red, labelled (100)); 1Q23 ex. ident. items (total bar, blue, labelled $ 774). Values in Million USD, running from 800 down to 774 with a horizontal baseline at about 80% down. Bars are flat solid rectangles with no highlighted points. Printed values are the labels above; no estimates are needed. The ExxonMobil logo is a red bold wordmark with a stylised X. No photographs or icons.
Slide 12
Historically strong cash flows
ExxonMobil
Cash flow
Billion USD
$ 29.7
16.3
(5.8)
0.9
(0.3)
(8.1)
(0.0)
$ 32.7
$ 11.4 billion
free cash flow
4Q22
cash
CFO
Cash
capex1
Asset
sales
Debt
Shareholder
distributions
Other
1Q23
cash
Robust earnings drove free cash flow of $11.4 billion
Debt-to-capital stands at 17%; net debt-to-capital
reduced to 4%
Distributed $8.1 billion to shareholders, including
$3.7 billion in dividends
On pace to complete up to $17.5 billion of share
repurchases in 2023
See Supplemental Information for footnotes, definitions, and reconciliations.
12
Visuals: Waterfall chart titled 'Cash flow' with unit label 'Billion USD'. No axis scale or gridlines are printed; the value axis is implied. A horizontal baseline runs across the bottom of the bars at about y 80.4. Categories left to right with values: 4Q22 cash $29.7 billion (total bar, blue #0C479D, rises from baseline to about y 55.8); CFO +16.3 (green #00A14D, floating, about y 35.5 to 52.0, value label inside bar in white); Cash capex1 (5.8) (grey #C0C0C0, floating from about y 35.5 to 42.0, label above bar at top area); Asset sales 0.9 (grey, thin bar about y 46.8 to 48.0, label above); Debt (0.3) (grey, thin bar about y 46.8 to 47.5, label below); Shareholder distributions (8.1) (grey, about y 42.0 to 52.1, x about 34.3 to 37.6, label inside bar); Other (0.0) (grey hairline at about y 52.0, label below); 1Q23 cash $32.7 billion (total bar, blue #0C479D, from baseline to about y 52.0). A curly bracket below the CFO to Asset sales span (x about 10.3 to 25.6, y about 78.5) is labelled '$ 11.4 billion free cash flow' in bold, centred above the bracket. Legend: none. Highlighted points: the CFO bar is the only green bar. Bars are flat with no outline. The chart is not cropped.
Slide 13
2Q23 outlook
Upstream
• Seasonal scheduled maintenance and
divestments to lower net volumes by ~110 Koebd
Product
Solutions
• First full quarter of Beaumont refinery expansion
operations
• Lower scheduled maintenance
Energy Products
Chemical Products
• Lower scheduled maintenance
Specialty Products
• Higher scheduled maintenance
Corporate
• Corporate and financing expenses expected to be
~$400 million
• Unfavorable working capital impact of ~$3 billion
driven by seasonal cash tax payments
See Supplemental Information for definitions.
13
Visuals: One photograph on the right: a low-angle view up a steel industrial structure with a blue sky, showing a worker in a white hard hat, safety glasses and dark work clothing holding a tablet and gripping a metal handrail on a ladder or platform, with pipes and a curved cage structure behind him. Composition is vertical and full-height, cropped at the top and right edges, with natural daylight, strong blue sky (about #2A4FA0 to #5E8FD0) and grey-silver steel dominant. Overlays: the photo is not tinted, but the grey gradient panels fade into its left edge. Logo: the ExxonMobil wordmark in red at top right. Decorative: a small red tab at the top-left edge. No charts or tables.
Slide 14
2023 advantaged project start-ups meet global / needs and further enhance performance / ExxonMobil / Beaumont Refinery / Expansion / 1Q23 start-up / Baytown Performance / Chemicals / Mid-2023 start-up / Guyana Payara / Development / 4Q23 start-up / Permian Cowboy Central / Delivery Point Expansion / Phased 2023 start-up / Added 250 Kbd of crude / capacity / Largest U.S. refinery expansion / in >10 years / Integration advantage with / Permian assets / $200-$300 million annual / earnings at average margins1 / Adds 750 Kta of performance / chemicals production / Entry into linear alpha olefins / market / $150-$225 million annual / earnings at average margins1 / 3rd major offshore / development / 220 Kbd of new production / capacity / FPSO arrived offshore in April / 3rd consecutive FPSO starting / ahead of schedule / Unique scale advantage from / oil and gas handling facility / >50% increase in processing / capacity / Expands integration / advantage with U.S. Gulf / Coast assets / See Supplemental Information for footnotes and definitions. / 14
Visuals: Four photographs, each in a rectangular box with a thin shadow, in the same size and row: (1) Beaumont Refinery: a close view of steel process towers, pipe racks and yellow-railed walkways against a pale blue sky with white clouds, dense and detailed, full frame, daylight. (2) Baytown Performance Chemicals: an aerial view of a dense petrochemical plant with grey and white units, pipe racks, columns and a large parking lot of cars at the top, daylight, wide framing. (3) Guyana Payara Development: a side view of a floating production vessel (FPSO) on dark blue water under a blue sky, with a tall yellow derrick at the centre, a red, yellow and green striped band on the hull, white and orange superstructure, daylight. (4) Permian Cowboy Central Delivery Point Expansion: a view of tan and beige pipes, valves, vessels and a tall column against a pale blue sky and desert ground, daylight. The four photos are not cropped beyond their boxes and carry no overlay. Also a small red ExxonMobil wordmark logo at top right and a thin vertical red bar at the top left edge.
Slide 15
Key takeaways: strong performance underpinned by / structural earnings improvement / • A record first quarter following a record year / • Structural earnings improvement drives shareholder value creation / - Diversified portfolio delivers accretive growth opportunities through cycles / - Advantaged projects and mix improvements provide earnings and cash flow growth runway / - Structural cost improvements and robust cost control help drive performance / • Fortress balance sheet supports capital allocation priorities through cycles / • Uniquely positioned as leader in the energy transition / - Growing new Low Carbon Solutions business while reducing our own emissions / See Supplemental Information for definitions and reconciliations. / 15
Visuals: A red vertical tab at the left edge spanning roughly the title height (x 0 to 0.9%, y 2.5 to 20.7%), and the ExxonMobil logo in red at top right (x 86.8%, y 5.8%, w 10.0%, h 3.6%). No photographs, charts or diagrams; the background carries a faint light-grey geometric diagonal facet pattern.
Slide 16
Q&A / 04.28.23
Visuals: Photograph: a woman with dark curly hair, clear safety glasses and a light grey ExxonMobil work sweatshirt with a red ExxonMobil wordmark and a small US flag patch on the shoulder. She leans in from the left, looking to the right at a tall polished silver-metal cylindrical vessel, and holds a wooden folding ruler against it with a dark grey knit glove with a teal cuff. The vessel fills the right half of the frame, with a perforated metal base ring at its foot. The background is dark industrial equipment with pipes and a blue-lettered panel at the far right edge. Composition: medium close-up, subject at left third, vessel at right, slightly low angle. Lighting: cool, directional studio-style light with blue-tinted highlights on the metal and a dark, moody background. Dominant colours: silver grey, dark charcoal, light grey and blue, with a red accent in the sweatshirt logo. The photo is not cropped at the top and bottom; it is boxed to the right area of the slide, not full-bleed. A red vertical bar overlaps the photo's left edge (see elements). The white left panel has a faint diagonal light-grey gradient. Logo: ExxonMobil wordmark in white at top-right of the photo.
Slide 17
Outlook for second quarter 2023 / Upstream scheduled maintenance earnings impact¹ / Million USD / 600 / 400 / 200 / 0 / 2022 quarterly average / 4Q22 / 1Q23 / 2Q23 est. / 450 / 250 / Energy Products scheduled maintenance earnings impact³ / Million USD / 900 / 600 / 300 / 0 / 2022 quarterly average / 4Q22 / 1Q23 / 2Q23 est. / 530 / 390 / Chemical Products scheduled maintenance earnings impact² / Million USD / 300 / 200 / 100 / 0 / 2022 quarterly average / 4Q22 / 1Q23 / 2Q23 est. / 200 / 160 / Specialty Products scheduled maintenance earnings impact⁴ / Million USD / 90 / 60 / 30 / 0 / 2022 quarterly average / 4Q22 / 1Q23 / 2Q23 est. / 60 / 50 / See Supplemental Information for footnotes. / 17
Visuals: Four vertical bar charts with range brackets, all in the same style, each with the same categories on the x-axis (2022 quarterly average, 4Q22, 1Q23, 2Q23 est.). Bars are solid blue #0C479D with no outline and no data labels; values are not printed, so bar heights are estimates. Range brackets are black vertical lines with horizontal caps, labelled with their top and bottom values, and appear only in the 2Q23 est. column. Upstream chart: y-axis 0 to 600 Million USD with ticks at 0, 200, 400, 600; bars about 470 (2022 quarterly average), about 270 (4Q22), about 160 (1Q23); 2Q23 est. bracket from 250 (bottom) to 450 (top). Energy Products chart: y-axis 0 to 900 Million USD with ticks at 0, 300, 600, 900; bars about 410 (2022 quarterly average), about 260 (4Q22), about 650 (1Q23); 2Q23 est. bracket from 390 to 530. Chemical Products chart: y-axis 0 to 300 Million USD with ticks at 0, 100, 200, 300; bars about 170 (2022 quarterly average), about 200 (4Q22), about 245 (1Q23); 2Q23 est. bracket from 160 to 200. Specialty Products chart: y-axis 0 to 90 Million USD with ticks at 0, 30, 60, 90; bars about 35 (2022 quarterly average), about 32 (4Q22), about 33 (1Q23); 2Q23 est. bracket from 50 to 60. No legend and no highlighted points. Non-text elements also include a red vertical bar at the left edge and the ExxonMobil logo.
Slide 18
Upstream production supported by advantaged / projects / Upstream / Contributing factors to change in volumes / Koebd, net / 3,822 / (30) / (0) / 50 / (10) / 3,831 / 4Q22 / Divestments Entitlements / Growth / Downtime / other / 1Q23 / Increased production by ~10 Koebd versus 4Q22 / - Growth of ~50 Koebd, excluding impacts from / divestments, entitlements, and other factors 1 / Advantaged projects delivered growth despite loss from / divestments / - More than 5% production growth in Guyana and / Permian versus 4Q22 / See Supplemental Information for footnotes and definitions. / 18
Visuals: Vertical waterfall (bar) chart titled Upstream with subtitle Contributing factors to change in volumes and unit label Koebd, net. The y-axis has no printed scale or tick labels, and no axis range is given. Six columns from left to right: 4Q22 total bar with value 3,822 (solid blue, #0C479D); Divestments floating bar with value (30) (red #C00000, white label inside); Entitlements thin floating bar with value (0) (red #C00000, grey label below); Growth floating bar with value 50 (green #00A14D, white label inside); Downtime / other thin floating bar with value (10) (red #C00000, grey label above); 1Q23 total bar with value 3,831 (solid blue #0C479D). Bars are about 4.4 percent of slide width each and sit on a dark grey horizontal baseline from about x 3.1 to 51. A faint light grey vertical line runs at about x 3 from y 30 to 60 as a y-axis hint. No legend. Highlighted points: none beyond the colour coding of increases (green) and decreases (red). The ExxonMobil wordmark logo in red at top right (x 86.8, y 5.8, w 10.0, h 3.6) and a light grey background pattern of soft diagonal shapes covering the whole slide.
Slide 19
Supplemental information / ExxonMobil reported emissions, including reductions and avoidance performance data, are based on a combination of measured and estimated data. Calculations are based / on industry standards and best practices, including guidance from the American Petroleum Institute (API) and Ipieca. Emissions reported are estimates only, and / performance data depends on variations in processes and operations, the availability of sufficient data, the quality of those data and methodology used for measurement / and estimation. Emissions data is subject to change as methods, data quality, and technology improvements occur, and changes to performance data may be updated. / Emissions, reductions and avoidance estimates for non-ExxonMobil operated facilities are included in the equity data and similarly may be updated as changes in the / performance data are reported. ExxonMobil’s plans to reduce emissions are good faith efforts based on current relevant data and methodology, which could be changed or / refined. ExxonMobil works to continuously improve its approach to identifying, measuring and addressing emissions. ExxonMobil actively engages with industry, including / API and Ipieca, to improve emission factors and methodologies, including measurements and estimates. / All references to production rates, project capacity, resource size, and acreage are on a gross basis, unless otherwise noted. / Actions needed to advance the Company’s 2030 greenhouse gas emission-reductions plans are incorporated into its medium-term business plans, which are updated / annually. The reference case for planning beyond 2030 is based on the Company’s Energy Outlook research and publication. The Outlook is reflective of the existing global / policy environment. The Energy Outlook does not attempt to project the degree of required future policy and technology advancement and deployment for the world, or / ExxonMobil, to meet net zero by 2050. As future policies and technology advancements emerge, they will be incorporated into the Outlook, and the Company’s business / plans will be updated accordingly. / ExxonMobil has business relationships with thousands of customers, suppliers, governments, and others. For convenience and simplicity, words such as venture, joint / venture, partnership, co-venturer, operated by others, and partner are used to indicate business and other relationships involving common activities and interests, and those / words may not indicate precise legal relationships. / See the Cautionary Statement at the front of this presentation for additional information regarding forward-looking statements. / 19
Slide 20
Supplemental Information
ExxonMobil
DEFINITIONS AND NON-GAAP FINANCIAL MEASURE RECONCILIATIONS
Capital and exploration expenditures (Capex). Represents the combined total of additions at cost to property, plant and equipment, and exploration expenses on a before-
tax basis from the Consolidated Statement of Income. ExxonMobil’s Capex includes its share of similar costs for equity companies. Capex excludes assets acquired in
nonmonetary exchanges, the value of ExxonMobil shares used to acquire assets, and depreciation on the cost of exploration support equipment and facilities recorded to
property, plant and equipment when acquired. While ExxonMobil’s management is responsible for all investments and elements of net income, particular focus is placed on
managing the controllable aspects of this group of expenditures.
Cash operating expenses excluding energy and production taxes. Subset of total operating costs that are stewarded internally to support management’s oversight of
spending over time. This measure is useful for investors to understand our efforts to optimize cash through disciplined expense management for items within management’s
control.
Debt to capital (debt-to-capital, debt-to-capital ratio, leverage). Total debt / (total debt + total equity). Total debt is the sum of (1) Notes and loans payable and (2) Long-
term debt, as reported in Form 10-Q along with Total equity.
Distributions to shareholders (shareholder distributions). The Corporation distributes cash to shareholders in the form of both dividends and share purchases. Shares are
acquired to reduce shares outstanding and offset shares or units settled in shares issued in conjunction with company benefit plans and programs. For purposes of
calculating distributions to shareholders, the Corporation includes only the cost of those shares acquired to reduce shares outstanding.
Divestments. Refers to asset sales; results include associated cash proceeds and production impacts, as applicable, and are consistent with our internal planning.
Net debt to capital (net debt-to-capital). Defined as “net debt / (net debt + total equity)” where net debt is net of cash and cash equivalents, excluding restricted cash.
Operating costs (Opex). Operating costs are the costs during the period to produce, manufacture, and otherwise prepare the company’s products for sale – including
energy, staffing, and maintenance costs. They exclude the cost of raw materials, taxes, and interest expense and are on a before-tax basis. While ExxonMobil’s management
is responsible for all revenue and expense elements of net income, operating costs, as defined above, represent the expenses most directly under management’s control,
and therefore are useful for investors and ExxonMobil management in evaluating management’s performance. For information concerning the calculation and reconciliation
of operating costs see the table on slide 22.
20
Visuals: Non-text elements: (1) A full-slide, very faint light-grey background image of large angular diagonal planes and soft shadows, sitting behind everything. (2) A narrow solid red vertical bar at the far left edge, from about 2.5% to 20.7% of the slide height, flush with the left edge. (3) The ExxonMobil wordmark logo in red at top-right, with the red 'X' letterform stylised as crossing swooshes. No photographs, charts, tables or diagrams.
Slide 21
Supplemental Information
DEFINITIONS AND NON-GAAP FINANCIAL MEASURE RECONCILIATIONS
Performance product (performance chemicals). Refers to Chemical products that provide differentiated performance for multiple applications through enhanced properties versus commodity alternatives and bring significant additional value to customers and end-users.
Project. The term “project” as used in this presentation can refer to a variety of different activities and does not necessarily have the same meaning as in any government payment transparency reports. Projects or plans may not reflect investment decisions made by the company. Individual opportunities may advance based on a number of factors, including availability of supportive policy, technology for cost-effective abatement, and alignment with our partners and other stakeholders. The company may refer to these opportunities as projects in external disclosures at various stages throughout their progression.
Returns, rate of return, IRR. Unless referring specifically to external data, references to returns, rate of return, IRR, and similar terms mean future discounted cash flow returns on future capital investments based on current company estimates. Investment returns exclude prior exploration and acquisition costs.
Structural cost savings (structural cost reductions, structural savings, structural cost improvements). Structural cost savings describe decreases in cash operating expenses excluding energy and production taxes as a result of operational efficiencies, workforce reductions and other cost saving measures that are expected to be sustainable compared to 2019 levels. Relative to 2019, estimated cumulative annual structural cost savings totaled $7.2 billion, which includes an additional $0.3 billion in the first three months of 2023. The total change between periods in expenses will reflect both structural cost savings and other changes in spend, including market factors, such as inflation and foreign exchange impacts, as well as changes in activity levels and costs associated with new operations. Estimates of cumulative annual structural savings may be revised depending on whether cost reductions realized in prior periods are determined to be sustainable compared to 2019 levels. Structural cost savings are stewarded internally to support management’s oversight of spending over time. This measure is useful for investors to understand our efforts to optimize spending through disciplined expense management. For information concerning the calculation and reconciliation of operating costs see the table on slide 22.
Structural earnings improvements. Structural earnings improvements consist of efforts to improve earnings on a like-for-like price and margin basis and incorporate improvement efforts by the corporation such as growing advantaged assets, mix improvements, and structural cost reductions.
21
Visuals: None. No chart, table, photograph or illustration; only a faint grey geometric background facet pattern, a red vertical accent bar and the ExxonMobil wordmark.
Slide 22
Supplemental Information / CALCULATION OF STRUCTURAL COST SAVINGS / 2019 / 2022 / 1Q22 / 1Q23 / Components of operating costs / From ExxonMobil’s Consolidated statement of income (U.S. GAAP) / Production and manufacturing expenses / 36.8 / 42.6 / 10.2 / 9.4 / Selling, general and administrative expenses / 11.4 / 10.1 / 2.4 / 2.4 / Depreciation and depletion (includes impairments) / 19.0 / 24.0 / 8.9 / 4.2 / Exploration expenses, including dry holes / 1.3 / 1.0 / 0.2 / 0.1 / Non-service pension and postretirement benefit expense / 1.2 / 0.5 / 0.1 / 0.2 / Subtotal / 69.7 / 78.2 / 21.8 / 16.4 / ExxonMobil’s share of equity company expenses (Non-GAAP) / 9.1 / 13.0 / 2.6 / 2.7 / Total operating costs (Non-GAAP) / 78.8 / 91.2 / 24.4 / 19.1 / Less: / Depreciation and depletion (includes impairments) / 19.0 / 24.0 / 8.9 / 4.2 / Non-service pension and postretirement benefit expense / 1.2 / 0.5 / 0.1 / 0.2 / Other adjustments (includes equity company depreciation and depletion) / 3.6 / 3.5 / 0.8 / 0.8 / Total cash operating expenses (cash opex) (Non-GAAP) / 55.0 / 63.2 / 14.6 / 13.9 / Energy and production taxes (Non-GAAP) / 11.0 / 23.8 / 5.2 / 4.3 / Total cash operating expenses (cash opex) excluding energy and production taxes (Non-GAAP) / 44.0 / 39.4 / 9.4 / 9.6 / vs. 2019 / vs. 1Q22 / Cumulative / Change: / -5 / +0.2 / Market / +3 / +0.2 / Activity/Other / -1 / +0.3 / Structural savings / -7 / -0.3 / -7.2 / Billions of dollars unless specified otherwise. / Due to rounding, numbers presented above may not add up precisely to the totals indicated. / 22
Visuals: Table titled 'CALCULATION OF STRUCTURAL COST SAVINGS'. Columns: label column, 2019, 2022, 1Q22, 1Q23, and a Cumulative column at far right. Rows: Components of operating costs (header); From ExxonMobil's Consolidated statement of income (U.S. GAAP) (header); Production and manufacturing expenses 36.8 / 42.6 / 10.2 / 9.4; Selling, general and administrative expenses 11.4 / 10.1 / 2.4 / 2.4; Depreciation and depletion (includes impairments) 19.0 / 24.0 / 8.9 / 4.2; Exploration expenses, including dry holes 1.3 / 1.0 / 0.2 / 0.1; Non-service pension and postretirement benefit expense 1.2 / 0.5 / 0.1 / 0.2; Subtotal 69.7 / 78.2 / 21.8 / 16.4; ExxonMobil's share of equity company expenses (Non-GAAP) 9.1 / 13.0 / 2.6 / 2.7; Total operating costs (Non-GAAP) 78.8 / 91.2 / 24.4 / 19.1; blank row; Less: (header); Depreciation and depletion (includes impairments) 19.0 / 24.0 / 8.9 / 4.2; Non-service pension and postretirement benefit expense 1.2 / 0.5 / 0.1 / 0.2; Other adjustments (includes equity company depreciation and depletion) 3.6 / 3.5 / 0.8 / 0.8; Total cash operating expenses (cash opex) (Non-GAAP) 55.0 / 63.2 / 14.6 / 13.9; Energy and production taxes (Non-GAAP) 11.0 / 23.8 / 5.2 / 4.3; Total cash operating expenses (cash opex) excluding energy and production taxes (Non-GAAP) 44.0 / 39.4 / 9.4 / 9.6. Lower sub-table with column headers vs. 2019 (column 2022), vs. 1Q22 (column 1Q23) and Cumulative: Change: -5 / +0.2; Market +3 / +0.2; Activity/Other -1 / +0.3; Structural savings -7 / -0.3 / -7.2. Figures are in billions of dollars; no chart. Rules: thin dark grey horizontal lines separate subtotal and total rows, with a heavier black rule under the total rows and under the Structural savings row. ExxonMobil logo: red wordmark with a stylised X crossed by a blue-grey accent, top right. Background has faint pale grey diagonal geometric shapes at top left and right edges.
Slide 23
Supplemental Information / ExxonMobil / FREE CASH FLOW / 1Q23 / Net cash provided by operating activities (U.S. GAAP) / 16,341 / Additions to property, plant and equipment / (5,412) / Proceeds associated with sales of subsidiaries, property, plant and equipment, and sales and returns of investments / 854 / Additional investments and advances / (445) / Other investing activities including collection of advances / 78 / Free cash flow (Non-GAAP) / 11,416 / Free cash flow is the sum of net cash provided by operating activities and net cash flow used in investing activities. This measure is useful when evaluating cash available for financing activities, including shareholder distributions, after investment in the business. Free cash flow is not meant to be viewed in isolation or as a substitute for net cash provided by operating activities. For information concerning the calculation and reconciliation of free cash flow for historical periods, please see the Frequently Used Terms available on the Investors page of the company's website at www.exxonmobil.com under the heading Resources. / CASH CAPITAL EXPENDITURES / 1Q23 / Additions to property, plant and equipment / 5,412 / Net investments and advances / 367 / Total cash capital expenditures / 5,779 / Cash capital expenditures (Cash Capex). Sum of Additions to property, plant and equipment, Additional investments and advances, and Other investing activities including collection of advances from the Consolidated Statement of Cash Flows. This measure is useful for investors to understand the current period cash impact of investments in the business. / Millions of dollars unless specified otherwise. / Due to rounding, numbers presented above may not add up precisely to the totals indicated. / 23
Visuals: Two tables. Table 1, header row FREE CASH FLOW with column heading 1Q23, rows: Net cash provided by operating activities (U.S. GAAP) 16,341; Additions to property, plant and equipment (5,412); Proceeds associated with sales of subsidiaries, property, plant and equipment, and sales and returns of investments 854; Additional investments and advances (445); Other investing activities including collection of advances 78; subtotal line Free cash flow (Non-GAAP) 11,416 in bold. Table 2, header row CASH CAPITAL EXPENDITURES with column heading 1Q23, rows: Additions to property, plant and equipment 5,412; Net investments and advances 367; total line Total cash capital expenditures 5,779 in bold. Each table has a thin dark rule above its total figure (right column only) and a full-width thin dark rule beneath the total row. Both header bars are blue gradients with white bold-caps text. Other visuals: the ExxonMobil wordmark in red at top-right; a red vertical tab at the far left edge; a faint grey diagonal geometric pattern on white in the background. No photographs or charts.
Slide 24
Supplemental Information
Slide 3
1. Based on ExxonMobil estimates using historical benchmarking results from Solomon
Associates.
Slide 4
1. 10-year range includes 2010-2019, a representative 10-year business cycle which avoids
the extreme outliers in both directions that the market experienced in the past three
years.
2. Source: S&P Global Platts.
3. Source: Intercontinental Exchange (ICE). 70%/30% weighting of Henry Hub and TTF
price based on the proportion of the reported ICE trade volumes.
4. Source: S&P Global Platts and ExxonMobil analysis. Net margin calculated by industry
capacity weighting of North America (U.S. Gulf Coast Maya – Coking, WTI - Cracking),
Northwest Europe (Brent – Catalytic Cracking), and Singapore (Dubai – Catalytic
Cracking) netted for industry average Opex, energy, and renewable identification
numbers (RINS).
5. Source: IHS Markit, Platts, and company estimates. Overall, chemical margin based on
industry capacity weighting of polyethylene, polypropylene, and paraxylene.
Polyethylene margin based on industry capacity weighting by region, grouped by
feedstock (North America + Middle East, Europe, Asia Pacific). Polypropylene margin
based on industry capacity weighting by region, grouped by feedstock (North America,
Europe, Asia Pacific + Middle East).
Slide 5
1. Net production.
Slide 8
1. Net production.
Slide 12
1. Includes PP&E adds of ($5.4) billion and net investments / advances of ($0.4) billion in
first quarter 2023.
Slide 14
1. Beaumont refinery expansion earnings potential based on average product margins
from both 2010-2019 and 2015-2019 and ExxonMobil analysis. Baytown chemical
expansion project earnings potential based on average applicable product margins from
2010-2019 and ExxonMobil analysis.
Slide 17
1. Estimate based on April prices.
2. Estimate based on operating expenses related to turnaround and planned maintenance
activities.
3. Estimate based on March margins and operating expenses related to turnaround and
planned maintenance activities.
4. Estimate based on operating expenses related to turnaround and planned maintenance
activities.
Slide 18
1. Net production.
24
Visuals: None apart from the faint background image, the red vertical accent bar at the left edge and the ExxonMobil wordmark logo at top-right.
Download this deck
The hosted PDF of every library deck is free for readers of the SlideDeck Co newsletter. Join with your email and the viewer and download appear here.
Preparing a results presentation or business update of your own? The SlideDeck Co Standard Deck is a slide library for business reviews, updates and plans.







