
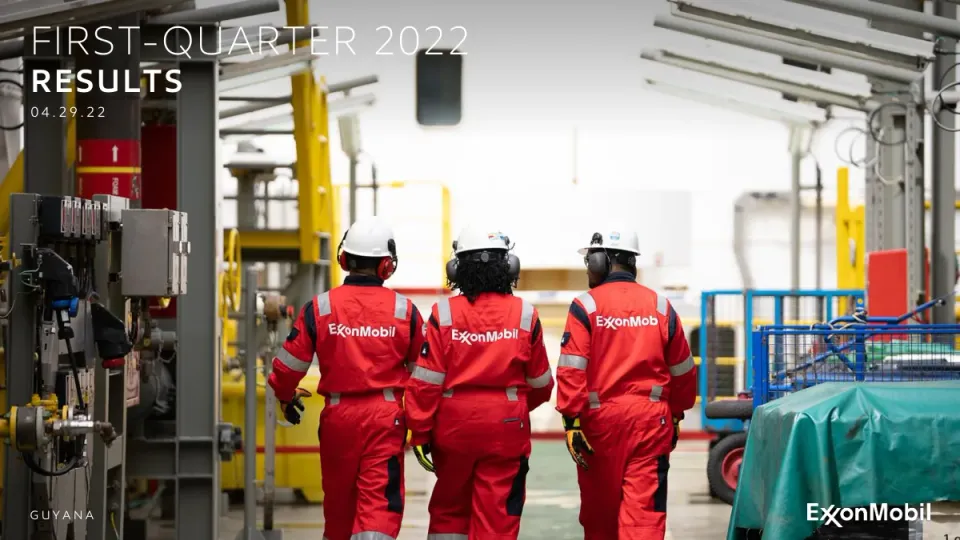
The deck opens with a cover for ExxonMobil's First-Quarter 2022 results, dated 04.29.22, followed by a long cautionary statement on forward-looking statements and non-GAAP measures. Slide 3 summarises the quarter under headline themes such as leading performance, essential partner and innovative solutions. The middle section covers the market environment, then first-quarter financial results and a bridge from 4Q21 to 1Q22 earnings. Segment slides for Upstream, Upstream volumes, Downstream and Chemical each pair a waterfall chart of earnings or volume drivers with short bullet commentary. Further slides cover cash management, a screen of enhanced disclosure reports, the second-quarter 2022 outlook by segment, the reorganised business model and the new Product Solutions segment. The closing takeaways slide leads into a Q&A divider, and the appendix holds the outlook for scheduled maintenance, definitions, reconciliations and footnotes. Slides worth studying are the waterfall charts on slides 7 and 9, which carry the message through simple bar shapes and colour, and the large-number financial results grid on slide 5.
Slides worth studying
- Slide 5: A four-cell grid of large numbers with short captions gives the headline results at a glance without dense text.
- Slide 7: The waterfall chart with green and red bars shows how each factor moved earnings, with one bullet per driver beside it.
- Slide 9: A second waterfall bridges Downstream earnings, with the timing effects colour-coded to separate them from underlying margin.
- Slide 3: A coloured theme strip sets the narrative frame for the whole quarter before the detailed sections begin.
Details
- Company: ExxonMobil
- Year: 2022
- Type: Investor presentation
- Industry: Energy
- Pages: 24
The hosted copy of this deck is being prepared. Newsletter readers will find the download here.
Review score: 8 out of 10, Strong
Presentation quality, judged with the SlideDeck Co review heuristic. Ask, evidence and idea merit are not rated here.
The strength is how openly the awkward parts of the quarter are laid out. Slide 6 states in its subtitle that 'Earnings of $5.5 billion includes $3.4 billion Russia charges' and walks the table from GAAP to ex-identified-items by segment; slide 9 extends the Downstream waterfall past an intermediate bar of $ 1,679 to show unsettled derivatives (760) and price timing (590) as separate steps down to $ 332, with a bullet saying the timing effects are 'expected to reverse or unwind over time'; and slide 7 breaks volume into weather (510), price entitlement (160) and scheduled maintenance (120). Slide 22 then maps those custom factors back to the standard categories. Outlook is kept apart: slide 13 by segment, and slide 18 with ranges drawn as bars against history ('$670 to $870 million'). At 24 pages it is tight and the footnotes are indexed by slide (slide 24). The bottleneck is the first financial page: slide 5 leads with '$8.8 billion' excluding identified items in the largest type, and the GAAP figure appears only on the next slide.
Worth keeping: Keep the two-stage waterfall on slide 9 and the factor-mapping tables on slides 22 and 23, which let a reader tie the custom bars back to the standard analysis.
Most useful repair: Put GAAP earnings of $5.5 billion and the $3.4 billion Russia charge on slide 5 next to the $8.8 billion tile, and replace slide 12 with a short list of the disclosures and where to find them.
What would change the score: If the Downstream figures on slide 9 do not tie to the slide 6 table when checked line by line, the transparency claim weakens and the score would fall to 7.
Confidence high. 24 of 24 pages inspected on contact sheets, 12 at readable size. Reviewed 2026-11-15. Model-assisted review (claude-fable-5-2, in session).
Full text of the slides (24 slides)
Every slide's words and a description of its charts and images, so the deck can be searched and rebuilt. Also available as Markdown.
Slide 1
FIRST-QUARTER 2022
RESULTS
04.29.22
GUYANA
ExxonMobil
Visuals: Photograph of three workers in red ExxonMobil coveralls, white hard hats and ear defenders, seen from behind walking away along an industrial plant walkway. The worker on the left wears red ear defenders and white hard hat, the middle worker has curly dark hair with black ear defenders and a white hard hat with stickers, the right worker wears grey ear defenders and glasses under a white hard hat. Reflective silver stripes run across the coveralls and yellow gloves are visible. Left foreground holds grey steel frames, electrical cabinets, valves and yellow pipework; right side shows blue safety railings, a blue cage and a green tarpaulin over equipment. Overhead fluorescent light fittings and pipes run along the top. Lighting is bright, diffuse daylight-style indoor light, soft and even with a light grey-white haze in the background. Dominant colours are red, grey, yellow, white and teal. Full-bleed, uncropped at edges, no overlay. A white ExxonMobil logo sits at bottom-right over the tarp.
Slide 2
CAUTIONARY STATEMENT
FORWARD-LOOKING STATEMENTS. Statements of future events, conditions, or expectations in this presentation or the subsequent discussion period are forward-looking statements. Similarly, emission-reduction roadmaps to drive toward net zero are dependent on future market factors, such as continued technological progress and policy support, and represent forward-looking statements. Actual future results, including financial and operating performance; earnings, cash flow, and rates of return; total capital expenditures and mix, including allocations of capital to low carbon solutions; cost reductions and efficiency gains, including the ability to meet or exceed announced cost and expense reduction objectives; plans to reduce future emissions and emissions intensity; technology efforts, including timing and outcome of projects to capture and store CO2, produce biofuels and use plastic waste as recycled feedstock; achievement of ambitions to reach Scope 1 and Scope 2 net zero from operated assets by 2050, or Scope 1 and Scope 2 net zero in Upstream Permian operated assets by 2030, the elimination of routine flaring in-line with World Bank Zero Routine Flaring, or the completion of major asset emission-reduction roadmaps; maintenance and turnaround activity; price and margin recovery; shareholder distributions; the ability to access debt markets; resource recoveries and production rates; and product sales levels and mix could differ materially due to a number of factors including global or regional changes in oil, gas, petrochemicals, or feedstock prices, differentials, or other market or economic conditions affecting the oil, gas, and petrochemical industries and the demand for our products; the impact of trading activities; policy and consumer support for emission-reduction products and technology; the outcome of competitive bidding and project wins; regulatory actions targeting public companies in the oil and gas industry; changes in local, national, or international laws, regulations, and policies affecting our business including with respect to the environment; the development and transportation of our products; taxes, trade sanctions, and actions taken in response to pandemic concerns; the pace of regional and global economic recovery from the pandemic and the occurrence and severity of future outbreaks; the ability to realize efficiencies within and across our business lines and to maintain cost reductions without impairing our competitive positioning; the outcome and timing of exploration and development projects; reservoir performance, including variability in unconventional projects; timely completion of construction projects; war and other security disturbances; actions of consumers and changes in consumer preferences; opportunities for and regulatory approval of investments or divestments that may arise; the outcome of our or competitors’ research efforts and the ability to bring new technology to commercial scale on a cost-competitive basis; the development and competitiveness of alternative energy and emission reduction technologies; unforeseen technical or operating difficulties including the need for unplanned maintenance; and other factors discussed here and in Item 1A. Risk Factors of our Annual Report on Form 10-K and under the heading “Factors Affecting Future Results” available through the Investors page of our website at exxonmobil.com. All forward-looking statements are based on management’s knowledge and reasonable expectations at the time of this presentation and we assume no duty to update these statements as of any future date. Neither future distribution of this material nor the continued availability of this material in archive form on our website should be deemed to constitute an update or re-affirmation of these figures as of any future date. Any future update of these figures will be provided only through a public disclosure indicating that fact.
Reconciliations and definitions of non-GAAP and other terms are provided in the text or in the supplemental information accompanying these slides beginning on page 19.
2
Slide 3
SUSTAINABLY GROWING SHAREHOLDER VALUE
Create sustainable solutions that improve quality of life and meet society’s evolving needs
Leading Performance | Essential Partner | Advantaged Portfolio | Innovative Solutions | Meaningful Development
• Building a competitively advantaged production portfolio
− Achieved Liza Phase 2 first oil, made Yellowtail final investment decision, announced five new Guyana discoveries, and increased the estimated recoverable resource for the Stabroek Block to nearly 11 billion oil-equivalent barrels
− Payara project FPSO construction running ~5 months ahead of schedule; start-up likely before year-end 2023
− Reached Permian production of ~560 Koebd at end of the first quarter;¹ on track for 25% annual increase
− Executing LNG growth plan; Coral South FLNG commissioning underway with first cargo in 4Q 2022
• Advancing accretive Low Carbon Solutions initiatives and reducing our own emissions
− Announced plans for Baytown hydrogen plant and CCS, supporting development of Houston hub
− Reached final investment decision on expansion of LaBarge CCS facility
− Received top certification for methane emissions management at Poker Lake
• Delivering scale and integration benefits through significant business reorganization
− Combined world-scale Downstream and Chemical organizations to grow high-value products, improve competitiveness, and lead in sustainability
− Consolidated single technology organization to focus and deploy technologies to highest-value opportunities
− Central operations and sustainability group optimizing maintenance practices and emission-reduction programs
See Supplemental Information for definitions and footnotes.
3
Visuals: One horizontal rectangular banner, filled with a left-to-right blue gradient from dark blue #0C479D to bright cyan #00B0F0, containing five white phrases separated by vertical bar characters. No photographs, charts, tables, logos or icons. A very faint light-grey blurred shading band sits behind the upper part of the slide.
Slide 4
MARKET ENVIRONMENT
Crude, natural gas, and refining margins strengthened due to ongoing tight supply / demand balance
PRICES / MARGINS
10-year annual range1
• Continued tight crude supply with recovering demand
• Supply uncertainty, low inventory levels, and growing demand further increased natural gas prices
• Global demand recovery and ongoing supply pressure increasing refining margins
• Compressed chemical margins due to lag in pricing with rising feed and energy costs
– Bottom-of-cycle conditions in Asia Pacific; higher margins in Atlantic Basin
Crude2 ($/bbl)
Natural gas3 ($/mbtu)
Refining margins4 ($/bbl)
Chemical margins5 ($/tonne)
◆ 1Q21 ◆ 4Q21 ◆ 1Q22 ■ 10-year range
See Supplemental Information for footnotes.
4
Visuals: Chart: dot-and-range plot titled PRICES / MARGINS, subtitle 10-year annual range with superscript 1. Vertical value axis (no printed tick labels) with a break mark near 40% of slide height, horizontal zero baseline at about 63% of slide height. Four categories on the x-axis: Crude ($/bbl), Natural gas ($/mbtu), Refining margins ($/bbl), Chemical margins ($/tonne). Each category has a light blue-grey vertical bar showing the 10-year range, all bars with the same top and bottom (about 45% and 63% of slide height). Series, with values estimated because no numbers are printed: 1Q21 black diamonds (Crude about 58.8% height, Natural gas about 58.5%, Refining margins about 76.7%, Chemical margins about 44.2%); 4Q21 blue diamonds (Crude about 53.7%, Natural gas about 36.1%, Refining margins about 60.0%, Chemical margins about 52.6%); 1Q22 red diamonds (Crude about 47.8%, Natural gas about 28.2%, Refining margins about 51.0%, Chemical margins about 64.8%). Legend below the chart: black diamond 1Q21, blue diamond 4Q21, red diamond 1Q22, light blue-grey square 10-year range. No highlighted points beyond the colour coding. Photographs and logos: none.
Slide 5
FIRST-QUARTER FINANCIAL RESULTS
Earnings
$8.8 billion
ext. identified items; higher Upstream / realizations and refining margins offset by / derivative impacts1
Structural savings
>$5 billion
versus 2019; on track to exceed $9 / billion in annual savings by 2023
Capex
$4.9 billion
consistent with full-year range of / $21—24 billion
Cash flow from operations
$14.8 billion
increased cash balance by $4.3 billion / after funding capex, shareholder / distributions, and debt reduction
Debt-to-capital ratio
21 %
reduced net debt-to-capital to 17%
Shareholder distributions
$5.8 billion
including 2/3 dividends and 1/3 share / repurchases
1Reconciliation to U.S. GAAP on page 6. / See Supplemental Information for definitions.
5
Slide 6
RESULTS 1Q22 VS. 4Q21 / Earnings of $5.5 billion includes $3.4 billion Russia charges; strong Upstream realizations offset by derivative impacts and volume / (table) U/S / D/S / CHEM / C&F / TOTAL / 4Q21 GAAP Earnings / (Loss) $6.1 $1.5 $1.9 ($0.6) $8.9 / Announced divestments 0.5 0.0 0.6 (0.0) 1.1 / Impairments (0.8) - - - (0.8) / Contractual provisions (0.3) - - - (0.3) / 4Q21 Earnings / (Loss) ex. identified items $6.6 $1.5 $1.3 ($0.6) $8.8 / Price / margin1 2.2 (0.3) (0.2) - 1.7 / Unsettled derivatives: mark-to-market (0.0) (0.8) - - (0.8) / Volume (1.0) (0.3) 0.1 - (1.1) / Expenses 0.2 0.2 0.2 - 0.5 / Other (0.3) 0.0 0.0 (0.0) (0.3) / 1Q22 Earnings / (Loss) ex. identified items $7.7 $0.3 $1.4 ($0.6) $8.8 / Russia Sahkalin-1 charges (3.3) - - (0.1) (3.4) / 1Q22 GAAP Earnings / (Loss) $4.5 $0.3 $1.4 ($0.7) $5.5 / • Improved liquids realizations partially offset by unfavorable / Downstream timing effects and weaker Chemical margins / – Tight oil and gas supply / – Increased refining margins on product demand recovery offset by / price timing impacts / – Higher chemical feed costs and softening demand in Asia / • Unfavorable unsettled derivatives in rising crude price / environment / • Lower volumes mainly due to Upstream price entitlements and / weather-related impacts, Downstream turnarounds, and two / fewer days in the quarter / • Lower expenses across all businesses driven by reduced / turnarounds / maintenance and continued structural efficiencies / • Other driven by absence of favorable one-time asset / management and tax items in 4Q21 / Billions of dollars unless specified otherwise. / Due to rounding, numbers presented above may not add up precisely to the totals indicated. / See Supplemental Information for footnotes and definitions. / 6
Visuals: One table, no chart. Columns: row label, U/S, D/S, CHEM, C&F, TOTAL. Header row (navy #0C479D fill, white bold text) is blank in the label columns with U/S, D/S, CHEM, C&F, TOTAL labels. Row values are listed in the text above and are exact. Rows 4Q21 GAAP Earnings / (Loss), 4Q21 Earnings / (Loss) ex. identified items, 1Q22 Earnings / (Loss) ex. identified items and 1Q22 GAAP Earnings / (Loss) are shaded light grey #D9D9D9 with bold text; the other rows are white with regular text. Thin black horizontal rules separate the subtotal blocks: above 4Q21 ex. identified items, above 1Q22 ex. identified items, and above and below 1Q22 GAAP Earnings / (Loss). Superscript 1 follows Price / margin. Negative values are in parentheses; a dash marks zero. No photographs, logos or icons.
Slide 7
UPSTREAM PERSPECTIVE
Earnings improvement driven by tight supply / demand balance and lower expenses
CONTRIBUTING FACTORS TO CHANGE IN EARNINGS
Million USD
2,160
(510)
(160)
(120)
(160)
230
(330)
$ 7,743
$ 6,628
4Q21 ex. Ident. items
Price
Weather / day effect
Price entitlement
Sched. maint.
Other volume
Expenses
Other
1Q22 ex. ident. items
• Price improvement driven by higher liquids realizations
• Volume impacted by atypical factors:
− Severe weather-related impacts in Canada
− Two fewer days this quarter
• Additionally, volumes down with lower entitlements due to higher price, scheduled maintenance, and divestments
• Expenses lower with continued structural cost reductions
• Other reflects absence of favorable one-time asset management and tax items in 4Q21
See Supplemental Information for definitions and reconciliations.
7
Visuals: One waterfall chart, Contributing factors to change in earnings, unit Million USD. There are no printed axes, gridlines or axis ranges; the bars sit on a black horizontal baseline at about y 79.8%. Bars in order, left to right, with labelled values: 4Q21 ex. Ident. items total $6,628 (blue, total bar); Price +2,160 (green, rising); Weather / day effect (510) (red); Price entitlement (160) (red); Sched. maint. (120) (red); Other volume (160) (red); Expenses 230 (green); Other (330) (red); 1Q22 ex. ident. items total $ 7,743 (blue, total bar). Totals and increments are printed values; the bar heights are drawn to a common scale, about 0.0054 percent of slide height per million USD, so the drawn heights are estimates. Totals are bold. Green marks increases and red marks decreases; blue marks totals. No legend and no highlighted points. Bars are flat rectangles with no outlines or shadows.
Slide 8
UPSTREAM VOLUMES
Volumes impacted by adverse weather, scheduled maintenance, and lower entitlements
CONTRIBUTING FACTORS TO CHANGE IN VOLUMES
Koebd
3,816
(70)
(50)
15
(30)
(5)
3,675
Weather
Scheduled
maint.
Price
entitlement
Growth
Curtailment
/ other
1Q22
4Q21
• Weather-related impacts in Canada early in the quarter
• Scheduled maintenance in Qatar and Guyana
• Lower price-driven entitlements
• Growth in Guyana and U.S. Unconventional
– Liza Phase 2 ramp-up
• Permian production of ~560 Koebd at end of the first quarter1
See Supplemental Information for footnotes and reconciliations.
8
Visuals: Waterfall (bridge) chart, titled 'CONTRIBUTING FACTORS TO CHANGE IN VOLUMES' with unit 'Koebd' (thousand oil-equivalent barrels per day). No y-axis or gridlines are printed; the value axis is unlabelled and runs implicitly from 0 at the baseline (about y 85.5%) upward, with two axis-break marks (white-filled diagonal double slashes on a dark outline) cutting both total bars at about y 67 to 70%. Horizontal category axis: a thin black baseline at about y 85.5%, x 3.2 to 48.0%. Seven categories left to right with printed values: 4Q21 total bar 3,816 (blue, value label above bar, bold); Weather (70) (red, floating, labelled inside bar in white); Scheduled maint. (50) (red, labelled inside in white); Price entitlement (30) (red, label below bar in black); Growth 15 (green, label above bar in black); Curtailment / other (5) (red, very thin bar, label below in black); 1Q22 total bar 3,675 (blue, value label above bar, bold). Series: one series, totals in #0C479D blue, decreases in #C00000 red, increase in green (about #00A24F); estimated values for the green and red bars are not printed beyond the labels given. No legend. No highlighted points beyond colour coding of increase versus decrease. Bar geometry as measured: 4Q21 bar x 4.6 to 8.2%, y 37.8 to 85.0%; 1Q22 bar x 43.2 to 46.8%, y 50.7 to 85.0%; Weather bar x 11.0 to 14.6%, y 37.8 to 52.0% (measured height 14.2%; the file's recorded width of 29.3% is inconsistent with the visible bar, which is about 3.6% wide). Scheduled maint. bar about x 17.5 to 21.0%, y 44.3 to 48.8%; Price entitlement bar about x 23.9 to 27.5%, y 48.8 to 51.9%; Growth bar about x 30.3 to 33.9%, y 50.3 to 51.9%; Curtailment bar about x 36.8 to 40.3%, y 50.4 to 50.7%.
Slide 9
DOWNSTREAM PERSPECTIVE
Improved industry margins more than offset by unfavorable derivatives and price timing of trades
CONTRIBUTING FACTORS TO CHANGE IN EARNINGS
Million USD
$ 1,679
30
(310)
620
(280)
160
$ 1,463
(760)
(590)
$ 332
4Q21 ex.
ident.
items
Industry
fuels
margin
Industry
basestocks
margin
Volume
Expenses
Other
1Q22 ex. Unsettled
derivatives derivatives
and price
timing
Price
timing
1Q22 ex.
ident.
items
Improved refining margins partly
offset by lower basestocks margin
Lower volumes driven by higher
turnaround activity
Continued delivery of structural cost
reductions partially offset by higher
turnaround expenses
Mark-to-market on unsettled
derivatives in rising price environment
Unfavorable price timing effects are
expected to reverse or unwind over
time
See Supplemental Information for definitions and reconciliations.
9
Visuals: One waterfall (bridge) chart titled 'CONTRIBUTING FACTORS TO CHANGE IN EARNINGS' with unit label 'Million USD'. No value axis, gridlines or legend are printed; values are printed on each bar. The horizontal baseline is a thin black line at about y 77.7%. Bars from left to right, with printed values: (1) 4Q21 ex. ident. items, blue total bar, $ 1,463 printed above it; (2) Industry fuels margin, green increase bar, 620 printed inside; (3) Industry basestocks margin, red decrease bar, (310) printed inside; (4) Volume, red decrease bar, (280) printed inside; (5) Expenses, green increase bar, 160 printed inside; (6) Other, thin green increase bar, 30 printed above; (7) 1Q22 ex. derivatives and price timing, blue total bar, $ 1,679 printed above; (8) Unsettled derivatives, red decrease bar, (760) printed inside; (9) Price timing, red decrease bar, (590) printed inside; (10) 1Q22 ex. ident. items, blue total bar, $ 332 printed above. Blue totals are $1,463, $1,679 and $332 million; the net bars sum consistently with the printed deltas. No highlighted points beyond colour coding: green for positive contributions, red for negative, blue for totals.
Slide 10
CHEMICAL PERSPECTIVE
Strong earnings driven by resilient demand and continued cost reductions, partially offset by lower margins
CONTRIBUTING FACTORS TO CHANGE IN EARNINGS
Million USD
$ 1,354
$ 1,291
(240)
150
100
50
4Q21 ex.
ident. items
Margin
Volume
Expenses
Other
1Q22 ex.
ident. items
•
Lower margins due to lag in pricing with rising feed and
energy costs
−
Asia Pacific margins impacted by industry supply length
−
Atlantic Basin margins remain strong driven by ethane feed
advantage and continued industry logistics constraints
•
Volume higher on production mix improvement
•
Expenses driven by continued delivery of structural cost
reductions and lower planned maintenance
•
Corpus Christi Chemical Complex positive cash flow and
earnings while ramping to full production
See Supplemental Information for definitions.
10
Visuals: One waterfall chart titled 'CONTRIBUTING FACTORS TO CHANGE IN EARNINGS' with unit line 'Million USD'. Categories left to right on a horizontal baseline: '4Q21 ex. ident. items' (total bar, $ 1,291, blue), 'Margin' (floating bar, (240), red, descending from about the top of the first bar to about the level of the volume bar), 'Volume' (floating bar, 100, green), 'Expenses' (floating bar, 150, green), 'Other' (floating bar, 50, green, top of stack), '1Q22 ex. ident. items' (total bar, $ 1,354, blue). No numeric axis or gridlines are printed; the values are the printed bar labels in Million USD. Totals are labelled above the bars; deltas are labelled inside the floating bars. No legend. No highlighted points beyond the colour coding: blue totals, red negative, green positive. Bar values are relative: the 1,291 and 1,354 bars reach about 39% and 36% of the chart's upper height as drawn.
Slide 11
1Q22 CASH MANAGEMENT
Delivering on capital allocation priorities
CASH FLOW
Billion USD
$6.8
CFO
14.8
(4.2)
0.3
(0.7)
(5.8)
(0.1)
$11.1
$11 billion free
cash flow
4Q21 cash
PP&E / I&A1
Asset sales
Debt
Shareholder distributions
Other
1Q22 cash
•
Distributed $5.8 billion to shareholders, including $3.8 billion in dividends and $2.1 billion in share repurchases
•
First-quarter capex of $4.9 billion consistent with 2022 plan
•
Debt-to-capital of 21% at low end of 20-25% range; reduced net debt-to-capital to 17%
•
Increasing share repurchases up to a total of $30 billion through 2023 2
See Supplemental Information for footnotes, definitions, and reconciliations.
11
Visuals: Chart: vertical waterfall (floating-bar) chart titled CASH FLOW, with units Billion USD. No axis lines or numeric axis scale are printed; the baseline is a horizontal black rule at about y 85%. Bars from left to right: 4Q21 cash $6.8 (solid blue total bar, value printed above); CFO 14.8 (green floating bar, value printed inside in white); PP&E / I&A1 (4.2) (grey floating bar, value printed inside in black, in parentheses); Asset sales 0.3 (thin grey floating bar, value printed above); Debt (0.7) (thin grey floating bar, value printed below); Shareholder distributions (5.8) (grey floating bar, value printed inside); Other (0.1) (very thin grey bar, value printed below); 1Q22 cash $11.1 (solid blue total bar, value printed above). Highlighted points: the CFO bar is the only green bar and the two cash totals are the only blue bars. Bracket: a thin black brace beneath the CFO through Asset sales bars labelled $11 billion free / cash flow in bold, centred. Legend: none. Gridlines: none. No photographs, logos or icons.
Slide 12
ENHANCED DISCLOSURES
Providing increased granularity and transparency to the investment community
12
Visuals: Six images, all boxed with thin dark edges and no corner radius, overlapping each other. (1) Left-top: 'ADVANCING CLIMATE SOLUTIONS 2022 PROGRESS REPORT' cover, aerial view of a city skyline curving over the horizon in pale blue sky and haze, with an ExxonMobil logo in red at top left and white capitals text. (2) Centre-top: '2020 Lobbying Report' cover, deep blue background with a white US Capitol dome and colonnade at bottom, a red ExxonMobil logo top right, and a white diagonal 'New' corner ribbon top left. (3) Right-top: 'ExxonMobil Sustainability Report Highlights' photo of two workers in blue coveralls, white hard hats, headlamps and face masks, one in focus at left, the second blurred at right, grey industrial background, warm daylight; white text overlay on the lower right of the photo. (4) Left-lower: 1Q 2022 Earnings Release page, a white portrait document with red ExxonMobil logo, 'EXHIBIT 99.1', bullet paragraphs in small blue and black text, a 'Results Summary' table, and an 'IRVING, Texas - April 29, 2022' dateline; it overlaps the left cover image. (5) Centre-lower: '2021 Climate Lobbying Report' cover, blue sky with white clouds over green mountains, a conifer tree line at right and a gravel path in the foreground, red ExxonMobil logo top right, white diagonal 'New' ribbon top left, title in white at upper left. (6) Right-lower: 'INVESTING IN PEOPLE' photo, a man with glasses and a woman in a red top working at a laptop in front of a large colourful weather-map screen (blue, green, yellow, red), red ExxonMobil logo top right, white diagonal 'New' ribbon top left, bold white capitals 'INVESTING / IN PEOPLE' bottom left on a black band. Earnings release table (Results Summary), columns: Dollars in millions (except per share data) | 1Q22 | 4Q21 | Change vs 4Q21 | 1Q21 | Change vs 1Q21. Rows: Earnings (U.S. GAAP) 5,486 | 8,870 | -3,390 | 2,730 | +2,750. Earnings Excluding Identified Items 8,833 | 8,795 | +38 | 2,761 | +6,072. Earnings Per Common Share 1.28 | 2.08 | -0.80 | 0.64 | +0.64. Earnings Excluding Identified Items Per Common Share 2.07 | 2.05 | +0.02 | 0.65 | +1.42. Capital and Exploration Expenditures 4,904 | 5,808 | -904 | 3,133 | +1,771. Table header is blue with white text; body is black on white with thin grey rules. Other visible release text: 'ExxonMobil Announces First-Quarter 2022 Results', 'Results Summary', 'IRVING, Texas - April 29, 2022 - Exxon Mobil Corporation today announced estimated first-quarter 2022 earnings of $5.5 billion, or $1.28 per share assuming dilution.', and a closing quote attributed to Darren Woods, chairman and chief executive officer. Text is too small to transcribe fully at this scale.
Slide 13
SECOND-QUARTER 2022 OUTLOOK / Upstream / • Higher volumes driven by Permian and Guyana growth, absence of severe weather events, / and limited European seasonal gas demand impact / • Favorable lag timing expected in LNG pricing / • Higher scheduled maintenance / Product / Solutions / (new segment / reporting to / start in 2Q22) / Energy / Products / • Higher planned turnarounds and maintenance / • Tight supply / demand balance expected to persist in refining / • Reversal of some first-quarter price timing impacts / Chemical / Products / • Higher planned turnarounds and maintenance / • Continued length in Asia Pacific market / Specialty / Products / • Basestocks pricing catching up to rising feedstock costs / Corporate / • Corporate and financing expenses expected to be ~$600 million / • Monitoring inflationary pressures / 13
Visuals: A table with two columns and four row groups. Column 1 (blue #0C479D label cells, white bold-style text): Upstream; Product Solutions (with sub-column of three blue cells: Energy Products, Chemical Products, Specialty Products; and the italic note '(new segment reporting to start in 2Q22)' under the label); Corporate. Column 2 (white cells, black bullet text): Row Upstream holds three bullets: 'Higher volumes driven by Permian and Guyana growth, absence of severe weather events, and limited European seasonal gas demand impact'; 'Favorable lag timing expected in LNG pricing'; 'Higher scheduled maintenance'. Row Energy Products holds three bullets: 'Higher planned turnarounds and maintenance'; 'Tight supply / demand balance expected to persist in refining'; 'Reversal of some first-quarter price timing impacts'. Row Chemical Products holds two bullets: 'Higher planned turnarounds and maintenance'; 'Continued length in Asia Pacific market'. Row Specialty Products holds one bullet: 'Basestocks pricing catching up to rising feedstock costs'. Row Corporate holds two bullets: 'Corporate and financing expenses expected to be ~$600 million'; 'Monitoring inflationary pressures'. Behind the table is a full-slide white base with a faint pixelated grey shadow frame (107 by 55 pixel image) visible around the table edges, especially at the bottom and right, giving a soft drop-shadow look. No photographs, charts, logos or icons.
Slide 14
EVOLVING OUR MODEL TO STRENGTHEN COMPETITIVENESS
Streamlined organization in place and yielding benefits
2022: DELIVERING SOLUTIONS
UPSTREAM
PRODUCT
SOLUTIONS
LOW CARBON
SOLUTIONS
TECHNOLOGY AND ENGINEERING
GLOBAL OPERATIONS AND SUSTAINABILITY
GLOBAL PROJECTS
GLOBAL SERVICES & CORPORATE FUNCTIONS
• New organization further captures benefits of scale and
integration
• Establishes central ownership for enterprise-wide
capabilities, practices, and processes
− Single technology organization allocates expertise and
experience to the highest-priority technical opportunities
− Global Operations and Sustainability harmonizing processes to
fully leverage scale and functional expertise
• Allows dynamic allocation of critical resources across
businesses
− Improves flexibility and speed to market
− Ensures highest-value opportunities prioritized across
corporation
• Product Solutions combines two world-class organizations
to fully leverage competitive advantages to grow sales of
high-value products
14
See
Supplemental
Information for
definitions.
Visuals: Diagram of seven gradient rectangles arranged in two blocks, all with square corners and no borders. Top block: three tall tiles in a row, each about 14.4 percent wide and 38 percent high, starting at y 27.2 percent with small gaps of about 0.8 percent. Left tile UPSTREAM, blue gradient running from light blue #0070C8 at top to deep blue #00559E at bottom-right. Middle tile PRODUCT SOLUTIONS, bright cyan-blue gradient from #00B4F0 at top to #0070C8 at bottom-left. Right tile LOW CARBON SOLUTIONS, gradient from yellow-green #C8D400 at top-right to green #00A040 at bottom-left. Bottom block: four full-width horizontal bars, each about 43.9 percent wide and 5.6 percent high, spaced about 0.5 percent apart, starting at y 65.6 percent, each with a left-to-right gradient from deep blue #0058A8 to green #00B050: TECHNOLOGY AND ENGINEERING, GLOBAL OPERATIONS AND SUSTAINABILITY, GLOBAL PROJECTS, GLOBAL SERVICES & CORPORATE FUNCTIONS. Labels are white capitals centred in each shape. No arrows or connectors. Nothing is photographic. Separately, a thin grey dotted vertical line divides the columns.
Slide 15
PRODUCT SOLUTIONS GROWS ADVANTAGES
Enables value chain synergies and resource prioritization for better solutions in evolving markets
NEW PRODUCT SOLUTIONS BUSINESS
ENERGY PRODUCTS
CHEMICAL PRODUCTS
SPECIALTY PRODUCTS
Fuels
Aromatics
Catalysts and licensing
Olefins
Polyethylene
Polypropylene
Intermediates
Finished lubricants
Basestocks and waxes
Synthetics
Elastomers and resins
Driving improved prioritization and resource allocation
Enhancing focus on high-value product growth
Supporting further optimization of integrated sites
Improving response to changing business environment
Delivering faster, more nimble asset optimization for highest value
Reducing overhead with single leadership structure
15
Visuals: Three filled rectangles form the column headers, each about 14.3% wide and 8.5% tall at y 30.6%: a dark blue #0C479D rectangle at x 3.6% (ENERGY PRODUCTS), a bright cyan #00B0F0 rectangle at x 18.4% (CHEMICAL PRODUCTS), and a green #00B050 rectangle at x 33.2% (SPECIALTY PRODUCTS), each with white bold capitals centred in it. Behind the columns is a flat light grey #F2F2F2 rectangle at x 3.1%, y 21.8%, 45% by 68.2%, with square corners and no shadow or border. A vertical dotted grey line at x about 50.1% runs from y 21.8% to about 90%, separating the panel from the bullets. There are no photographs, charts, logos or icons.
Slide 16
KEY TAKEAWAYS
•
Strong underlying business performance
–
Weather and timing impacts expected to resolve in second quarter
–
Further structural cost reductions
•
Positioned to benefit from stronger refining margins
•
Delivering high-value growth opportunities
–
Guyana developments ahead of plan
–
Corpus Christi Chemical Complex earnings and cash flow positive in first quarter of operations
•
Strong balance sheet supports consistent investments and shareholder returns throughout the cycles
–
Increasing share repurchases up to a total of $30 billion through 2023 1
•
Significant progress in advancing lower-emission business opportunities, including plans for a world-scale blue hydrogen plant
•
New organizations in place to capture benefits of technology, scale, and integration
–
Product Solutions - largest fully integrated global Chemical and Fuels business
–
Centralization of Technology and Engineering and Global Operations and Sustainability
See Supplemental Information for footnotes and definitions.
16
Slide 17
Q&A / BAYTOWN ADVANCED RECYCLING
Visuals: Full-bleed photograph of a male industrial worker standing on a yellow safety-railed platform beside a tall silver cylindrical storage tank with a caged ladder and a small railed landing. He wears a white hard hat with a red logo, clear safety glasses, a navy long-sleeved work shirt with a red logo on the chest, a black shoulder radio microphone, a black belt and jeans, and holds a black rugged tablet computer in both hands while looking up and to the right with a slight smile. Composition is low-angle, shot upward, with the worker in the right-centre third and the tank filling the left half. Lighting is bright natural daylight with a blue sky and soft white clouds. Dominant colours are silver-grey, sky blue, safety yellow, and navy. The photo is not cropped apart from the frame edges, and it is not boxed; there is no overlay or tint.
Slide 18
OUTLOOK FOR SECOND-QUARTER 2022
DOWNSTREAM SCHEDULED MAINTENANCE QUARTERLY EARNINGS IMPACT1
Million USD
600
300
0
2021 quarterly average
1Q22
2Q22 est.
UPSTREAM SCHEDULED MAINTENANCE QUARTERLY EARNINGS IMPACT3
Million USD
900
600
300
0
2021 quarterly average
1Q22
2Q22 est.
CHEMICAL SCHEDULED MAINTENANCE QUARTERLY EARNINGS IMPACT2
Million USD
200
100
0
2021 quarterly average
1Q22
2Q22 est.
• Upstream maintenance expected to be $670 to $870 million driven by increased turnaround activity
• Downstream maintenance expected to be $450 to $650 million driven by increased turnaround activity
• Chemical maintenance expected to be $40 to $80 million; slightly higher than 1Q22
See Supplemental Information for footnotes.
18
Visuals: Three vertical bar charts with error-bar markers, all in blue #0C479D on white. (1) Chart at top left, titled DOWNSTREAM SCHEDULED MAINTENANCE QUARTERLY EARNINGS IMPACT with superscript 1 and subtitle Million USD. Y-axis 0 to about 600, labelled 0, 300, 600, no axis line; X categories: 2021 quarterly average, 1Q22, 2Q22 est. Bars: 2021 quarterly average about 305; 1Q22 about 440; 2Q22 est. has no bar but a black error-bar range from about 450 to about 650 (values about, not printed). Baseline black horizontal line from about x 6.5% to 42.5%. (2) Chart at top right, titled UPSTREAM SCHEDULED MAINTENANCE QUARTERLY EARNINGS IMPACT with superscript 3 and subtitle Million USD. Y-axis 0 to 900 with labels 0, 300, 600, 900 and a thin light grey vertical axis line; X categories as above. Bars: 2021 quarterly average about 290; 1Q22 about 420; 2Q22 est. shows only an error bar from about 670 to about 870 (about, not printed). Baseline black from about x 55% to 91.7%. (3) Chart at bottom left, titled CHEMICAL SCHEDULED MAINTENANCE QUARTERLY EARNINGS IMPACT with superscript 2 and subtitle Million USD. Y-axis 0 to 200 with labels 0, 100, 200; X categories as above. Bars: 2021 quarterly average about 95; 1Q22 about 50; 2Q22 est. error bar from about 40 to about 80 (about, not printed). Baseline black from about x 6.5% to 42.5%. No legend, no highlighted points, no gridlines. Error bars are black vertical lines with horizontal end caps.
Slide 19
SUPPLEMENTAL INFORMATION
All references to production rates, project capacity, resource size, and acreage are on a gross basis, unless otherwise noted.
DEFINITIONS AND NON-GAAP FINANCIAL MEASURE RECONCILIATIONS
Debt-to-capital ratio (leverage). Total debt / (total debt + total equity).
Net debt-to-capital ratio. Net debt / (net debt + total equity).
Performance product (performance chemicals). Refers to Chemical products that provide differentiated performance for multiple applications through enhanced properties / versus commodity alternatives and bring significant additional value to customers and end-users.
Product Solutions. New organization effective April 1st, 2022. Product Solutions data before April 1st, 2022 is combination of historical Downstream and Chemical data.
Project. The term “project” as used in this presentation can refer to a variety of different activities and does not necessarily have the same meaning as in any government / payment transparency reports.
Resources, resource base, and recoverable resources. Along with similar terms, refer to the total remaining estimated quantities of oil and natural gas that are expected to be / ultimately recoverable. The resource base includes quantities of oil and natural gas classified as proved reserves, as well as quantities that are not yet classified as proved / reserves, but that are expected to be ultimately recoverable. The term “resource base” or similar terms are not intended to correspond to SEC definitions such as “probable” or / “possible” reserves. The term “in-place” refers to those quantities of oil and natural gas estimated to be contained in known accumulations and includes recoverable and / unrecoverable amounts.
19
Slide 20
SUPPLEMENTAL INFORMATION / DEFINITIONS AND NON-GAAP FINANCIAL MEASURE RECONCILIATIONS, CONTINUED / Structural savings (also structural cost reductions, structural efficiencies). Structural savings describe decreases in the below expenses as a result of operational efficiencies, workforce reductions and other cost saving measures that are expected to be sustainable compared to 2019 levels. Relative to 2019, estimated cumulative annual structural savings totaled $5.4 billion, of which $0.5 billion was achieved in 1Q22. The total change between periods in expenses below will reflect both structural savings and other changes in spend, including market factors, such as energy costs, inflation, and foreign exchange impacts, as well as changes in activity levels and costs associated with new operations. Structural savings are stewarded internally to support management's oversight of spending over time. This measure is useful for investors to understand the Corporation's efforts to optimize spending through disciplined expense management. Forward-looking estimates of structural savings are based on Company plan, and may include management adjustments. / Consolidated Statement of Income line items targeted for structural savings 1Q22 1Q21 2021 2020 2019 / (millions of dollars) / Production and manufacturing expenses 10,241 8,062 36,035 30,431 36,826 / Selling, general and administrative expenses 2,409 2,428 9,574 10,168 11,398 / Exploration expenses, including dry holes 173 164 1,054 1,285 1,269 / Total 12,823 10,654 46,663 41,884 49,493 / 20
Visuals: One table, no photographs, charts, logos or icons. Table title row: Consolidated Statement of Income line items targeted for structural savings, with column headers 1Q22, 1Q21, 2021, 2020, 2019 in semibold. Italic subheader (millions of dollars) above the value columns. Rows: Production and manufacturing expenses 10,241 / 8,062 / 36,035 / 30,431 / 36,826; Selling, general and administrative expenses 2,409 / 2,428 / 9,574 / 10,168 / 11,398; Exploration expenses, including dry holes 173 / 164 / 1,054 / 1,285 / 1,269; Total 12,823 / 10,654 / 46,663 / 41,884 / 49,493. Dark rule under the header row, thin rule above the Total row spanning the value columns, dark rule under the Total row. No highlighted cells.
Slide 21
SUPPLEMENTAL INFORMATION
FREE CASH FLOW1 / 1Q22
Net cash provided by operating activities (U.S. GAAP) / 14,788
Additions to property, plant and equipment / (3,911)
Proceeds associated with sales of subsidiaries, property, plant and equipment, and sales and returns of investments / 293
Additional investments and advances / (417)
Other investing activities including collection of advances / 90
Free cash flow / 10,843
Free cash flow is cash flow from operations and asset sales less additions to property, plant and equipment, and additional investments and advances, plus other investing activities, including collection of advances. This measure is useful when evaluating cash available for financing activities, including shareholder distributions, after investment in the business. For information concerning the calculation and reconciliation of free cash flow for historical periods see the Frequently Used Terms available on the Investors page of our website at www.exxonmobil.com under the heading News & Resources.
1 Billion USD.
21
Visuals: One table, no chart, photograph or logo. Columns: a label column (about 80% of table width) and a value column headed 1Q22 (about 13.5% of width, right-aligned values centred under the header). Rows: header row 'FREE CASH FLOW1 | 1Q22'; 'Net cash provided by operating activities (U.S. GAAP) | 14,788'; 'Additions to property, plant and equipment | (3,911)'; 'Proceeds associated with sales of subsidiaries, property, plant and equipment, and sales and returns of investments | 293'; 'Additional investments and advances | (417)'; 'Other investing activities including collection of advances | 90'; 'Free cash flow | 10,843' (bold total row). A thin black rule sits above the 90 value cell in the value column only, and a thin black rule closes the table under the total row across the full width. Units: Billion USD per footnote 1.
Slide 22
SUPPLEMENTAL INFORMATION
“Weather / day effect”, “Price entitlement”, “Scheduled maintenance”, and “Other volume” as used on slide 7, are included below as part of the
“Volume / Mix” category.
UPSTREAM EARNINGS FACTOR ANALYSIS1
1Q22 vs. 4Q21
Prior Period
6,085
Realization
2,160
Volume / Mix
(950)
Other
(2,810)
Current Period
4,488
As used on slide 8; “Weather” and “Scheduled maintenance” are included below as part of the “Downtime / Maintenance ” category; “Price
entitlement” is included below as part of the “Entitlement / Divestment ” category.
UPSTREAM VOLUME ANALYSIS2
1Q22 vs. 4Q21
Prior Period
3,816
Downtime / Maintenance
(121)
Growth / Decline
17
Entitlements / Divestments
(85)
Government Mandates
32
Demand / Other
16
Current Period
3,675
1 Million USD.
2 Koebd.
22
Visuals: Two financial tables, no charts, photographs, logos or icons. Table 1: title “UPSTREAM EARNINGS FACTOR ANALYSIS” with superscript 1 and a column header “1Q22 vs. 4Q21”. Rows: Prior Period 6,085 (bold); Realization 2,160; Volume / Mix (950); Other (2,810); Current Period 4,488 (bold). Units are Million USD (footnote 1). A thin black rule sits above the Current Period value; a heavier black rule closes the table at the bottom. Table 2: title “UPSTREAM VOLUME ANALYSIS” with superscript 2 and column header “1Q22 vs. 4Q21”. Rows: Prior Period 3,816 (bold); Downtime / Maintenance (121); Growth / Decline 17; Entitlements / Divestments (85); Government Mandates 32; Demand / Other 16; Current Period 3,675 (bold). Units are Koebd (footnote 2). A thin black rule sits above the Current Period value; a heavier black rule closes the table at the bottom.
Slide 23
SUPPLEMENTAL INFORMATION
“Industry fuels margin”, “Industry basestocks margin”, “Unsettled derivatives”, and “Price timing” as used on slide 9, are included below as part of the
“Margin” category.
DOWNSTREAM EARNINGS FACTOR ANALYSIS¹
1Q22 vs. 4Q21
Prior Period
1,463
Margin:
Industry fuels margin
620
Industry basestocks margin
(310)
Unsettled derivatives
(760)
Price timing
(590)
Total margin
(1,040)
Volume
(280)
Expenses
160
Other
30
Current Period
332
¹ Million USD.
23
Visuals: Table: title bar spans the full table width. Columns: (1) row label, wide, spanning about 3% to 83%, (2) value column '1Q22 vs. 4Q21', about 83% to 97%, centre-aligned. Header row: 'DOWNSTREAM EARNINGS FACTOR ANALYSIS¹' in white on a blue bar, value header '1Q22 vs. 4Q21' in white on the same blue. Rows in order: Prior Period | 1,463 (bold); Margin: | (blank); Industry fuels margin (indented) | 620; Industry basestocks margin (indented) | (310); Unsettled derivatives (indented) | (760); Price timing (indented) | (590); Total margin (further indented) | (1,040); Volume (indented one level) | (280); Expenses (indented one level) | 160; Other (indented one level) | 30; Current Period (bold) | 332 (bold). Thin black rule above the Total margin value (about 54.8%), thin black rule above the Current Period value (about 69.9%), and a heavier black rule under Current Period across the full width (about 73.6%). No chart, photo or logo.
Slide 24
SUPPLEMENTAL INFORMATION
Slide 3
1. 560 Koebd refers to March 2022 average net Permian production.
Slide 16
1. To be executed over 2022—2023.
Slide 4
1. 10-year range includes 2010-2019.
Slide 18
1. Estimates based on March margins and operating expenses related to
turnaround activities.
2. Source: S&P Global Platts.
2. Based on operating expenses related to turnaround activities.
3. Source: ICE. Equal weighting of Henry Hub and NBP.
3. Estimate based on April prices
4. Source: S&P Global Platts and ExxonMobil analysis. Net margin calculated by
equal weighting of U.S. Gulf Coast (Maya – Coking), Northwest Europe (Brent –
Catalytic Cracking), and Singapore (Dubai – Catalytic Cracking) netted for
industry average Opex, energy and renewable identification numbers (RINS).
5. Source: IHS Markit, Platts, and company estimates. Weighting of polyethylene,
polypropylene, and paraxylene based on ExxonMobil capacity.
Slide 6
1. Forex is now included in the Other factor.
Slide 8
1. 560 Koebd refers to March 2022 average net Permian production.
Slide 11
1. Includes PP&E Adds of ($3.9) billion and net investments / advances of ($0.3) billion in 1Q22.
2. To be executed over 2022—2023.
24
Download this deck
The hosted PDF of every library deck is free for readers of the SlideDeck Co newsletter. Join with your email and the viewer and download appear here.
Preparing a results presentation or business update of your own? The SlideDeck Co Standard Deck is a slide library for business reviews, updates and plans.







