
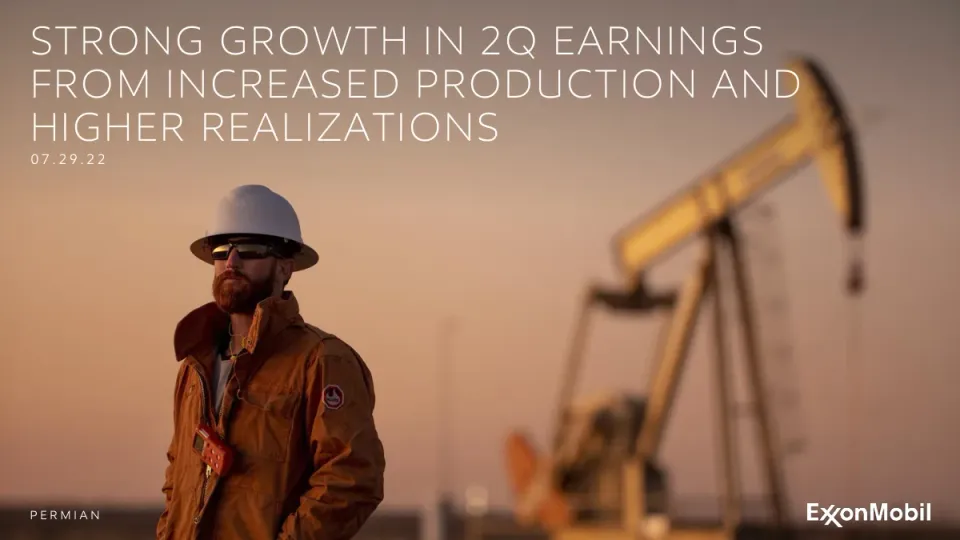
The deck opens with a title slide reading "Strong growth in 2Q earnings from increased production and higher realizations", followed by a long forward-looking statements caution page. It then presents a summary of performance themes under five headings (leading performance, essential partner, advantaged portfolio, innovative solutions, meaningful development). The middle sections cover market conditions: prices and margins, industry upstream investment lagging demand, ExxonMobil's investment versus peers, U.S. tight oil growth, refinery closures and U.S. refining capacity additions, and carbon capture opportunities. The core financial section covers 2Q22 earnings, a segment-by-segment walk from 1Q22 to 2Q22 for Upstream, Energy Products, Chemical Products and Specialty Products, cash flow and shareholder distributions, and the third-quarter outlook with scheduled maintenance charts. A key takeaways slide and Q&A divider close the main talk, followed by supplemental pages with definitions, non-GAAP reconciliations and footnotes. Slides worth seeing include the market summary chart, the refinery capacity bar chart, and the earnings bridge tables, which use a consistent layout and clear headline titles.
Slides worth studying
- Slide 5: A simple area chart with a dashed projection and a required-investment band makes the supply gap readable at a glance.
- Slide 13: The earnings bridge table lays out each segment and driver in columns so the reader can trace the change from 1Q22 to 2Q22.
- Slide 9: Stacked bars separate ExxonMobil projects in red from industry projects in grey, so the company's share is visible immediately.
Details
- Company: ExxonMobil
- Year: 2022
- Type: Investor presentation
- Industry: Oil and gas
- Pages: 29
The hosted copy of this deck is being prepared. Newsletter readers will find the download here.
Review score: 7 out of 10, Effective
Presentation quality, judged with the SlideDeck Co review heuristic. Ask, evidence and idea merit are not rated here.
The strength is the results block from slide 11 to slide 20: slide 13 reconciles 1Q22 GAAP earnings of $5.5 to 2Q22 GAAP earnings of $17.9 by segment and factor, the waterfalls on slides 14 and 16 carry takeaway titles and refer back to page 13, slide 16 isolates unsettled derivatives (810) and price / timing (450) as their own steps, and slide 20 is a separate third-quarter outlook backed by range estimates on slide 23. The bottleneck is that the first ten slides are an industry and investment argument, so the reported numbers do not arrive until slide 11, and some of those argument charts are weak as exhibits. Slide 6 starts its bar axis near 60 with four unnamed 'IOCs' bars, which enlarges the visual lead, and slide 4 plots prices against a 10-year range with no values on the axis. The cash waterfall on slide 19 draws inflows such as asset sales of 0.9 and outflows such as shareholder distributions of 7.6 in the same grey with no signs.
Worth keeping: Keep the slide 13 reconciliation table and the page references from each segment waterfall back to it.
Most useful repair: Move slide 11 to follow slide 3 so results lead, and redraw slide 6 from a zero baseline with the peer companies named.
What would change the score: If the audience is assumed to follow the spoken call in order, with the cover title already stating the result, the late arrival of the numbers matters less and the score would be 8.
Confidence medium. 29 of 29 pages inspected on contact sheets, 12 at readable size. Reviewed 2026-11-15. Model-assisted review (claude-fable-5-2, in session).
Full text of the slides (29 slides)
Every slide's words and a description of its charts and images, so the deck can be searched and rebuilt. Also available as Markdown.
Slide 1
STRONG GROWTH IN 2Q EARNINGS / FROM INCREASED PRODUCTION AND / HIGHER REALIZATIONS
07.29.22
PERMIAN
ExxonMobil
Visuals: Photograph, full-bleed: a man in a white hard hat and tinted safety glasses, with a rust-orange canvas work jacket, a red handheld gas detector on his chest and a red hexagonal patch on his left sleeve, stands at the centre-left facing right with a full auburn beard. Behind him to the right, out of focus, stands a large gold-painted pumpjack (beam pumping unit) with its horsehead and walking beam angled up and a second pumpjack further back. Lighting is low golden-hour sun from the side, giving warm highlights and a soft peach sky. Composition: the man occupies roughly the lower-left half from about 17 to 60 percent of width, cropped at the bottom edge; the pumpjack fills the right third. Dominant colours are peach-tan sky, burnt orange and amber. A slight darkening overlay sits at the top to support the white title. Logo: ExxonMobil wordmark in white at bottom right.
Slide 2
CAUTIONARY STATEMENT
FORWARD-LOOKING STATEMENTS. Statements of future events, conditions, or expectations in this presentation or the subsequent discussion period are forward-looking
statements. Similarly, discussions of future carbon capture, biofuels, and hydrogen plans to drive toward net zero are dependent on future market factors, such as continued
technological progress and policy support, and represent forward-looking statements. Actual future results, including financial and operating performance; earnings, cash flow,
and rates of return; total capital expenditures and mix, including allocations of capital to low carbon solutions; cost reductions and efficiency gains, including the ability to offset
inflationary pressures; plans to reduce future emissions and emissions intensity; technology efforts, including timing and outcome of projects to capture and store CO2 ,
produce biofuels and use plastic waste as recycled feedstock; timing and outcome of hydrogen projects; achievement of ambitions to reach Scope 1 and Scope 2 net zero from
operated assets by 2050, or Scope 1 and Scope 2 net zero in Upstream Permian operated assets by 2030, the elimination of routine flaring in-line with World Bank Zero routine
flaring, or the completion of major asset emission-reduction roadmaps; maintenance and turnaround activity; price and margin recovery; shareholder distributions; the ability to
access debt markets; resource recoveries and production rates; and product sales levels and mix could differ materially due to a number of factors including global or regional
changes in oil, gas, petrochemicals, or feedstock prices, differentials, or other market or economic conditions affecting the oil, gas, and petrochemical industries and the
demand for our products; the impact of trading activities; policy and consumer support for emission-reduction products and technology; the outcome of competitive bidding
and project wins; regulatory actions targeting public companies in the oil and gas industry; changes in local, national, or international laws, regulations, and policies affecting
our business including with respect to the environment; the development and transportation of our products; taxes, trade sanctions, and actions taken in response to pandemic
concerns; the pace of regional and global economic recovery from the pandemic and the occurrence and severity of future outbreaks; the ability to realize efficiencies within
and across our business lines and to maintain cost reductions without impairing our competitive positioning; the outcome and timing of exploration and development projects;
and decisions to invest in future reserves, reservoir performance, including variability in unconventional projects; timely completion of construction projects; war and other
security disturbances; actions of consumers and changes in consumer preferences; opportunities for and regulatory approval of investments or divestments that may arise; the
outcome of our or competitors’ research efforts and the ability to bring new technology to commercial scale on a cost-competitive basis; the development and competitiveness
of alternative energy and emission reduction technologies; unforeseen technical or operating difficulties including the need for unplanned maintenance; and other factors
discussed here and in Item 1A. Risk Factors of our Annual Report on Form 10-K and under the heading “Factors Affecting Future Results” available through the Investors page
of our website at exxonmobil.com. All forward-looking statements are based on management’s knowledge and reasonable expectations at the time of this presentation and
we assume no duty to update these statements as of any future date. Neither future distribution of this material nor the continued availability of this material in archive form on
our website should be deemed to constitute an update or re-affirmation of these figures as of any future date. Any future update of these figures will be provided only through
a public disclosure indicating that fact.
Reconciliations and definitions of non-GAAP and other terms are provided in the text or in the supplemental information accompanying these slides beginning on page 24.
2
Slide 3
CREATING SUSTAINABLE SOLUTIONS AND GROWING / SHAREHOLDER VALUE / Leading Performance | Essential Partner | Advantaged Portfolio | Innovative Solutions | Meaningful Development / • / Leading performance / – / Generated strong earnings and cash from increased production, higher realizations, and aggressive cost control / – / Grew year-to-date Permian production by ~130 Koebd versus 1H21; expect to achieve 25% increase versus 2021 / – / Total capacity increased in Guyana to >340 Koebd; continued to ramp up Liza Phase 2 / – / Continued strong utilization performance across refining and chemical operations / – / Global refining throughput increased by 180 Kbd in 1H22 versus 1H21 to meet recovering demand / • / Essential partner / – / Awarded interest in Qatar’s North Field East joint venture to expand Qatar’s annual LNG capacity by >30 MTA by 2026 / – / Exploring large-scale CCS opportunities in China, the Netherlands, Australia, and Indonesia / • / Advantaged portfolio / – / On pace to increase our U.S. Gulf Coast refining capacity by ~17% or 250 Kbd in 1Q23 through the Beaumont refinery expansion / – / Announced two new discoveries in Guyana / – / On track to achieve first LNG cargo from Mozambique’s Coral South FLNG in 2H22 / – / Announced >$3 billion of asset sales¹, including XTO Energy Canada, Romania upstream affiliate, and U.S. Barnett Shale / See Supplemental Information for definitions and footnotes. / 3
Visuals: Two decorative elements and no charts, photographs, logos or icons. First, a faint pixelated light-grey gradient texture fills the upper-left and middle band of the slide (about 6.7% to 47% of the height, full width), fading to white toward the edges and right side, sitting behind the bullet text. Second, a horizontal navigation banner (a filled rectangle with the blue gradient, dark blue on the left shifting to bright cyan on the right) spanning about 3.1% to 96.9% of the width and 17.2% to 26.6% of the height, with five white labels separated by vertical bars.
Slide 4
TIGHT GLOBAL MARKETS DROVE HIGHER PRICES AND IMPROVED MARGINS / PRICES / MARGINS / 10-year annual range¹ / • Continued tight crude supply with recovering demand / • Tight global market conditions and ongoing European supply concerns sustained elevated natural gas prices / • Strengthening global demand, low inventories, and ongoing supply disruptions drove refining margins well above ten-year range / • Slight improvement in global chemical margins; Asia Pacific margins remain bottom-of-cycle / Crude² ($/bbl) / Natural gas³ ($/mbtu) / Refining margins⁴ ($/bbl) / Chemical margins⁵ ($/tonne) / 2Q21 1Q22 2Q22 10-year range / See Supplemental Information for footnotes. / 4
Visuals: Chart: range-and-marker dot plot titled PRICES / MARGINS with subtitle 10-year annual range¹. Type: four light-blue 10-year range bars with three diamond markers per category for 2Q21 (black), 1Q22 (blue) and 2Q22 (red). Vertical axis is unlabelled with no numeric scale or printed values, and has a break mark near its upper part (about 36–38% from top); values are not printed, so positions are only relative. Categories left to right: Crude² ($/bbl), Natural gas³ ($/mbtu), Refining margins⁴ ($/bbl), Chemical margins⁵ ($/tonne). Crude: red 2Q22 marker just above the top of its bar, blue 1Q22 marker inside the upper part, black 2Q21 marker in the lower part of the bar. Natural gas: blue and red markers just above the top of the bar, close together, black marker in the lower half. Refining margins: red marker far above the bar top (highest point on the chart), blue marker inside the bar, black marker below the baseline. Chemical margins: black marker above the bar top, red marker at the lower part of the bar, blue marker just below the baseline. Thin light-grey horizontal baseline at zero spans the chart. Legend below the chart: black diamond 2Q21, blue diamond 1Q22, red diamond 2Q22, light-blue square 10-year range, in one row, as a raster image. No photographs or logos.
Slide 5
INDUSTRY INVESTMENT NOT KEEPING UP WITH
RECOVERING DEMAND
UPSTREAM OIL INVESTMENT¹
Billion USD
400
200
0
2017
2018
2019
2020
2021
2022
2023
Required
investment²
Expected
investment
•
Effects of the pandemic exacerbated stagnant industry
investment
•
Investments lagging estimated third-party requirements as
the oil market recovers
−
Additional investment needed to offset depletion and to meet
recovering demand
•
Finding, developing, and producing new oil supplies takes
years
See Supplemental Information for footnotes.
5
Visuals: Chart: area chart with a line overlay, titled 'UPSTREAM OIL INVESTMENT¹' with unit 'Billion USD'. Y axis labelled 0, 200 and 400 (Billion USD), range 0 to 400, no gridlines. X axis labelled 2017 through 2023, one category per year, no axis title. Series 1, 'Expected investment' (solid area, #7E9CC7 light steel blue, fills from 0 to the expected value): about 305 (2017), about 311 (2018), about 314 (2019), about 215 (2020), about 239 (2021); the area ends at 2021 and continues as a dashed line of the same blue (about 2 px dash, #7E9CC7) rising to about 264 at 2022. Series 2, 'Required investment²' (green area #92D050 filled between the expected line and the required line): required upper edge about 215 (2020), about 270 (2021), about 364 (2022), about 377 (2023); lower edge about 215 (2020), about 239 (2021), about 280 (2022), about 278 (2023). No data labels printed, so all values above are estimates. No legend box; the two series are identified by direct labels, 'Required investment²' in green at upper right of the area and 'Expected investment' in blue beside the dashed line. No highlighted points. The 2022 and 2023 expected-investment area is absent, leaving white space under the green band. A white rectangle masks the lower-right portion of the blue area near 2021 to 2022 so the dashed line sits cleanly above the baseline. Baseline is a thin black horizontal axis line at 0.
Slide 6
EXXONMOBIL LEADS ALL PEERS IN OIL AND GAS / INVESTMENT
INVESTMENT IN EXPLORATION AND DEVELOPMENT1
2017-2021, Billions USD
80
60
ExxonMobil
IOCs
• ExxonMobil invested more than twice its Upstream earnings / to develop oil and gas resources
– $90 billion invested versus $38 billion earned between 2017 / and 2021
• In 2020, we invested ~$13 billion, despite losing $20 billion / in our Upstream business
• Continued investment through the pandemic enabled us to / ramp up supply when demand returned in 2021
See Supplemental Information for definitions and footnotes.
6
Visuals: Vertical bar chart, untitled beyond its heading 'INVESTMENT IN EXPLORATION AND DEVELOPMENT' with superscript 1 and subtitle '2017-2021, Billions USD'. Y-axis: Billions USD, labelled ticks 60 and 80 only, no printed range; baseline at about 50 and top of plot about 92. Five vertical bars with flat tops and a horizontal black baseline spanning about x 6 to 48 percent. Bar 1 (ExxonMobil, highlighted) is red #C00000, about 90 (about 90, matching the bullet '$90 billion invested'). Bars 2 to 5 are grey #B5B5B5 with no printed values: bar 2 about 80, bar 3 about 80, bar 4 about 74, bar 5 about 66. Category labels under the axis: 'ExxonMobil' under bar 1 and 'IOCs' centred under bars 2 to 5. No legend. Highlighted point: bar 1 only, in red.
Slide 7
EXXONMOBIL'S SUSTAINED INVESTMENTS DROVE / LEADING U.S. TIGHT OIL GROWTH / U.S. TIGHT OIL PRODUCTION GROWTH¹ / Indexed to 2017, percent / 300% / > 20% CAGR / 200% / > 10% CAGR / 100% / 2017 / 2018 / 2019 / 2020 / 2021 / 2022 / ExxonMobil / Industry / • / ExxonMobil’s 2022 production of U.S. tight oil expected to / nearly triple versus 2017 / − / Industry production up ~70% since 2017¹ / • / U.S. tight oil industry production volumes expected to be at all- / time high of ~8.5 Mbd in 2022¹ / • / Our Permian development approach leverages unique set of / competitive advantages to drive efficient growth / − / Early investment in surface infrastructure established foundation for / long-term efficiency / − / Multi-well pad corridor approach / − / Significant operating cost reductions driven by efficiency and / performance gains / − / Advancing Permian 2030 net-zero emissions plans² / • / Approach enabled 25% growth in Permian Basin in 2021; / expect to achieve another 25% increase in 2022 / See Supplemental Information for footnotes. / 7
Visuals: One line chart, titled 'U.S. TIGHT OIL PRODUCTION GROWTH¹', subtitled 'Indexed to 2017, percent'. Y-axis: linear, percent, labelled 100%, 200% and 300% (range 100% to about 300%, baseline at 100%, no unit label beyond the % sign). X-axis: calendar years 2017 to 2022, labelled at each year. Series 1, ExxonMobil, red line (about #E00000), values about 100% in 2017, about 130% in 2018, about 180% in 2019, about 205% in 2020, about 230% in 2021 and about 280% in 2022 (values not printed; estimates). Series 2, Industry, grey line (about #808080), values about 100% in 2017, about 133% in 2018, about 158% in 2019, about 155% in 2020, about 155% in 2021 and about 170% in 2022 (values not printed; estimates). Annotations: '> 20% CAGR' in bold black above the end of the red line; '> 10% CAGR' in bold black above the end of the grey line. Legend below the x-axis: red line swatch labelled ExxonMobil, grey line swatch labelled Industry. No points are highlighted by markers; the lines are plain strokes of about 2 px width, and the horizontal x-axis baseline is a thin black line at 100%. Non-text elements: the chart lines, the axis line, the legend swatches and the dotted vertical divider line (about #8C8C8C dotted, very thin).
Slide 8
REDUCED INDUSTRY SUPPLY DRIVEN BY REFINERY
CLOSURES
GLOBAL NET REFINING CAPACITY CHANGE1
Mbd versus 2017
1.5
0.5
-0.5
-1.5
2017
2018
2019
2020
2021
2022
GLOBAL CUMULATIVE REFINERY CLOSURES2
Mbd
0
-2
-4
2020
2021
2022
US
Europe
Asia Pacific
Other
Pandemic had severe impact on industry refining capacity
– Demand destruction in 2020 – 2021 drove industry margins well below 10-year range
>3 Mbd of cumulative refining capacity has been shut down since 20202
– Refinery closure rate during the pandemic was three times the rate following the 2008 financial crisis
Anticipated gross capacity additions of ~1 Mbd annually through 2023 will help meet recovering demand3
See Supplemental Information for footnotes.
8
Visuals: Two charts in the left column, both with white backgrounds and no gridlines. Chart 1: line chart titled 'GLOBAL NET REFINING CAPACITY CHANGE' with superscript 1, subtitle 'Mbd versus 2017'. Y axis in Mbd versus 2017, labelled 1.5, 0.5, -0.5, -1.5 (range about -1.5 to 1.5, no unit label beyond Mbd). X axis labelled 2017, 2018, 2019, 2020, 2021, 2022 (time, annual ticks). One black series line of about 2.25 pt width, with a thin black horizontal zero line at 0. No values printed; estimated values: about 0.0 at start of 2017, dip to about -0.1 early 2017, about 0.4 mid 2017, about 0.6 late 2017, about 0.8 early 2018, about 1.0 mid 2018, about 1.1 late 2018, about 1.3 mid 2019, about 1.4 late 2019 peak, about 0.9 early 2020, about 1.0 mid 2020, about 0.7 late 2020, about 0.3 end 2020, about -0.2 early 2021, about -0.2 mid 2021, about 0.4 mid 2021 peak, about -0.4 late 2021, about -0.3 end 2021, about -0.6 early 2022, about -0.7 end of series. No highlighted points. Chart 2: stacked area chart titled 'GLOBAL CUMULATIVE REFINERY CLOSURES' with superscript 2, subtitle 'Mbd'. Y axis labelled 0, -2, -4 Mbd (range 0 to -4, negative downward). X axis labelled 2020, 2021, 2022 (time). Four stacked series from top to bottom: US in dark navy #17375E, Europe in medium blue #558ED5, Asia Pacific in light-medium blue #8EB4E3, Other in pale blue #C6D9F1. Estimated boundaries (about): by end of series US about -1.0, Europe about -1.7, Asia Pacific about -2.7, Other about -3.2 (cumulative). Around 2021 the US band reaches about -0.6, Europe about -1.0, Asia Pacific about -1.3, Other about -1.6. No labelled values printed. Legend in one row beneath the chart: navy square US, blue square Europe, light blue square Asia Pacific, pale square Other. No highlighted points. Bullets: three dash-led sub-points are included in the right column as text, not as visuals. No photographs, logos or icons.
Slide 9
EXXONMOBIL U.S. REFINING CAPACITY RISING TO MEET
DEMAND
U.S. REFINERY CAPACITY ADDITIONS BY PROJECT1
Kbd
500
250
1Q 2023
ExxonMobil
Beaumont
refinery
expansion
+250 Kbd
2017
2018
2019
2020
2021
ExxonMobil projects
Industry projects
ExxonMobil investments in U.S. Energy Products exceeded
$8 billion since 2017
Continued investing through the downturn to increase U.S.
refining capacity
Beaumont refinery expansion represents the industry’s
largest single capacity addition in the U.S. since 2012
Expands advantaged Permian crude processing
Provides additional clean fuels to meet market demand
See Supplemental Information for definitions and footnotes.
9
Visuals: One chart: stacked column chart titled U.S. REFINERY CAPACITY ADDITIONS BY PROJECT with superscript 1, unit Kbd (thousand barrels per day). Y-axis labelled 500 and 250 only, with no printed zero label; the baseline sits at about 0 Kbd. Columns from left to right are 2017, 2018, 2019, 2020, 2021, with no printed data values. Estimated totals (about, read from gridlines): 2017 about 390 Kbd, 2018 about 190 Kbd, 2019 about 160 Kbd, 2020 about 40 Kbd, 2021 about 125 Kbd. Each column is stacked from light grey Industry projects segments (fill #D9D9D9, outline grey #7F7F7F, segment dividers as thin grey lines, darker grey top cap) with red ExxonMobil projects segments (#C00000). ExxonMobil segments are visible in 2017 as a thin band near the top (about 5 Kbd), 2018 as a thin band near the top (about 5 Kbd), 2019 as a band at about 60 to 75 Kbd, and 2020 as a thin band (about 5 Kbd). 2021 has no visible red segment. A separate single red column labelled 1Q 2023 ExxonMobil Beaumont refinery expansion +250 Kbd stands at about 250 Kbd, with no axis-value label on it. Legend below the chart: red square labelled ExxonMobil projects, grey square with outline labelled Industry projects. No highlighted points other than the red segments. The chart has no gridlines. Two white rectangles mask the area beneath the 2021 column and the right side of the chart; they hide the 2022 and 2023 year labels, which exist in the file but are not visible. No photographs, logos or icons.
Slide 10
PROVIDING ENERGY AND REDUCING EMISSIONS
ROBUST CCS PORTFOLIO HIGHLIGHTS SIGNIFICANT OPPORTUNITIES
•
Demonstrated leadership and core capabilities make us
partner of choice for Carbon Capture and Storage (CCS)
•
Advancing initiatives at scale with four new CCS
opportunities:
−
China
−
Dutch North Sea
−
Australia
−
Indonesia
•
Progressing opportunities in biofuels and hydrogen
−
Sustainable aviation fuel supplies
−
Strathcona renewable diesel project
−
Baytown blue hydrogen project
Previously announced
2Q22 announcements
See Supplemental Information for definitions.
10
Visuals: A grey world map (light grey #D9D9D9 land masses, no borders or labels) with circular markers. Dark grey markers (about #3F3F3F, with slight shading) show previously announced CCS sites: two in western North America (one near the upper-left of the US west coast region, one below it), one further south-east in the central-eastern US, a cluster of five in north-west Europe (around the Netherlands, Germany and northern France), one in the Middle East (around the Arabian peninsula), two in Southeast Asia (Malaysia/Sumatra area), and one in northern Australia's west coast. Red markers (#FF0000) show 2Q22 announcements: one in the Netherlands/North Sea area next to the European cluster, one in eastern China, one in Indonesia/Sumatra area, and one in south-east Australia. Legend below the map: dark grey dot labelled 'Previously announced' and red dot labelled '2Q22 announcements'. No values or chart axes.
Slide 11
STRONG GROWTH IN 2Q EARNINGS FROM INCREASED
PRODUCTION AND HIGHER REALIZATIONS
Earnings
$17.6
billion
ex. identified items1
Structural savings
$6.0
billion
versus 2019; on track to exceed $9
billion in annual savings by 20232
Capex
$4.6
billion
consistent with full-year range of
$21—24 billion
Cash flow from operations
$20.0
billion
increased cash balance by $8 billion after
funding capex and shareholder
distributions
Debt-to-capital ratio
20
%
reduced net debt-to-capital to 13%
Shareholder distributions
$7.6
billion
including $3.7 billion in dividends
1 Reconciliation to U.S. GAAP of $17.9 billion on page 13.
2 Includes $0.4 billion of previously unreported 2021 structural savings.
See Supplemental Information for definitions.
11
Visuals: none. The slide contains no charts, photographs, logos or icons; the only non-text marks are six thin dotted grey divider lines (one horizontal spanning x 3.1% to 96.8% at y about 55%, and two vertical from about y 21.6% to 89.6% at x about 34.1% and 66.0%).
Slide 12
UPDATED PRODUCT SOLUTIONS FROM 2 TO 3 SEGMENTS
1Q22 REPORTING SEGMENTS
2Q22 REPORTING SEGMENTS
UPSTREAM
UPSTREAM
DOWNSTREAM
CHEMICAL
ENERGY PRODUCTS
CHEMICAL PRODUCTS
SPECIALTY PRODUCTS
PRODUCT SOLUTIONS
CORPORATE & FINANCING
CORPORATE & FINANCING
•
Product Solutions business is now reported in 3 segments; in June we provided five years of historical information online
•
No change to Upstream or Corporate and Financing reporting segments
•
Results for Low Carbon Solutions continue to be distributed across all reporting segments
12
Visuals: Diagram (segment mapping). Left column, top to bottom: UPSTREAM (blue gradient box, placed image 275 by 62 px, x 5.4 y 18.0 w 28.6 h 11.5); DOWNSTREAM (dark blue #0C479D solid box, x 5.5 y 34.4 w 28.5 h 11.1); CHEMICAL (light blue #00B0F0 solid box, x 5.5 y 51.2 w 28.5 h 11.2); CORPORATE & FINANCING (grey #A6A6A6 box, x 5.5 y 68.4 w 28.5 h 11.2). Right column, top to bottom: UPSTREAM (same blue gradient image, x 65.4 y 18.0 w 28.6 h 11.5); ENERGY PRODUCTS (dark blue #0C479D box, x 65.5 y 31.1 w 28.5 h 11.1); CHEMICAL PRODUCTS (light blue #00B0F0 box, x 65.5 y 43.3 w 28.5 h 11.2); SPECIALTY PRODUCTS (green #00B050 box, x 65.5 y 55.4 w 28.5 h 11.2); CORPORATE & FINANCING (grey #A6A6A6 box, x 65.5 y 68.4 w 28.5 h 11.2). Connectors, black lines about 0.2 percent of height thick: a horizontal line from the Upstream left box right edge (x 34.4) to the Upstream right box left edge (x 65.0) at y 22.7; a horizontal line from Corporate & Financing left box to right box at y 74.7 from x 34.4 to 65.0. A bracket joins Downstream and Chemical to the right: from Downstream right edge at y 40.1 across to x 43.1, from Chemical right edge at y 56.7 across to x 43.1, a vertical joining them at x 43.1 from y 40.1 to y 56.7, a horizontal from x 43.1 to x 53.7 at y 48.7, then a vertical at x 53.7 from y 35.1 to y 61.9, with horizontal branches at y 35.1, 48.7 and 61.9 reaching the left edges of Energy Products, Chemical Products and Specialty Products at x 65.0. No photographs, icons or logos.
Slide 13
RESULTS STRENGTHENED IN 2Q22 VS. 1Q22
U/S / EP / CP / SP / C&F / TOTAL
1Q22 GAAP Earnings / (Loss) / $4.5 / ($0.2) / $1.4 / $0.5 / ($0.7) / $5.5
Russia Sahkalin-1 charges / (3.3) / - / - / - / (0.1) / (3.4)
1Q22 Earnings / (Loss) ex. identified items / $7.7 / ($0.2) / $1.4 / $0.5 / ($0.6) / $8.8
Price / margin / 2.9 / 5.2 / (0.1) / 0.0 / - / 8.1
Unsettled derivatives: mark-to-market / 0.1 / 0.8 / - / - / - / 0.9
Volume / mix / 0.6 / (0.4) / (0.1) / (0.0) / - / 0.1
Expenses / (0.2) / (0.1) / (0.1) / (0.0) / - / (0.4)
Other / (0.1) / (0.0) / (0.1) / (0.1) / 0.3 / 0.1
2Q22 Earnings / (Loss) ex. identified items / $11.1 / $5.3 / $1.1 / $0.4 / ($0.3) / $17.6
Announced U.S. divestment / 0.3 / - / - / - / - / 0.3
2Q22 GAAP Earnings / (Loss) / $11.4 / $5.3 / $1.1 / $0.4 / ($0.3) / $17.9
Earnings increased to ~$18 billion reflecting recovering demand and tight supply of oil, gas, and refined products
More moderate price increases improved unsettled derivatives position
Higher Upstream volumes driven by Guyana and Permian growth and recovery from weather impacts in Canada, partially offset by mix effects in Energy Products
Expenses across all businesses reflecting normal seasonality
Gain on U.S. Barnett Shale gas divestment
Billions of dollars unless specified otherwise.
Due to rounding, numbers presented above may not add up precisely to the totals indicated.
13
Visuals: One table. Columns: row label, U/S, EP, CP, SP, C&F, TOTAL. Header row is a blue band with white semibold column headers. Rows in order: 1Q22 GAAP Earnings / (Loss) (bold, grey band): $4.5, ($0.2), $1.4, $0.5, ($0.7), $5.5. Russia Sahkalin-1 charges (indented): (3.3), -, -, -, (0.1), (3.4). 1Q22 Earnings / (Loss) ex. identified items (bold, grey band): $7.7, ($0.2), $1.4, $0.5, ($0.6), $8.8. Price / margin: 2.9, 5.2, (0.1), 0.0, -, 8.1. Unsettled derivatives: mark-to-market: 0.1, 0.8, -, -, -, 0.9. Volume / mix: 0.6, (0.4), (0.1), (0.0), -, 0.1. Expenses: (0.2), (0.1), (0.1), (0.0), -, (0.4). Other: (0.1), (0.0), (0.1), (0.1), 0.3, 0.1. 2Q22 Earnings / (Loss) ex. identified items (bold, grey band, thin black rule above): $11.1, $5.3, $1.1, $0.4, ($0.3), $17.6. Announced U.S. divestment: 0.3, -, -, -, -, 0.3. 2Q22 GAAP Earnings / (Loss) (bold, grey band, heavy black rule below): $11.4, $5.3, $1.1, $0.4, ($0.3), $17.9. Grey row bands are #D9D9D9. No chart, photograph, logo or icon.
Slide 14
ADVANTAGED ASSETS DRIVING HIGHER UPSTREAM / PRODUCTION
UPSTREAM
CONTRIBUTING FACTORS TO CHANGE IN EARNINGS
Million USD
$ 11,072
770
(240)
(150)
(50)
3,000
$ 7,743
1Q22 ex. / ident. items
Price
Volume / mix
Scheduled / maint.
Expenses
Other
2Q22 ex. / ident. items
See page 13 and Supplemental Information for definitions and reconciliations.
14
• Improved liquid and gas realizations driven by tight supply
• Higher volumes reflected Guyana and Permian growth as well as recovery from weather in Canada
• Higher seasonal scheduled maintenance in Canada and Kazakhstan
Visuals: Waterfall chart titled UPSTREAM / CONTRIBUTING FACTORS TO CHANGE IN EARNINGS, unit line Million USD. Horizontal category axis along a thin black baseline at about y 85%; no value axis, no gridlines and no numeric scale are printed. Seven columns left to right: 1Q22 ex. ident. items total bar, dark blue #0C479D, labelled $ 7,743 above the bar; Price floating green #00A14D bar labelled 3,000 inside it, about 3,000 increase; Volume / mix floating green bar labelled 770 inside it, about 770 increase; Scheduled maint. floating red bar labelled (240) below it, about 240 decrease; Expenses floating red bar labelled (150) below it, about 150 decrease; Other floating thin red bar labelled (50) below it, about 50 decrease; 2Q22 ex. ident. items total bar, dark blue #0C479D, labelled $ 11,072 above the bar. Bars for the unlabelled-scale steps are placed in proportion to their values. No legend. No highlighted points beyond the colour coding of increases (green) and decreases (red). Bars are not cropped and sit on a white background.
Slide 15
SUSTAINED INVESTMENTS DROVE UPSTREAM VOLUME / GROWTH
UPSTREAM
CONTRIBUTING FACTORS TO CHANGE IN VOLUMES
Koebd
3,675
(50)
(30)
(40)
100
80
3,732
1Q22
Price
entitle-
ment
Russia
curtail-
ment
Sched.
maint.
Growth
Weather
/ other
2Q22
• Lower volumes from price-driven entitlements and curtailment in Russia
• Higher seasonal scheduled maintenance in Canada and Kazakhstan
• Advantaged investments delivering growth
− Guyana’s Liza Phase 2 continuing ramp-up to 220 Koebd
− Guyana’s Liza Phase 1 operating ~10% above capacity
− Permian production of ~550 Koebd
• Improved reliability and absence of severe weather
15
See Supplemental Information for reconciliations.
Visuals: Waterfall chart. Title: UPSTREAM / CONTRIBUTING FACTORS TO CHANGE IN VOLUMES, unit line Koebd. Seven columns left to right: 1Q22 total 3,675 (blue); Price entitlement (50) (red decrease); Russia curtailment (30) (red decrease); Sched. maint. (40) (red decrease); Growth 100 (green increase); Weather / other 80 (green increase); 2Q22 total 3,732 (blue). Running level after 1Q22 is 3,675, then 3,625, 3,595, 3,555, 3,655, 3,735, ending at 3,732 for 2Q22 (sum check: 3,675 minus 50, 30, 40 plus 100, 80 gives 3,735, which is 3 Koebd above the printed 3,732; the printed totals are used). Y-axis: no axis line or tick labels are printed; the total bars are drawn with break marks (two short white diagonal slashes cut across each blue bar about 60 percent down the height), so the scale is broken and no numeric range is printed. Estimated bar geometry is about proportional to value only. No legend. Highlighted points: none beyond colour coding (blue totals, red decreases, green increases). Horizontal black baseline under all columns at about y 82 percent spanning the chart width. Category labels sit beneath each column. The Price entitlement and Russia curtailment labels wrap over two and three lines respectively, as do Weather / other.
Slide 16
STRONG REFINING UTILIZATION CAPTURED HIGH MARGINS
ENERGY PRODUCTS
CONTRIBUTING FACTORS TO CHANGE IN EARNINGS
Million USD
$ 5,273
450
810
(400)
$ 4,011
(110)
(20)
4,740
$(196)
1Q22 ex. ident. items
Margin
Volume / mix
Expenses
Other
2Q22 ex. derivatives and price timing
Unsettled derivatives
Price / timing
2Q22 ex. ident. items
•
Tight market drove refining margins higher
•
Higher sales volumes more than offset by mix impacts
•
Seasonally higher expenses
•
More moderate commodity price increases improved unsettled derivatives position
•
Reduced impact from price / timing items
Due to rounding, numbers presented above may not add up precisely to the totals indicated.
See page 13 and Supplemental Information for reconciliations.
16
Visuals: Waterfall chart titled ENERGY PRODUCTS / CONTRIBUTING FACTORS TO CHANGE IN EARNINGS, unit Million USD. No axis numbers or scale are printed; bars are read against a single horizontal baseline at about y 76% (the zero line). Categories left to right with printed values: 1Q22 ex. ident. items $(196) (blue bar, below baseline); Margin 4,740 (green, rising); Volume / mix (400) (red, falling); Expenses (110) (red, falling); Other (20) (red, thin falling bar); 2Q22 ex. derivatives and price timing $ 4,011 (blue total bar); Unsettled derivatives 810 (green, rising); Price / timing 450 (green, rising); 2Q22 ex. ident. items $ 5,273 (blue total bar). Colours: increases green #00A14D, decreases red #C00000, totals blue #0C479D. Connectors are absent. No legend. No highlighted points beyond colour coding. Bar values are printed as labels, inside bars for Margin, Unsettled and Price, above totals, below negative bars.
Slide 17
RELIABLE OPERATIONS AND COST DISCIPLINE DROVE / STRONG CHEMICAL EARNINGS DESPITE LOWER MARGINS / CHEMICAL PRODUCTS / CONTRIBUTING FACTORS TO CHANGE IN EARNINGS / Million USD / $ 1,405 / (90) / (90) / (80) / (70) / $ 1,076 / 1Q22 ex. ident. items / Margin / Volume / / mix / Expenses / Forex / other / 2Q22 ex. ident. items / • North America ethane advantage tightened; industry supply remained stable / • Lower volumes reflect the impact of China lockdowns on demand and logistics constraints / • Seasonally higher planned expenses / • Strong U.S. dollar drove forex impacts / See page 13 for reconciliations. / 17
Visuals: Waterfall chart titled CHEMICAL PRODUCTS / CONTRIBUTING FACTORS TO CHANGE IN EARNINGS, units Million USD, with no printed value axis or gridlines. Six categories left to right: 1Q22 ex. ident. items (total bar, value $ 1,405, blue #0C479D, spans about y 38.8% to 85%); Margin (negative step, (90), red #C00000, about x 12.4% to 16.5%, y 38.8% to 42.6%); Volume / mix (negative step, (90), red, about x 19.9% to 24%, y 42.7% to 46.1%); Expenses (negative step, (80), red, about x 27.4% to 31.5%, y 46.1% to 49.6%); Forex / other (negative step, (70), red, about x 34.9% to 39%, y 49.6% to 52.5%); 2Q22 ex. ident. items (total bar, value $ 1,076, blue, x 42.4% to 46.6%, y 52.6% to 85.1%). Each red step is a floating bar with its value printed in white inside it; the two blue totals have their values printed above in black. Bars are flat rectangles with no outlines or shadows. A thin black horizontal baseline runs under the bars at about y 85.1% from x 3.1% to 48.1%. No legend. No highlighted points beyond the colour coding of totals (blue) and decreases (red). Right side is text only apart from a thin dotted grey vertical divider line at x about 50.1%, from y 21.8% to 89.6%.
Slide 18
STRONG SPECIALTY PRODUCTS EARNINGS ON IMPROVED / MARGINS
SPECIALTY PRODUCTS
CONTRIBUTING FACTORS TO CHANGE IN EARNINGS
Million USD
$ 476
30
(10)
(20)
(60)
$ 417
1Q22 ex. / ident. items
Margin
Volume / / mix
Expenses
Forex / / other
2Q22 ex. / ident. items
•
Margins increased with price actions to offset rising feed / and energy costs
•
Seasonally higher planned expenses
•
Unfavorable forex impacts reflect strong U.S. dollar
See page 13 reconciliations.
18
Visuals: Chart: vertical waterfall bar chart titled 'SPECIALTY PRODUCTS / CONTRIBUTING FACTORS TO CHANGE IN EARNINGS' with unit 'Million USD'. No y-axis or gridlines are printed; bars are scaled relative to one another. Six columns, left to right: 1Q22 ex. ident. items (total bar, blue #0C479D, labelled $ 476, bar about 38.6% of slide height tall starting at about 46.4% from top); Margin (increase, green, labelled 30 in white text inside the bar, about 12.3% to 16.5% of width, top about 44.2%); Volume / mix (decrease, red #C00000, labelled (10) below the bar); Expenses (decrease, red, labelled (20) below the bar); Forex / other (decrease, red, labelled (60) in white text inside the bar, the largest decrease); 2Q22 ex. ident. items (total bar, blue #0C479D, labelled $ 417 above the bar, about 33.3% of slide height tall). Values are printed on every bar, so no estimates are needed. Bars are flat-filled with no outlines. Horizontal black baseline across the chart bottom at about 85% from top. No legend. No highlighted points beyond the colour coding: blue totals, green increase, red decreases. Dotted vertical grey divider line at about 50% of width spanning roughly 21.8% to 89.8% from top.
Slide 19
SIGNIFICANTLY STRENGTHENED CASH POSITION
CASH FLOW
Billion USD
$11.1
20.0
4.0
0.9
0.3
7.6
1.2
$18.9
$16.9 billion
free cash flow
1Q22
cash
CFO
PP&E
/ I&A1
Asset
sales
Debt Shareholder Other
distributions
2Q22
cash
•
Strong earnings drove cash flow from operations
•
Distributed $7.6 billion to shareholders, including $3.7
billion in dividends
•
Second-quarter capex of $4.6 billion or year-to-date $9.5
billion; in line with full-year range of $21 billion - $24 billion
•
Net debt-to-capital reduced to ~13%; debt-to-capital at
~20%
See Supplemental Information for footnotes, definitions, and reconciliations.
19
Visuals: Chart: vertical waterfall (bridge) chart titled 'CASH FLOW' with unit label 'Billion USD'. No axis scale or gridlines are printed. Categories left to right: 1Q22 cash (total bar, blue), CFO (increase bar, green), PP&E / I&A with superscript 1 (decrease bar, mid grey), Asset sales (decrease bar, light grey), Debt (decrease bar, light grey), Shareholder distributions (decrease bar, light grey), Other (decrease bar, light grey), 2Q22 cash (total bar, blue). Printed values: 1Q22 cash $11.1 (top of blue bar about 11.1); CFO 20.0 printed inside the green bar in white; PP&E / I&A 4.0 printed inside the grey bar; Asset sales 0.9 printed above the bar; Debt 0.3 printed below the bar; Shareholder distributions 7.6 printed inside the bar; Other 1.2 printed below the bar; 2Q22 cash $18.9 printed above the blue bar. Bars are floating and step down from the 1Q22 total, with bar heights proportional to values. Bracket beneath the CFO, PP&E / I&A and Asset sales columns, spanning x 10.3% to 25% at y 82%, with a centre tick, labelled '$16.9 billion free cash flow' in bold. No legend. No highlighted points beyond the colour coding: green for CFO, blue for totals, grey for outflows.
Slide 20
THIRD-QUARTER 2022 OUTLOOK
Upstream
•
Anticipate volumes flat, with growth in the Permian and Guyana being offset by recently
announced divestments
Product
Solutions
Energy
Products
•
Lower planned turnarounds and maintenance
Chemical
Products
•
Increased industry supply with new capacity; ongoing logistics challenges
•
Turnarounds and maintenance similar to 2Q22
Specialty
Products
Corporate
•
Corporate and financing expenses expected to be ~$500 million
20
Visuals: A table with two column groups and five data rows, no chart, photograph or logo. Column 1 (blue #0C479D label cells, white text): row 'Upstream' spanning both label columns; row 'Product Solutions' spanning rows 2 to 4 in the first label sub-column (x 3.1%, w 13.3%); sub-labels in second label sub-column (x 16.4%, w 11.0%): 'Energy Products' (y 39.3%, h 12.0%), 'Chemical Products' (y 51.4%, h 12.0%), 'Specialty Products' (y 63.4%, h 12.7%); row 'Corporate' spanning both label columns (y 76.0%, h 14.0%). Column 2 (white cells, black text, bullets): Upstream row: 'Anticipate volumes flat, with growth in the Permian and Guyana being offset by recently announced divestments'; Energy Products row: 'Lower planned turnarounds and maintenance'; Chemical Products row: 'Increased industry supply with new capacity; ongoing logistics challenges' and 'Turnarounds and maintenance similar to 2Q22'; Specialty Products row: empty; Corporate row: 'Corporate and financing expenses expected to be ~$500 million'. A white table panel with a soft grey drop shadow sits behind the grid, spanning about 3.1% to 96.9% horizontally and 21.7% to 90.0% vertically.
Slide 21
KEY TAKEAWAYS
Continuing to invest during the downturn positioned the company to outperform industry and ramp up supply as demand recovered
Investment decisions during downturn reflect company’s focus on fundamentals and long-term view; projects paying off:
Total capacity increased in Guyana to >340 Koebd; continued to ramp up Liza Phase 2
Corpus Christi Chemical Complex cash and earnings positive in 1H22; demonstrating design capacity
Increasing U.S. Gulf Coast refining capacity by 17% or 250 Kbd with the Beaumont refinery expansion project starting in 1Q23
On track to achieve first LNG cargo from Mozambique’s Coral South FLNG in 2H22
Progressing Golden Pass LNG project, which will provide 18 Mta of additional LNG supply; increasing LNG from the Gulf Coast by 20%
Continuing to divest non-strategic assets
Advantaged investments and strong cost control are lowering our breakevens and making us more resilient
Consistent focus on reducing emissions reflected in growing portfolio of opportunities in CCS, hydrogen, and biofuels
Strong balance sheet supports continued investments and shareholder distributions throughout the cycles
Distributed $7.6 billion to shareholders in 2Q22
Net debt-to-capital ratio reduced to 13%
See Supplemental Information for definitions.
21
Slide 22
Q&A / STRATHCONA / ExxonMobil
Visuals: Photograph: a woman engineer in a white hard hat and tinted safety glasses, wearing a blue coverall with a shoulder harness and a coiled radio cord, turned in profile to the right, looking toward the horizon. She has ear protection plugs (green) in her ears and a ponytail. In the foreground a large blurred blue-grey pipe valve handwheel curves across the lower half, out of focus. Behind her is an industrial refinery or petrochemical plant at sunset: tall columns and pipework on the right, a green valve actuator with a yellow label in the middle-right, glowing orange sun low on the horizon, bokeh light points from plant lights. Composition: medium close-up, subject in the upper-left-centre, shallow depth of field. Lighting: warm low sunset light from behind-right, cool blue sky at top. Dominant colours: blue, orange, cream, white, dark teal. Full-bleed, not cropped as a box, no overlay tint visible apart from natural darkening at the lower-left for the text. ExxonMobil logo: white wordmark with the stylised double-x crossed mark, at bottom right, about 12.7% width, 4.3% height.
Slide 23
OUTLOOK FOR THIRD-QUARTER 2022 / UPSTREAM SCHEDULED MAINTENANCE EARNINGS IMPACT¹ / Million USD / 900 / 600 / 300 / 0 / 2021 quarterly average / 1Q22 / 2Q22 / 3Q22 est. / 610 / 410 / ENERGY PRODUCTS SCHEDULED MAINTENANCE EARNINGS IMPACT³ / Million USD / 900 / 600 / 300 / 0 / 2021 quarterly average / 1Q22 / 2Q22 / 3Q22 est. / 360 / 220 / CHEMICAL PRODUCTS SCHEDULED MAINTENANCE EARNINGS IMPACT² / Million USD / 100 / 0 / 2021 quarterly average / 1Q22 / 2Q22 / 3Q22 est. / 50 / 30 / SPECIALTY PRODUCTS SCHEDULED MAINTENANCE EARNINGS IMPACT⁴ / Million USD / 100 / 0 / 2021 quarterly average / 1Q22 / 2Q22 / 3Q22 est. / 40 / 20 / See Supplemental Information for footnotes. / 23
Visuals: Four vertical bar charts with a floating range marker for 3Q22 est. Each chart has a heading in all caps with a superscript footnote number and a 'Million USD' unit line, a y-axis with a 0 baseline and an x-axis of four categories: 2021 quarterly average, 1Q22, 2Q22, 3Q22 est. Upstream: y-axis 0 to 900 with ticks at 0, 300, 600, 900; series bars about 300 (2021 quarterly average), about 430 (1Q22), about 730 (2Q22); 3Q22 est. shown as a black I-beam range with printed values 610 (top) and 410 (bottom). Energy products: y-axis 0 to 900 with ticks at 0, 300, 600, 900; bars about 290 (2021 quarterly average), about 400 (1Q22), about 730 (2Q22); 3Q22 est. I-beam with printed values 360 (top) and 220 (bottom). Chemical products: y-axis 0 to 100 with ticks at 0 and 100; bars about 81 (2021 quarterly average), about 42 (1Q22), about 45 (2Q22); 3Q22 est. I-beam with printed values 50 (top) and 30 (bottom). Specialty products: y-axis 0 to 100 with ticks at 0 and 100; bars about 42 (2021 quarterly average), about 42 (1Q22), about 39 (2Q22); 3Q22 est. I-beam with printed values 40 (top) and 20 (bottom). No legend; no highlighted points; all bars are the same blue. Bars are filled rectangles with no outlines; the I-beams are black with flat caps.
Slide 24
SUPPLEMENTAL INFORMATION
Forward-looking and other statements regarding our environmental, social and other sustainability plans and goals are not an indication that these statements are necessarily / material to investors or required to be disclosed in our filing with the SEC. In addition, historical, current, and forward-looking environmental, social and sustainability-related / statements may be based on standards for measuring progress that are still developing, internal controls and processes that continue to evolve, and assumptions that are / subject to change in the future.
ExxonMobil reported emissions, including reductions and avoidance performance data, are based on a combination of measured and estimated data. Calculations are based on / industry standards and best practices, including guidance from the American Petroleum Institute (API) and IPIECA. The uncertainty associated with the emissions, reductions / and avoidance performance data depends on variation in the processes and operations, the availability of sufficient data, the quality of those data and methodology used for / measurement and estimation. Changes to the performance data may be reported as updated data and/or emission methodologies become available. ExxonMobil works with / industry, including API and IPIECA, to improve emission factors and methodologies, including measurements and estimates.
All references to production rates, project capacity, resource size, and acreage are on a gross basis, unless otherwise noted.
DEFINITIONS AND NON-GAAP FINANCIAL MEASURE RECONCILIATIONS
Debt-to-capital ratio (leverage). Total debt / (total debt + total equity).
Net debt-to-capital ratio. Net debt / (net debt + total equity).
Performance product (performance chemicals). Refers to chemical products that provide differentiated performance for multiple applications through enhanced properties / versus commodity alternatives and bring significant additional value to customers and end-users.
Project. The term “project” as used in this presentation can refer to a variety of different activities and does not necessarily have the same meaning as in any government / payment transparency reports.
Resources, resource base, and recoverable resources. Along with similar terms, refer to the total remaining estimated quantities of oil and natural gas that are expected to be / ultimately recoverable. The resource base includes quantities of oil and natural gas classified as proved reserves, as well as quantities that are not yet classified as proved / reserves, but that are expected to be ultimately recoverable. The term “resource base” or similar terms are not intended to correspond to SEC definitions such as “probable” or / “possible” reserves. The term “in-place” refers to those quantities of oil and natural gas estimated to be contained in known accumulations and includes recoverable and / unrecoverable amounts.
24
Slide 25
SUPPLEMENTAL INFORMATION
DEFINITIONS AND NON-GAAP FINANCIAL MEASURE RECONCILIATIONS, CONTINUED
•
Structural savings (also structural cost reductions, structural efficiencies). Structural savings describe decreases in the below expenses as a result of operational / efficiencies, workforce reductions and other cost-saving measures that are expected to be sustainable compared to 2019 levels. Relative to 2019, estimated cumulative / annual structural savings totaled $6.0 billion, of which $0.2 billion was achieved in 2Q22. The total change between periods in expenses below will reflect both structural / savings and other changes in spend, including market factors, such as energy costs, inflation, and foreign exchange impacts, as well as changes in activity levels and costs / associated with new operations. Estimates of cumulative annual structural savings may be revised depending on whether cost reductions realized in prior periods are / determined to be sustainable compared to 2019 levels. Structural savings are stewarded internally to support management’s oversight of spending over time. This measure / is useful for investors to understand the Corporation’s efforts to optimize spending through disciplined expense management. Forward-looking estimates of structural / savings are based on Company plan, and may include management adjustments.
Consolidated Statement of Income line items targeted for structural savings / 2Q22 / 1Q22 / 2Q21 / 2021 / 2020 / 2019
(millions of dollars)
Production and manufacturing expenses / 10,686 / 10,241 / 8,471 / 36,035 / 30,431 / 36,826
Selling, general and administrative expenses / 2,530 / 2,409 / 2,345 / 9,574 / 10,168 / 11,398
Exploration expenses, including dry holes / 286 / 173 / 176 / 1,054 / 1,285 / 1,269
Total / 13,502 / 12,823 / 10,992 / 46,663 / 41,884 / 49,493
25
Visuals: One table: title column 'Consolidated Statement of Income line items targeted for structural savings' followed by columns 2Q22, 1Q22, 2Q21, 2021, 2020, 2019; a sub-header row '(millions of dollars)' italic right of 2Q21 to 2020 area. Rows: Production and manufacturing expenses 10,686 | 10,241 | 8,471 | 36,035 | 30,431 | 36,826; Selling, general and administrative expenses 2,530 | 2,409 | 2,345 | 9,574 | 10,168 | 11,398; Exploration expenses, including dry holes 286 | 173 | 176 | 1,054 | 1,285 | 1,269; Total 13,502 | 12,823 | 10,992 | 46,663 | 41,884 | 49,493. A thick black rule sits under the header row and under the Total row; a thin black rule sits above the Total row spanning the number columns. No chart, photograph or logo.
Slide 26
SUPPLEMENTAL INFORMATION
FREE CASH FLOW1 / 2Q22
Net cash provided by operating activities (U.S. GAAP) / 19,963
Additions to property, plant and equipment / (3,837)
Proceeds associated with sales of subsidiaries, property, plant and equipment, and sales and returns of investments / 939
Additional investments and advances / (226)
Other investing activities including collection of advances / 60
Free cash flow / 16,899
Free cash flow is cash flow from operations and asset sales less additions to property, plant and equipment, and additional investments and advances, plus other investing activities, including collection of advances. This measure is useful when evaluating cash available for financing activities, including shareholder distributions after investment in the business. For information concerning the calculation and reconciliation of free cash flow for historical periods, please see the Frequently Used Terms available on the Investors page of the company's website at www.exxonmobil.com under the heading News & Resources.
1 Billion USD.
26
Visuals: Table titled FREE CASH FLOW with superscript 1, in a column headed 2Q22 (units: Billion USD per footnote 1). Rows in order: Net cash provided by operating activities (U.S. GAAP) = 19,963; Additions to property, plant and equipment = (3,837); Proceeds associated with sales of subsidiaries, property, plant and equipment, and sales and returns of investments = 939; Additional investments and advances = (226); Other investing activities including collection of advances = 60; Free cash flow = 16,899 (bold). The header row is a solid blue bar with white text. A thin dark rule sits above the Free cash flow total in the value column and a thin dark rule closes the table beneath the total row. No chart, photograph or logo.
Slide 27
SUPPLEMENTAL INFORMATION
“Scheduled maintenance,” as used on slide 14, is included below as part of the “Volume / Mix” and “Expenses” categories.
UPSTREAM EARNINGS FACTOR ANALYSIS¹
2Q22 vs. 1Q22
Prior Period
4,488
Realization
3,000
Volume / Mix
570
Expenses
(190)
Identified Items
3,550
Other
(50)
Current Period
11,371
As used on slide 15, “Scheduled maintenance” is included as part of the “Downtime / Maintenance ” category; “Russia curtailment” is included as part of the “Government Mandates” category; “Price entitlement” is included below as part of the “Entitlement / Divestment ” category; and “Weather / other” is included in both “Downtime / Maintenance” and “Demand / Other.”
UPSTREAM VOLUME ANALYSIS²
2Q22 vs. 1Q22
Prior Period
3,675
Downtime / Maintenance
(1)
Growth / Decline
104
Entitlements / Divestments
(53)
Government Mandates
(26)
Demand / Other
33
Current Period
3,732
¹ Million USD.
² Koebd.
27
Visuals: Two tables, no charts, photographs or logos. Table 1 titled UPSTREAM EARNINGS FACTOR ANALYSIS¹ with column header 2Q22 vs. 1Q22; rows: Prior Period 4,488 (bold); Realization 3,000; Volume / Mix 570; Expenses (190); Identified Items 3,550; Other (50); Current Period 11,371 (bold). A thin black rule sits above the Current Period value (about 45% y, right column only) and a full-width black rule sits below the Current Period row (about 49% y). Table 2 titled UPSTREAM VOLUME ANALYSIS² with column header 2Q22 vs. 1Q22; rows: Prior Period 3,675 (bold); Downtime / Maintenance (1); Growth / Decline 104; Entitlements / Divestments (53); Government Mandates (26); Demand / Other 33; Current Period 3,732 (bold). A thin black rule sits above the Current Period value (about 88% y, right column only) and a full-width black rule sits below the Current Period row (about 92% y). Row labels are left-aligned and indented under the bold Prior Period and Current Period rows; values are centred in the right-hand column.
Slide 28
SUPPLEMENTAL INFORMATION
“Margin,” “Unsettled derivatives,” and “Price timing” as used on slide 16 are included below as part of the “Margin” category.
ENERGY PRODUCTS EARNINGS FACTOR ANALYSIS1 / 2Q22 vs. 1Q22
Prior Period / (196)
Margin:
Margin / 4,740
Unsettled derivatives / 810
Price / timing / 450
Total margin / 6,000
Volume / mix / (400)
Expenses / (110)
Other / (20)
Current Period / 5,273
1 Million USD. / 28
1
Visuals: One table, titled ENERGY PRODUCTS EARNINGS FACTOR ANALYSIS with superscript 1, with two columns: a label column on the left and a value column on the right headed 2Q22 vs. 1Q22. Rows in order: Prior Period (196) in bold; Margin: (section label, no value); Margin 4,740 (indented); Unsettled derivatives 810 (indented); Price / timing 450 (indented); Total margin 6,000 (further indented, with a thin rule above the value); Volume / mix (400); Expenses (110); Other (20) (thin rule above the value); Current Period 5,273 in bold with a heavy black rule beneath. Values are right-aligned in the value column. No charts, photographs or logos.
Slides 29 to 29 continue in the full text file.
Download this deck
The hosted PDF of every library deck is free for readers of the SlideDeck Co newsletter. Join with your email and the viewer and download appear here.
Preparing a results presentation or business update of your own? The SlideDeck Co Standard Deck is a slide library for business reviews, updates and plans.







