
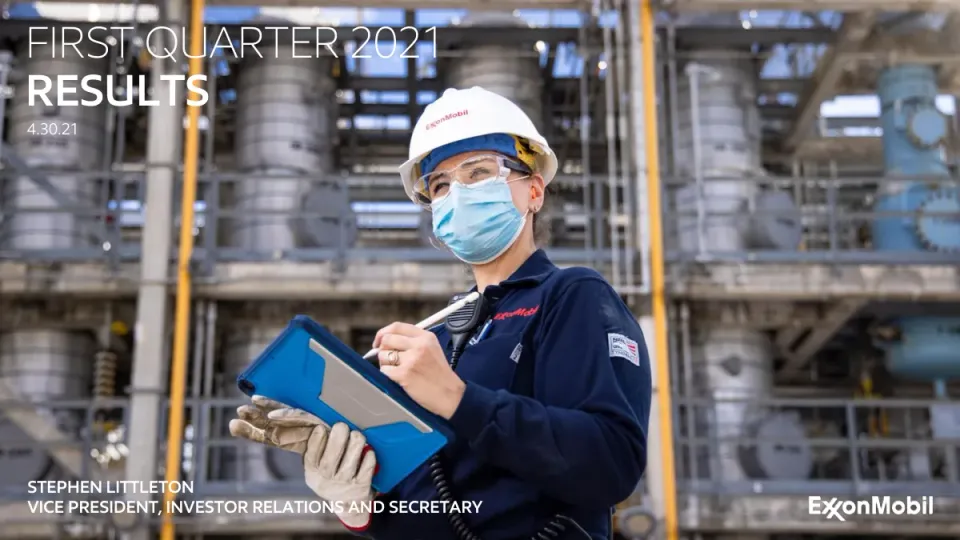
The deck opens with a title slide for the first quarter 2021 results, followed by a cautionary statement on forward-looking information. It then summarises developments since the fourth quarter of 2020 across the Upstream, Downstream, Chemical and Corporate segments. The financial section comes next, with waterfall charts explaining earnings and volume changes quarter on quarter, a year-on-year earnings bridge, a cash operating expense and capex comparison, and a cash profile table. A second quarter outlook follows, then a management perspectives section led by the chairman and chief executive, covering positioning, the improving environment, prioritised investments, project value, shareholder value, capital allocation and climate strategy. The deck closes with a Q&A slide, maintenance outlook charts and a supplemental information section with footnotes, definitions and reconciliations. Many slides pair a headline, with the key comparison period in red, a bold number callout and short bullet commentary beside each chart. Slides 5 and 7 contain waterfall charts showing how each driver moves earnings, and slide 11 holds the cash profile table, which ties earnings to ending debt in one view.
Slides worth studying
- Slide 5: A waterfall chart with colour-coded positive and negative bars makes each driver of the earnings change readable at a glance.
- Slide 11: A tight two-column table with bold subtotal bands traces cash from beginning to ending balance without extra decoration.
- Slide 3: Four labelled colour bands organise the quarter's developments by segment, so the summary scans quickly.
Details
- Company: ExxonMobil
- Year: 2021
- Type: Investor presentation
- Industry: Energy
- Pages: 38
The hosted copy of this deck is being prepared. Newsletter readers will find the download here.
Review score: 7 out of 10, Effective
Presentation quality, judged with the SlideDeck Co review heuristic. Ask, evidence and idea merit are not rated here.
The results half is strong: slide 4 reconciles 4Q20 GAAP of (20.1) to 1Q21 GAAP of 2.7 by segment, and the winter storm is pulled out as its own line there and as its own bar in every waterfall, (240) on slide 5 and (230) on slide 8, so a one-off is visible instead of buried in volume. Slide 12 holds the outlook by segment, slide 28 shows next-quarter maintenance as ranges, and slides 29 and 31 reconcile identified items and cash operating expenses. The bottleneck is that 13 of the 38 pages (slides 14 to 26) are an advocacy section on strategy and carbon capture that stops reporting the quarter, and its exhibits are looser. Slide 20 sets Best-ever and Solutions in the same large numeral style as ~2.8 million and >$9 billion, and on slide 21 the Flexible label in the Capex bar is hidden behind a marker.
Worth keeping: Keep the practice of giving a one-off event its own row in the table on slide 4 and its own bar in each segment waterfall.
Most useful repair: On slide 20 replace the two word tiles with measured figures or remove them, and fix the hidden Flexible label on slide 21 so the Capex split can be read.
What would change the score: If the library treats the management section as a separate strategy document and judges only slides 1 to 12 and 28 to 37, the reporting craft would support an 8.
Confidence high. 38 of 38 pages inspected on contact sheets, 12 at readable size. Reviewed 2026-11-15. Model-assisted review (claude-fable-5-2, in session).
Full text of the slides (38 slides)
Every slide's words and a description of its charts and images, so the deck can be searched and rebuilt. Also available as Markdown.
Slide 1
FIRST QUARTER 2021 / RESULTS / 4.30.21 / STEPHEN LITTLETON / VICE PRESIDENT, INVESTOR RELATIONS AND SECRETARY / ExxonMobil
Visuals: Full-bleed photograph of a woman in an ExxonMobil navy coverall and white hard hat with red ExxonMobil lettering, clear safety glasses and a light blue surgical mask. She holds a blue and grey tablet in her gloved hands (beige work gloves) with a white stylus, and a black radio is clipped at her shoulder. She looks up and to the left. Behind her are grey cylindrical process vessels, steel walkways and railings, a yellow vertical pipe and a light blue pipe on the right, under bright daylight. Composition is a medium shot from a slightly low angle, with the subject right of centre and cropped at the bottom edge. Dominant colours are navy, grey, white, blue and yellow. No overlay or tint is visible. The ExxonMobil wordmark logo is white.
Slide 2
CAUTIONARY STATEMENT
Statements of future events or conditions in this presentation or the subsequent discussion period are forward-looking statements. Actual future
results, including financial and operating performance; demand growth and mix; planned capital and cash operating expense reductions and ability to
meet or exceed announced reduction objectives; plans to reduce future emissions intensity and the expected resulting absolute emissions reductions;
carbon capture results and the impact of operational and technology efforts; progress on innovative concepts like the Houston CCS zone; price and
margin recovery; future cash flows, dividends, cash and debt balances, and capital allocation; volume/production maintenance and mix; the impacts of
the COVID-19 pandemic and current industry oversupply conditions on ExxonMobil’s business and results; resource recoveries; production rates; rates
of return; development costs; project plans, timing, costs, and capacities; drilling programs and improvements; and product sales and mix could differ
materially due to a number of factors including global or regional changes in oil, gas, petrochemicals, or feedstock prices, differentials, or other market
or economic conditions affecting the oil, gas, and petrochemical industries and the demand for our products; the outcome of government policies and
actions, including drilling policies, carbon policies, and actions taken to address COVID-19; the severity, length and ultimate impact of COVID-19 on
people and economies and the timing and pace of regional and global economic recovery; the ability to access short- and long-term debt markets on a
timely and affordable basis; the ability to realize efficiencies within and across our business lines and to maintain cost reductions without impairing our
competitive positioning; the impact of company actions to protect the health and safety of employees, vendors, customers, and communities; reservoir
performance; the outcome and timing of exploration and development projects; timely completion of construction projects; war and other security
disturbances, including shipping blockades or harassment; political factors including changes in local, national, or international policies affecting our
business; changes in law or government regulation, including trade sanctions, tax and environmental regulations; the outcome of commercial
negotiations and impact of commercial terms; actions of competitors and commercial counterparties; actions of consumers; opportunities for and
regulatory approval of investments or divestments that may arise; the outcome of research efforts and the ability to bring new technology to
commercial scale on a cost-competitive basis; the development and competitiveness of alternative energy and emission reduction technologies;
unforeseen technical or operating difficulties; and other factors discussed here and in Item 1A. Risk Factors of our Annual Report on Form 10-K and
under the heading “Factors Affecting Future Results” available through the Investors page of our website at exxonmobil.com. All forward-looking
statements are based on management’s knowledge and reasonable expectations at the time of this presentation and we assume no duty to update
these statements as of any future date.
Reconciliations and definitions of non-GAAP measures and other terms are provided in the text or in the supplemental information accompanying these
slides.
2
Slide 3
DEVELOPMENTS SINCE FOURTH QUARTER 2020
UPSTREAM
Improved liquids and gas realizations with market recovery
Lower government-mandated curtailments and higher seasonal European gas demand
Announced >$1 billion sale of U.K. central and northern North Sea assets 1
DOWNSTREAM
Improved North America margins, continued challenges with Europe and global jet demand
Provided power to more than 200,000 Texas homes during the winter storm
Announced refinery terminal conversions; ~500 Kbd of industry rationalizations announced in 2021
CHEMICAL
Margins increased on strong demand, tight industry supply, and global shipping constraints
Reliable operations and rapid winter storm recovery; continued delivery of cost efficiencies
CORPORATE
Reduced debt by more than $4 billion
Operations rapidly recovered across all businesses following winter storm
Established Low Carbon Solutions business to commercialize emission-reduction technology portfolio
3
See Supplemental Information for footnotes.
Visuals: Four solid blue (#0C479D) rectangular label blocks with white bold uppercase text: UPSTREAM, DOWNSTREAM, CHEMICAL, CORPORATE, stacked vertically at the left of their bands; the blocks have square corners and no shadow. Four thin horizontal blue (#0C479D) rules, about 0.2% of slide height thick, run from about x 19.3% to x 97.6% at the top of each band (y about 23.4%, 41.7%, 60.0%, 73.5%). No photographs, charts, tables, logos or icons.
Slide 4
RESULTS 1Q21 VS. 4Q20 | U/S | D/S | CHEM | C&F | TOTAL | 4Q20 GAAP Earnings / (Loss) | (18.5) | (1.2) | 0.7 | (1.0) | (20.1) | Identified items | (19.3) | (0.5) | - | (0.3) | (20.2) | 4Q20 Earnings / (Loss) ex. identified items | 0.7 | (0.7) | 0.7 | (0.7) | 0.1 | Winter storm | (0.2) | (0.1) | (0.2) | - | (0.6) | Price / margin / forex | 2.2 | 0.1 | 0.5 | 0.1 | 2.8 | Unsettled derivatives: mark-to-market 1 | (0.0) | 0.3 | - | - | 0.3 | Demand / volume | (0.1) | (0.0) | 0.1 | - | (0.0) | Other base business | 0.0 | 0.1 | 0.3 | (0.2) | 0.2 | 1Q21 Earnings / (Loss) ex. identified items | 2.6 | (0.4) | 1.4 | (0.8) | 2.8 | Identified items – severance | - | - | - | (0.0) | (0.0) | 1Q21 GAAP Earnings / (Loss) | 2.6 | (0.4) | 1.4 | (0.8) | 2.7 | • Price / margin improvements across all | businesses with demand recovery | • Winter storm impacted all businesses; rapid | recovery minimized impact | • Continued benefit from structurally lower | operating costs | Billions of dollars unless specified otherwise. | Due to rounding, numbers presented above may not add up precisely to the totals indicated. | See Supplemental Information for footnotes, definitions, and reconciliation of Identified items. | 4
Visuals: Table (financial reconciliation) with columns: a blank label column, U/S, D/S, CHEM, C&F, TOTAL. Rows in order with values: 4Q20 GAAP Earnings / (Loss): (18.5), (1.2), 0.7, (1.0), (20.1). Identified items: (19.3), (0.5), -, (0.3), (20.2). 4Q20 Earnings / (Loss) ex. identified items (grey highlighted row, bold): 0.7, (0.7), 0.7, (0.7), 0.1. Winter storm: (0.2), (0.1), (0.2), -, (0.6). Price / margin / forex: 2.2, 0.1, 0.5, 0.1, 2.8. Unsettled derivatives: mark-to-market (superscript 1): (0.0), 0.3, -, -, 0.3. Demand / volume: (0.1), (0.0), 0.1, -, (0.0). Other base business: 0.0, 0.1, 0.3, (0.2), 0.2. 1Q21 Earnings / (Loss) ex. identified items (grey highlighted row, bold): 2.6, (0.4), 1.4, (0.8), 2.8. Identified items – severance: -, -, -, (0.0), (0.0). 1Q21 GAAP Earnings / (Loss): 2.6, (0.4), 1.4, (0.8), 2.7. Black horizontal rules separate the subtotal rows and close the table at the bottom. No photographs, icons or logos.
Slide 5
UPSTREAM 1Q21 VS. 4Q20
CONTRIBUTING FACTORS TO CHANGE IN EARNINGS
Million USD
2,554
745
(240)
2,070
170
(80)
(110)
• Continued market recovery increased liquids,
natural gas, and LNG realizations
• Higher volumes with lower government-mandated
curtailments, more than offset by mix effects
• Continuing to deliver further structural efficiencies
4Q20 ex.
ident. items
Winter
storm
Price
Volume
Expenses
Tax / other
1Q21 ex.
ident. items
See Supplemental Information for definitions.
5
Visuals: Vertical waterfall (bridge) chart titled CONTRIBUTING FACTORS TO CHANGE IN EARNINGS, unit Million USD. Seven columns left to right with category labels: 4Q20 ex. ident. items = 745 (blue total bar); Winter storm = (240) (red decrease bar); Price = 2,070 (green increase bar); Volume = (80) (red decrease bar); Expenses = 170 (green increase bar); Tax / other = (110) (red decrease bar); 1Q21 ex. ident. items = 2,554 (blue total bar). Value labels: 745 and 2,554 printed above the blue total bars in bold; 2,070 printed inside the green Price bar in white; (240) printed inside the red Winter storm bar in white; 170 printed inside the green Expenses bar in white; (80) and (110) printed beneath their red bars in black. No y-axis, no tick marks and no numeric scale are printed; bar heights are proportional to values, with about 745 at the bottom of the bars and about 2,554 at the top of the tallest bar. Horizontal black baseline across the chart at about 85% from the top. No legend. No highlighted points beyond the colour coding: blue totals, green increases, red decreases.
Slide 6
UPSTREAM VOLUMES 1Q21 VS. 4Q20
CONTRIBUTING FACTORS TO CHANGE IN VOLUMES
Koebd
3,787
3,689
40
70
60
(40)
(40)
Government-mandated curtailments reduced to
~125 Koebd
Higher seasonal European gas demand
Permian and Guyana unchanged versus 4Q20
excluding winter storm impact
− Permian up ~20% since 1Q20
− Guyana up ~70% since 1Q20
4Q20
Winter
storm
Entitle-
ments
Curtail-
ments
Demand
Maint /
other
1Q21
6
See Supplemental Information for additional information on winter storm and curtailments.
Visuals: Waterfall chart titled CONTRIBUTING FACTORS TO CHANGE IN VOLUMES with unit subtitle Koebd (thousand oil equivalent barrels per day). No numeric axis or scale is printed; the baseline is a horizontal black line and bar heights are proportional to values. Categories left to right: 4Q20 total bar 3,689 (blue); Winter storm (40) (red, decrease); Entitlements (40) (red, decrease); Curtailments 60 (green, increase); Demand 70 (green, increase); Maint / other 40 (green, increase); 1Q21 total bar 3,787 (blue). Totals are labelled above their bars in bold black; delta values are printed inside the floating bars in white. No legend. No highlighted points beyond the colour coding of increases and decreases.
Slide 7
DOWNSTREAM 1Q21 VS. 4Q20
CONTRIBUTING FACTORS TO CHANGE IN EARNINGS
Million USD
(691)
(130)
490
(40)
380
(40)
(210)
(150)
(390)
4Q20 ex.
ident.
items
Winter
storm
Margin
Demand
Expenses
Mfg.
volume
LIFO /
forex
Other
1Q21 ex.
ident.
items
•
Improved margins primarily on increased North
America demand
•
Jet demand remains weak with limited global travel
•
Structural efficiencies include maintenance
optimization, logistics, and marketing
•
Unfavorable foreign exchange impacts and
absence of year-end LIFO adjustment
•
Other includes reserve for terminal conversions
7
See Supplemental Information for definitions.
Visuals: A waterfall chart titled CONTRIBUTING FACTORS TO CHANGE IN EARNINGS with the unit subtitle Million USD. There are no printed axes, gridlines or scale ticks; the only reference is a thin black horizontal baseline at about y 36.7 percent, from the left edge of the first bar to about x 96 percent. Bars from left to right, with labelled values: 4Q20 ex. ident. items (691) as a blue total bar extending downward below the baseline, labelled below the bar in black semibold; Winter storm (130) as a red decrease bar, label in white inside; Margin 490 as a green increase bar, label in white inside; Demand (40) as a small red decrease bar, label in white inside; Expenses 380 as a green increase bar, label in white inside; Mfg. volume (40) as a small red decrease bar above the baseline, label in white inside; LIFO / forex (210) as a red decrease bar above the baseline, label in white inside; Other (150) as a red decrease bar, label in white inside; 1Q21 ex. ident. items (390) as a blue total bar, label below the bar in black semibold. Estimated bar extents are given in elements. No legend. Highlighted points: none; colour alone encodes direction, with blue for totals, green for increases and red for decreases. The waterfall bars are flat-filled with no outlines or shadows.
Slide 8
CHEMICAL 1Q21 VS. 4Q20
CONTRIBUTING FACTORS TO CHANGE IN EARNINGS
Million USD
1,415
180
150
100
713
500
(230)
4Q20 ex.
ident. items
Winter
storm
Margin
Demand
Expenses
LIFO /
other
1Q21 ex.
ident. items
•
Captured improved industry margins with reliable
polyethylene and polypropylene operations
•
Continued robust performance products demand
in packaging and durable goods
•
Delivered additional cost reductions from
turnarounds and maintenance scope optimization
See Supplemental Information for definitions.
8
Visuals: A waterfall (bridge) chart titled CONTRIBUTING FACTORS TO CHANGE IN EARNINGS with the unit subtitle Million USD. Seven categories left to right: 4Q20 ex. ident. items (total bar, 713, blue), Winter storm (negative step, (230), red), Margin (positive step, 500, green), Demand (positive step, 100, green), Expenses (positive step, 150, green), LIFO / other (positive step, 180, green), 1Q21 ex. ident. items (total bar, 1,415, blue). No y-axis or gridlines are drawn; the value scale is implied by bar heights, with a single horizontal baseline under the bars. Bars are solid flat fills with no outline. Value labels: totals 713 and 1,415 are printed bold above their bars in black; step values are printed inside the bars in white (Winter storm (230), Margin 500, Demand 100, Expenses 150, LIFO / other 180). No legend. No highlighted points beyond the colour coding: blue for totals, red for the negative step, green for positive steps. Bar geometry (approximate, as % of slide): 4Q20 bar x 4.3 to 8.1, y 55.9 to 85.0; Winter storm x 11.0 to 14.8, y 55.9 to 65.2; Margin x 17.8 to 21.6, y 44.6 to 65.2; Demand x 24.6 to 28.3, y 40.5 to 44.6; Expenses x 31.3 to 35.1, y 34.4 to 40.5; LIFO / other x 38.1 to 41.8, y 27.3 to 34.4; 1Q21 bar x 44.8 to 48.6, y 27.3 to 85.0.
Slide 9
EARNINGS 1Q21 VS. 1Q20
CONTRIBUTING FACTORS TO CHANGE IN EARNINGS
Million USD
2,273
(590)
1,690
740
1,070
(550)
2,761
(1,880)
Unsettled derivatives mark-to-market
• Total price / margin improvement of ~$1.3 billion1
– Improvement in Upstream and Chemical margins more than offset Downstream
– Absence of significant mark-to-market derivatives benefit due to rapid price decline in 1Q20
• Structural cost efficiencies include maintenance, supply chain optimizations, and workforce reductions
• Lower Upstream volumes and unfavorable foreign exchange
1Q20 ex. ident. items / Winter storm / U/S price / Chem margin / D/S margin / Expenses / Volume / forex / other / 1Q21 ex. ident. items
See Supplemental Information for footnotes and definitions.
9
Visuals: Waterfall chart (vertical bar, floating bars). Title: CONTRIBUTING FACTORS TO CHANGE IN EARNINGS; unit line: Million USD. Value axis not printed; no tick labels; horizontal baseline only at about 82.7 percent of slide height from about x 2.8 to 50 percent. Categories left to right with values: 1Q20 ex. ident. items 2,273 (total, blue); Winter storm (590) (decrease, red); U/S price 1,690 (increase, green); Chem margin 740 (increase, green, label inside bar); D/S margin (1,880) (decrease, red upper segment with lighter pink segment labelled Unsettled derivatives mark-to-market with (1,880) below bar); Expenses 1,070 (increase, green); Volume / forex / other (550) (decrease, red); 1Q21 ex. ident. items 2,761 (total, blue). Bars are solid rectangles with no outline, no gridlines, no legend. Highlighted point: pink segment of D/S margin bar indicating unsettled derivatives mark-to-market, with a short leader tick pointing to its label. Totals bold labels above bars; decreases shown in parentheses. Bullet glyphs are red dots and red dashes.
Slide 10
DISCIPLINED INVESTING AND COST MANAGEMENT
CASH OPEX EXCLUDING ENERGY AND PRODUCTION TAXES
Billion USD
10.2
(0.7)
(0.3)
9.2
1Q20
Upstream
Downstream / Chemical / other
1Q21
Efficiencies and cost reductions on track, consistent with plans
Cash Opex structurally lower due to maintenance / turnaround efficiencies and workforce reductions
CAPEX
Billion USD
7.1
2.8
1.2
3.1
1Q20
Upstream
Downstream / Chemical / other
1Q21
Capital expenditures in line with plan
10
See Supplemental Information for definitions.
Visuals: Two vertical waterfall (bridge) charts, both in Billion USD, with no printed axes, gridlines or axis ranges; bars are drawn on a shared baseline. Chart 1, titled CASH OPEX EXCLUDING ENERGY AND PRODUCTION TAXES (Billion USD): 1Q20 total bar, blue, labelled 10.2 above the bar; Upstream decrement, green, floating, labelled (0.7) in white inside the bar; Downstream / Chemical / other decrement, green, floating, thin, labelled (0.3) in black below the bar; 1Q21 total bar, blue, labelled 9.2 above the bar. Chart 2, titled CAPEX (Billion USD): 1Q20 total bar, blue, labelled 7.1 above; Upstream increment, green, floating, labelled 2.8 in white inside the bar; Downstream / Chemical / other decrement, green, labelled 1.2 in white inside the bar; 1Q21 total bar, blue, labelled 3.1 above. No legend. No points are highlighted beyond the colour coding of totals (blue) versus movements (green). Bar heights are proportional to the printed values; no axis values are printed.
Slide 11
FIRST QUARTER 2021 CASH PROFILE / 1Q21 4Q20 / Beginning cash 4.4 8.8 / Earnings / (Loss) 2.7 (20.1) / Identified items: impairments - 19.3 / Depreciation1 5.0 5.0 / Working capital / other1 1.5 (0.2) / Cash flow from operating activities 9.3 4.0 / Proceeds associated with asset sales 0.3 0.8 / Cash flow from operations and asset sales 9.6 4.8 / Shareholder distributions (3.7) (3.7) / PP&E adds / investments and advances2 (2.7) (4.1) / Debt / other financing (4.0) (1.5) / Ending cash 3.5 4.4 / Ending debt3 63.3 67.6 / • Stronger overall market fundamentals improved cash flow / • Efficiencies continuing to increase cash flow from operations / • Deleveraging with additional cash; more than $4 billion of debt reduction / Billions of USD. Due to rounding, numbers presented above may not add up precisely to the totals indicated. / See Supplemental Information for footnotes. / 11
Visuals: A financial table with five full-width rows filled solid blue #0C479D (Beginning cash, Cash flow from operating activities, Cash flow from operations and asset sales, Ending cash, Ending debt) with white semibold text, and unfilled white rows for the remaining line items with black regular text. Columns: row label, 1Q21, 4Q20. Rows: Beginning cash 4.4 / 8.8; Earnings / (Loss) 2.7 / (20.1); Identified items: impairments - / 19.3; Depreciation1 5.0 / 5.0; Working capital / other1 1.5 / (0.2); Cash flow from operating activities 9.3 / 4.0; Proceeds associated with asset sales 0.3 / 0.8; Cash flow from operations and asset sales 9.6 / 4.8; Shareholder distributions (3.7) / (3.7); PP&E adds / investments and advances2 (2.7) / (4.1); Debt / other financing (4.0) / (1.5); Ending cash 3.5 / 4.4; Ending debt3 63.3 / 67.6. Units: billions of USD. Values in parentheses are negative. No chart, photograph, logo or icon. Thin white separators divide the value columns.
Slide 12
SECOND QUARTER 2021 OUTLOOK
UPSTREAM
Announced government-mandated curtailments in line with 1Q21
Lower volumes with seasonal gas demand and higher scheduled maintenance
U.K. North Sea sale expected to close near mid-year, subject to regulatory and third-party approvals
DOWNSTREAM
Continuing demand improvement with economic recovery
Higher planned turnarounds and maintenance
CHEMICAL
Continuing tight supply / demand balance with increased industry maintenance
Higher planned turnarounds and maintenance
CORPORATE
Corporate and financing expenses expected to be ~$600 million
Continue to progress deleveraging
12
Slide 13
MANAGEMENT
PERSPECTIVES
DARREN WOODS
CHAIRMAN OF THE BOARD AND CHIEF EXECUTIVE OFFICER
ExxonMobil
Visuals: One photograph, full-bleed, covering 100% of the slide. Subject: a worker in a navy boiler suit, black face mask and clear safety glasses, wearing blue nitrile gloves, with one arm raised to adjust a valve or fitting on a stainless-steel process rig. The worker has a red name tag reading 'Robert'. In the foreground are two tall stainless-steel vertical vessels with silver flanged bases, one labelled 'SONTEX' on a white plate at the base, the other labelled 'SONTEX' on a second plate; the upper vessel bears a label reading 'H&P GAS' and a white circular gauge. Blue valve handles, aluminium extrusion frames, silver pipes and tubing fill the foreground and left background. Composition: medium-wide, shot from low angle looking up, the worker centred slightly right, cropped at the bottom by the frame. Lighting: bright, even indoor light with soft highlights on the metal. Dominant colours: silver and steel grey, navy blue, with blue accents and a small red label. The photo is not boxed, not cropped by a shape, and has two translucent dark-grey tints overlaid: one across the top-left block (0 to 55.2% wide, 0 to 24.9% high) and one across the bottom-left strip (0 to 55.1% wide, 83.6 to 100% high), both at 35% opacity. The ExxonMobil logo is a white wordmark with a stylised double-X mark in the 'X' position, placed over the photo.
Slide 14
POSITIONED FOR / SUCCESS / Decisive response to pandemic balanced near, medium, and long-term priorities / • Developing industry-leading portfolio of advantaged investments / • Restructuring provided foundation for rapid response and significant improvements / − Fewer organizational interfaces improved speed and quality of decisions / − Single project organization optimized and paced portfolio while enhancing value / • Substantive cost reductions with improved operational performance / − Streamlined organization with less overhead and simpler processes / − Clearer line of sight to market and increased P&L accountability / • Balanced spending reductions with leverage to maintain dividend and progress highest-return investments / • Low Carbon Solutions established to advance technology and enable emissions reductions at scale / • Paced investments and maintenance with recovery in mind / − Achieved short-term reductions while preserving upside / − Efficiently paused projects at optimum break points / 14
Slide 15
IMPROVING ENVIRONMENT / Prices and margins returning to historic range / PRICES / MARGINS / 2010—2021 / Crude¹ ($/bbl) / Natural gas² ($/mbtu) / Downstream margins³ ($/bbl) / Chemical margins⁴ ($/tonne) / 1Q21 / 2010-19 annual range / 4Q20 / 3Q20 / • Crude and natural gas markets improved with demand recovery / • Chemical margins driven by tight industry supply and global shipping constraints / • Downstream margins improved from historic lows driven by North America / − Low jet demand and slow recovery in Europe continue / − Diesel and gasoline demand forecast to return to pre-pandemic levels by year-end 2021 5 / See Supplemental Information for footnotes. / 15
Visuals: Chart: a range-marker chart of four vertical columns with the title 'PRICES / MARGINS', subtitle '2010—2021'. Columns (left to right): Crude¹ ($/bbl), Natural gas² ($/mbtu), Downstream margins³ ($/bbl), Chemical margins⁴ ($/tonne). Each column shows a light blue-grey band (#B6C7E1) representing the 2010-19 annual range, with no axis lines, tick labels or gridlines printed; values are not printed, so positions are only relative (about). Each column has up to three diamond markers: navy #0C479D for 1Q21, red #FE0000 for 4Q20, grey #7F7F7F for 3Q20. Crude: 1Q21 about mid-band (about 58% of slide height), 4Q20 and 3Q20 at the band's bottom edge and just below (about 65–66%). Natural gas: 1Q21 about 55% of slide height inside the band, 4Q20 about 63% at the lower band, 3Q20 about 76% below the band. Downstream margins: no band fill is visible in the bottom half; 1Q21 about 72%, 4Q20 about 79%, 3Q20 about 81% of slide height, all below the band. Chemical margins: 1Q21 at the band top (about 39%), 4Q20 about 57%, 3Q20 about 65% at the band bottom. Legend: text labels '1Q21' (navy), '2010-19 annual range' (light blue #7E9CC7), '4Q20' (red), '3Q20' (grey) placed to the right of the Chemical column. No photographs, logos or icons.
Slide 16
PRIORITIZED INVESTMENTS
Progressing development of highest-return opportunities
DEEPWATER
>10% return at <$35/bbl1
PERMIAN
>10% return at <$35/bbl2
CORPUS CHRISTI
CHEMICAL COMPLEX
>$500 million / year earnings3
Guyana
• 5th and 6th drilling rigs arrived in Guyana
• Liza Unity FPSO expected to sail from Singapore mid-year
• Payara on schedule; progressing Yellowtail development plan
Brazil
• Advancing Bacalhau towards FID
• Continuing exploration drilling
Permian
• Continued positive free cash in 1Q21
• Continuing to deliver frac and drilling cost improvements
• Performance improvements increasing 2021 outlook to 410-430 Koebd
Corpus Christi
• All modules onsite; start-up readiness activities underway
• Expected to deliver 25% below industry average cost4
• 4Q21 start-up ahead of schedule
See Supplemental Information for footnotes and definitions.
16
Visuals: Three photographs and three coloured header boxes. (1) Deepwater header: solid red box #C00000 with white text. Photograph below it: an offshore floating production vessel (FPSO) lit with warm yellow and white lights on a dark sea at dusk, with a drilling derrick on the deck and dark scattered clouds in a blue-grey sky; full-width landscape crop, boxed in a rectangle with square corners, no overlay. (2) Permian header: solid blue box #0C479D with white text. Photograph below: an indoor control room where a man in a light blue checked shirt sits in a black chair in the foreground, looking to his left, with a blurred woman at a monitor in the left background; multiple monitors show blue-lit process diagrams and data columns; cool blue dominant lighting with dark shadows; boxed rectangular crop, no overlay. (3) Corpus Christi header: solid green box #00A14D with white text. Photograph below: a daytime ground-level view of a petrochemical complex with grey steel pipe racks, towers, vessels and stairways, a yellow-painted safety ladder, pale sandy ground with concrete footings, a blue sky with white clouds at the upper right; boxed rectangular crop, no overlay. No charts, tables, logos or icons.
Slide 17
PRESERVING PROJECT / VALUE
Leveraging unique capabilities to deliver robust project returns
BAYTOWN CHEMICAL EXPANSION
2Q20 / Current
BATON ROUGE POLYPROPYLENE
1Q20 / Current
• Collaborated with contractors, partners, and / governments to effectively pace projects
• Global Projects organization optimally managed / activity to preserve value and provide flexibility
• Deferral costs offset with efficiencies and market / savings
– Downstream and Chemical portfolio return of ~30%1
• Planned resumption of project activity in line with / market recovery
See Supplemental Information for footnotes.
17
Visuals: Four photographs arranged in a 2 by 2 grid inside two grey panels. Top panel, labelled BAYTOWN CHEMICAL EXPANSION: left photo (tag 2Q20) is an aerial view of a large construction site, with a steel-framed industrial building under erection, red and white cranes, stacked tan/yellow modular boxes and parked trucks on bare brown ground, under hazy grey-blue daylight; right photo (tag Current) is an aerial view of a completed plant with a long white-roofed building in the foreground, pipe racks, a field of white storage tanks and industrial structures behind, under overcast daylight with muted brown and grey tones. Bottom panel, labelled BATON ROUGE POLYPROPYLENE: left photo (tag 1Q20) is an aerial view of an industrial plant under construction, with orange steel structures, grey equipment skids and bare sand ground, tree line at the horizon and a clear blue sky; right photo (tag Current) is an aerial view of a plant with tall steel towers, white storage vessels, pipe racks and a tall yellow crane under a clear blue sky. All four photos are plain rectangles, not cropped to any shape, with no overlay other than the small tag boxes in their top-right corners. Tag boxes are light grey semi-transparent rectangles with square corners and dark text. No charts, tables, logos or icons.
Slide 18
INVESTING IN HIGHEST-RETURN ASSETS / 2020 investments drive cash flow growth / 2020 UPSTREAM INVESTMENTS / Brent $/bbl required to generate the cost-of-supply plus 10% return 1 / 45 / $40/bbl Brent / 30 / 15 / 0 / 2020 Cumulative Capex / OPERATING CASH FLOW FROM PROJECTS RETAINED IN 2020 CAPEX 2 / Billion USD / 8 / 4 / 0 / 2021 / 2025 / • >90% of 2020 investments in resource / development generate >10% return at ≤$35/bbl / • 2020 investments provide ~10% of total Upstream / operating cash flow in 2021 / See Supplemental Information for footnotes and definitions. / 18
Visuals: Two charts. (1) Left: filled area chart titled 2020 UPSTREAM INVESTMENTS, subtitle Brent $/bbl required to generate the cost-of-supply plus 10% return with superscript 1. Solid #0C479D blue area with a stepped, rising cumulative curve running from about 0 at the far left to about 35 at the right, with a steep rise at the far right to the top of the plot at about 45. Y-axis labelled 0, 15, 30, 45 (units $/bbl Brent, range 0 to 45); x-axis labelled 2020 Cumulative Capex with no unit or range shown; no values printed on the curve, so the curve heights are about values only. A horizontal black dashed line (about 2 px stroke) at the $40/bbl Brent level, labelled $40/bbl Brent in bold directly beneath its left end; the dashed line crosses the curve just before the far right rise. A solid black baseline runs along the bottom of the plot. (2) Right: vertical bar chart titled OPERATING CASH FLOW FROM PROJECTS RETAINED IN 2020 CAPEX with superscript 2, subtitle Billion USD. Y-axis labelled 0, 4, 8 (units Billion USD, range 0 to 8). Two solid #0C479D bars: 2021 about 1.9 Billion USD (no printed value) and 2025 about 7.0 Billion USD (no printed value); bars are equal width and centred under their category labels 2021 and 2025 beneath a thin black horizontal baseline. No legend; no highlighted points.
Slide 19
CONTINUING TO GROW PERMIAN VALUE
2020 work provided foundation for ongoing performance improvement
DAILY DRILLING LATERAL FEET1
220%
>80%
improvement
2019
2020
2021 YTD
FRAC STAGES PER DAY
180%
~50%
improvement
80%
2019
2020
2021 YTD
DRILLING AND COMPLETION COSTS2
100%
>40%
improvement
0%
2019
2020
2021 YTD
LEASE OPERATING EXPENSES3
100%
~40%
improvement
0%
2019
2020
2021 YTD
• Increased 1Q21 volumes ~60 Koebd vs. 1Q204
– Despite 35% Capex reduction in 2020 versus plan
– Free cash positive from 4Q20
• Positioned for continued free cash growth
– Significant performance improvement
– Lower costs
– Major infrastructure investments online (Poker Lake central processing facility and pipelines to Gulf Coast)
– Drilled uncomplete inventory >300
See Supplemental Information for footnotes and definitions.
19
Visuals: Four bar charts arranged in a 2 by 2 grid, each in a light grey panel with a title, a y-axis with two labelled ends, a horizontal baseline, year category labels beneath, and a red improvement callout in the upper right of the plot. Bars are solid royal blue #0C479D with no gridlines, no legend and no data labels. Top left, DAILY DRILLING LATERAL FEET1: y axis 80% to 220%, columns 2019 (about 100%), 2020 (about 130%), 2021 YTD (about 190%); callout '>80% improvement' in red. Top right, FRAC STAGES PER DAY: y axis 80% to 180%, columns 2019 (about 110%), 2020 (about 140%), 2021 YTD (about 160%); callout '~50% improvement' in red. Bottom left, DRILLING AND COMPLETION COSTS2: y axis 0% to 100%, columns 2019 (about 100%), 2020 (about 85%), 2021 YTD (about 70%); callout '>40% improvement' in red. Bottom right, LEASE OPERATING EXPENSES3: y axis 0% to 100%, columns 2019 (about 100%), 2020 (about 88%), 2021 YTD (about 80%); callout '~40% improvement' in red. Bar values are estimates, not printed on the slide. No highlighted points beyond the red callouts.
Slide 20
GROWING LONG-TERM SHAREHOLDER VALUE
Highgraded portfolio, improved earnings and cash flow, and positioned for a lower-carbon future
SUSTAINABLE SHAREHOLDER VALUE
~2.8 million
shareholders received reliable dividend1
STRONG CASH FLOW
>$9 billion
1Q21 cash flow from operations; reduced debt by more than $4 billion
STRUCTURAL COST SAVINGS
~10 % reduction
in cash Opex2 versus 1Q20 leveraging prior reorganizations to deliver structural efficiencies
FLEXIBLE CAPEX
$4 billion reduction
versus 1Q20, prioritizing advantaged assets while preserving value of paced investments
INDUSTRY-LEADING OPERATIONS
Best-ever
reliability performance maintained with rapid recovery from the winter storm
LOW CARBON
Solutions
business created and developing technology commercialization strategies initially focused on CCS
See Supplemental Information for footnotes and definitions.
20
Visuals: None. The slide contains no photographs, charts, icons or logos; it has six flat grey rectangular cards that hold large cobalt-blue headline figures and text.
Slide 21
CONSISTENT CAPITAL ALLOCATION PRIORITIES
Balanced approach to maintain the dividend, accretively invest and manage debt
2021 ESTIMATED SOURCES AND USES OF CASH 1,2,3
Billion USD
By Brent price, with
10yr low Downstream
& Chemical margins
$55/bbl
$50/bbl
$45/bbl
Guidance:
$16—19
Flexible
Less flexible
Available cash
from operations
Dividend
Capex
• Long-term capital allocation priorities remain
– Invest in advantaged projects to drive cash flow
– Maintain balance sheet strength
– Provide reliable dividend
• Flexible Capex plan:
– $16—19 billion in 2021
– $20—25 billion per year from 2022—2025
• Strengthening the balance sheet
See Supplemental Information for footnotes and definitions.
21
Visuals: Chart: a floating-column chart of 2021 estimated sources and uses of cash, Billion USD, titled 2021 ESTIMATED SOURCES AND USES OF CASH with superscript 1,2,3. Three columns with categories Available cash from operations, Dividend and Capex. No numeric axis or gridlines are drawn; the values are not printed except where labelled. Available cash from operations is a tall dark blue column (about 0 to 35 percent of slide height from its top at about y 35.6 percent to its base at y 82.8 percent) with white horizontal separator lines at about y 40.0 and y 44.7 percent, labelled on the right $55/bbl at y 34.8 percent, $50/bbl at y 39.4 percent and $45/bbl at y 44.7 percent, with a black dashed horizontal reference line running from the right edge of the first column (x 15.1 percent) to the Capex column (x 37.9 percent) at about y 43.8 percent. The heading above the first column reads By Brent price, with 10yr low Downstream & Chemical margins. Dividend is a single solid dark blue column from about y 62.5 to 82.8 percent with no label or value. Capex is a stacked column: a light steel-blue top segment (about y 36.9 to 42.0 percent, estimated) labelled Guidance: $16—19 in red above it, two small red diamond markers at about y 36.9 and 40.9 percent at x 42 percent, a white gap, then a dark blue block from about y 44.0 to 62.5 percent split at about y 57.6 percent, with the white text Flexible on the top band (partly hidden) and Less flexible in the middle of the dark block at about y 51.2 percent. No legend. Highlighted points are the two red diamond markers. Bullets use a solid red round bullet at level one and a red en dash at level two. Not cropped, no photographs or logos.
Slide 22
CLIMATE STRATEGY
Responsibly meeting society’s evolving need for energy in a reliable and sustainable manner
MITIGATING EMISSIONS IN COMPANY OPERATIONS
• Achieved 2020 emission reduction goals
• Set 2025 GHG emission-reduction plans consistent with goals of Paris Agreement1
• Aiming for industry-leading GHG performance by 2030
PROVIDING PRODUCTS TO HELP CUSTOMERS REDUCE THEIR EMISSIONS
• Natural gas
• Lightweight materials and packaging
• Advanced fuels and lubricants
PROACTIVELY ENGAGING ON CLIMATE-RELATED POLICY
• Support an economy-wide price on CO2 emissions
• Continue to engage in efforts to encourage sound and constructive policy solutions
DEVELOPING AND DEPLOYING SCALABLE TECHNOLOGY SOLUTIONS
• Created Low Carbon Solutions business to commercialize portfolio of low-carbon technologies
• Invested >$10 billion since 2000 in lower-emission solutions; additional $3 billion through 20252
See Supplemental Information for footnotes and definitions.
22
Visuals: Four white-outlined blue circular icon badges, each with a line-art white icon: (1) a factory with three stacks, sawtooth roof and three rectangular windows on the lower front, left column; (2) a side-view car in outline with two wheels, right column second; (3) a cloud with curling wind lines beneath it, third column; (4) a lightbulb with three radiating rays above and a screw base below, fourth column. Icons are white line drawings on #0C479D with no text. The white area near the car spans about x 32.1 to 44.0 and y 31.0 to 37.3 percent behind the car outline. No photographs, charts or tables.
Slide 23
SIGNIFICANT INVESTMENTS IN TARGETED MARKETS
Investment in carbon capture and storage proportionate to potential market size
EXXONMOBIL ENERGY INVESTMENT¹
Percent of total addressable market
3%
0%
CCS
Oil, natural gas, and chemicals
•
Carbon capture and storage is critical to achieve the goals of the Paris Agreement
•
Large investments in lower-carbon solutions relative to current market size
•
Lower-carbon investments expected to grow as markets evolve and expand
23
See Supplemental Information for footnotes.
Visuals: Vertical bar chart titled EXXONMOBIL ENERGY INVESTMENT¹ with subtitle Percent of total addressable market. Y-axis runs 0% to 3% with labels at 0% (baseline) and 3% only; no value labels are printed on the bars, so the bar heights are approximate. Bar 1, labelled CCS, is about 3.5% tall (estimate, reaching roughly the top of the plot area above the 3% tick). Bar 2, labelled Oil, natural gas, and chemicals, is about 0.25% tall (estimate). Both bars are solid blue #0C479D with no outline, sitting on a thin black horizontal baseline. No legend and no highlighted points. The bar pair measured bounding box spans x 12.7% to 42.5%.
Slide 24
POSITIONED TO SUCCEED IN CARBON CAPTURE
Leveraging position as global leader in critical technology required for net zero emissions
GLOBAL LEADERSHIP
ExxonMobil
40%
of all CO2
captured
since
19701
Remaining 48 companies
#1 in CO2 capture2
#2 for CO2 pipelines3
#2 for CO2 geologic storage4
SIGNIFICANT POTENTIAL GROWTH MARKET5
TOTAL CO2 CAPTURE
Million tonnes
2020
2030
2040
~$2 trillion addressable market
~35% projected growth per year
LEVERAGES COMPETITIVE ADVANTAGES AND CORE CAPABILITIES
Scale
Technology
Integration
Functional excellence
People
Subsurface and reservoir expertise
Large-scale project development and execution
Significant patent portfolio
See Supplemental Information for footnotes and definitions.
24
Visuals: Donut chart in the left upper panel: ring with two segments. A red #FE000C segment about 40% of the ring runs clockwise from 12 o'clock to about 4 o'clock, labelled ExxonMobil (label to the upper right of the ring). The remaining about 60% is pale blue-grey #B6C7E1 and labelled Remaining 48 companies below the ring. Centre text reads 40% of all CO2 captured since 1970 with footnote superscript 1. Ring is roughly circular, about 13% of slide width and 23% of slide height, stroke thickness about 3% of slide width; no axes. Bar chart in the right upper panel: title TOTAL CO2 CAPTURE, unit Million tonnes, categories 2020, 2030, 2040 along a horizontal baseline (thin dark line, about 46.5% from top, spanning about 67% to 91% of the slide width). Bars are navy #0C479D with square tops and no gridlines, no value labels, no y-axis and no legend. 2020 bar is very short, about 0.4% of slide height (about 0.3 of the 2030 height), 2030 bar about 3.7% of slide height (about 25% of the 2040 height), 2040 bar 14.6% of slide height and the tallest; no highlighted points. Values: 2020 about small, 2030 about 25% of the 2040 bar, 2040 reference bar; no printed values. Icon row in the lower panel: five navy #0C479D circles (opacity 0.85), each about 6.0% wide and 10.7% tall (ellipse), with white line/solid icons: Scale = globe with latitude and longitude lines; Technology = network of small circles connected by lines (node diagram with one filled centre node); Integration = chain link (two interlocked links); Functional excellence = three cogs/gears of differing sizes; People = group of three stylised people figures. Dotted vertical divider lines (grey) separate the three bottom descriptors at about 33% and 72% of slide width, spanning roughly 82.5% to 88.5% of slide height. Red bullet dots (#FE000C) mark each bullet in both upper panels.
Slide 25
HOUSTON CCS INNOVATION ZONE CONCEPT
Houston ship channel is an ideal location for a large-scale CCS project
Potential to mitigate 100 MILLION tonnes of CO2 annually by 2040 1
POTENTIAL SOURCES OF CO2
INDUSTRIAL / MANUFACTURING
POWER GENERATION
REFINING / CHEMICAL
OTHER SOURCES
CO2
CO2
CO2
CO2
HOUSTON SHIP CHANNEL
GULF OF MEXICO
OFFSHORE UNDERGROUND STORAGE FORMATIONS
Storage potential of ~500 BILLION tonnes; 2
~100 years of the total U.S. CO2 emissions 3
CRITICAL ENABLERS INCLUDE:
Supportive / regulatory and / legal framework
Broad industry and / government / alignment
$/CO2
Adequate financial / incentives
Public support
See Supplemental Information for footnotes.
25
Visuals: Photograph-style map illustration (1282 by 838 pixels) of the Houston ship channel and the Gulf of Mexico, placed as a boxed rectangle with square corners and no border, covering x 2.8 to 60.1%, y 23.3 to 89.9%. Grey land on the left and top, light blue water on the right and bottom, a dashed blue curve (about 2 pt) from the source cluster arcing down and right to the storage ellipse, and a rust-coloured outlined ellipse for offshore storage. Four circular CO2 markers (about 2.5% of slide width each) are grouped inside a grey translucent ellipse at the top-left of the map: a green, a blue, a purple and a red marker. Overlay text on the map is listed in the text field and elements. Right column: four blue circular icons (each about 5.6% of slide width) with white line-art glyphs: a stacked-layers icon (top-left), a network of connected nodes icon (top-right), a dollar sign over CO2 icon (bottom-left), and a group of three people icon (bottom-right). No photographs of people; no logos.
Slide 26
GROWING LONG-TERM SHAREHOLDER VALUE
Progressing actions to highgrade portfolio and improve earnings and cash flow
•Committed to delivering sustainable shareholder value
•Competitively advantaged assets and investments drive strong cash flow to sustain dividend, reduce debt, and invest in the future
•Significant structural cost savings and flexible Capex resilient to price cycles
•Focused on industry-leading safety, reliability, and environmental performance; executing plans to deliver aggressive 2025 emission reductions
•Strategy leverages experience and competitive advantages to deliver value while transitioning to a lower-carbon future, consistent with the goals of the Paris Agreement
26
See Supplemental Information for definitions.
Slide 27
Q&A
ExxonMobil
Visuals: Photograph of an industrial waterfront refinery complex viewed from above at an oblique angle. Subject: a wide river or channel in the foreground with a red-hulled tanker moored at left, a dark barge and tugboat beside it, and a small yellow cargo or chemical tanker with white superstructure sailing centre-right toward the viewer. Behind the water, dense rows of white and cream storage tanks, grey and rust-coloured tanks, pipe racks, and tall process towers and flare stacks stretch to the horizon. A white steam plume rises from a stack at centre-right. Upper half is a blue sky with scattered cumulus clouds. Lighting: bright daylight from the upper left, soft shadows. Dominant colours: sky blue #5A9BD5, white tanks, grey-brown water #5F6B73, rust orange tanker hull #D9552B, yellow ship #E8B81E, green vegetation at left edge. Composition: horizon near 45% of slide height, water occupying the lower half, the refinery filling the middle band. Not cropped, full-bleed, no overlay or tint. Small ExxonMobil logo in white in the lower right, placed as a separate image of 13% by 4.6% of slide width and height.
Slide 28
SECOND QUARTER 2021 OUTLOOK
DOWNSTREAM SCHEDULED MAINTENANCE QUARTERLY EARNINGS IMPACT 1
Million USD
600
300
0
2020 quarterly average
1Q21
2Q21 est.
CHEMICAL SCHEDULED MAINTENANCE QUARTERLY EARNINGS IMPACT 2
Million USD
200
100
0
2020 quarterly average
1Q21
2Q21 est.
1H21 scheduled maintenance positions
Downstream for continued market recovery
Higher planned turnaround activity in Chemical
See Supplemental Information for footnotes.
28
Visuals: Two vertical bar charts with black, thin, horizontal axis baselines and no gridlines, no legend, no printed data values. Chart 1: title DOWNSTREAM SCHEDULED MAINTENANCE QUARTERLY EARNINGS IMPACT with superscript 1, unit Million USD, y axis 0 to 600 with labels at 0, 300 and 600, categories 2020 quarterly average, 1Q21 and 2Q21 est. Series: solid blue bars, 2020 quarterly average about 175 to 180 million USD, 1Q21 about 350 million USD, 2Q21 est. no bar drawn. A black I-beam error-bar marker (vertical line with horizontal caps at top and bottom) stands above the 2Q21 est. category, spanning about 400 to 600 million USD on the axis. Chart 2: title CHEMICAL SCHEDULED MAINTENANCE QUARTERLY EARNINGS IMPACT with superscript 2, unit Million USD, y axis 0 to 200 with labels at 0, 100 and 200, same three categories. Series: blue bars, 2020 quarterly average about 44 million USD, 1Q21 about 42 million USD, 2Q21 est. no bar drawn. A black I-beam error-bar marker above 2Q21 est. spans about 95 to 136 million USD. No highlighted points. No photographs, logos or icons.
Slide 29
SUPPLEMENTAL INFORMATION
IDENTIFIED ITEMS RECONCILIATION / FOURTH QUARTER
2020
Earnings / (Loss) U.S. GAAP / (20.1)
Identified items included in earnings / (loss)
Noncash inventory valuation - lower of cost or market / -
Impairment / (19.3)
Tax and other items (asset management, severance) / (0.9)
Corporate total / (20.2)
Earnings/(Loss) excluding identified items / 0.1
29
Billions of dollars unless specified otherwise.
Due to rounding, numbers presented above may not add up precisely to the totals indicated.
Visuals: Table with two columns: a label column (x 2.8% to 66.5%) and a value column headed FOURTH QUARTER (x 66.5% to 97.3%). Header rows: row 1 reads IDENTIFIED ITEMS RECONCILIATION in the label column and FOURTH QUARTER in the value column; row 2 has an empty label cell and 2020 in the value column. Body rows: Earnings / (Loss) U.S. GAAP = (20.1); Identified items included in earnings / (loss) = blank section heading; Noncash inventory valuation - lower of cost or market = -; Impairment = (19.3); Tax and other items (asset management, severance) = (0.9); Corporate total = (20.2); Earnings/(Loss) excluding identified items = 0.1. A thin black rule sits above the value cell of the Corporate total row and above the Earnings excluding identified items row, and a rule sits under the Earnings U.S. GAAP value cell. No charts, photographs or logos.
Slide 30
SUPPLEMENTAL INFORMATION
“Winter storm” as used on slide 6 is included below as part of the “Downtime/Maintenance” category.
“Curtailments” as used on slide 6 includes government mandates shown as a separate category below.
UPSTREAM VOLUME FACTOR ANALYSIS1
1Q21 vs. 4Q20
1Q21 vs. 1Q20
Prior Period
3,689
4,046
Downtime / Maintenance
-22
-22
Growth / Decline
-18
-78
Entitlement / Divestments
-46
-69
Government mandates
62
-124
Demand / Other
122
34
Current Period
3,787
3,787
1
Koebd.
30
Visuals: Table: UPSTREAM VOLUME FACTOR ANALYSIS (superscript 1) with columns 1Q21 vs. 4Q20 and 1Q21 vs. 1Q20. Rows: Prior Period 3,689 | 4,046 (bold); Downtime / Maintenance -22 | -22; Growth / Decline -18 | -78; Entitlement / Divestments -46 | -69; Government mandates 62 | -124; Demand / Other 122 | 34; Current Period 3,787 | 3,787 (bold). Header row is a solid blue bar with white bold capitals; thin grey horizontal rules separate each row and a blue rule closes the bottom of the table. No chart, photograph, logo or icon.
Slide 31
SUPPLEMENTAL INFORMATION
RECONCILIATION OF OPERATING COSTS AND CASH OPERATING EXPENSES
COMPONENTS OF OPERATING COSTS / 1Q21 / 1Q20
From ExxonMobil’s Consolidated statement of income:
Production and manufacturing expenses / 8.1 / 8.3
Selling, general and administrative expenses / 2.4 / 2.6
Depreciation and depletion / 5.0 / 5.8
Exploration expenses, including dry holes / 0.2 / 0.3
Non-service pension and postretirement benefit expense / 0.4 / 0.3
Subtotal / 16.0 / 17.3
ExxonMobil’s share of equity company expenses / 2.1 / 2.5
Total operating costs / 18.2 / 19.7
CASH OPERATING EXPENSES (CASH OPEX)
Total operating costs / 18.2 / 19.7
Less:
Depreciation and depletion / 5.0 / 5.8
Non-service pension and postretirement benefit expense / 0.4 / 0.3
Other adjustments (includes equity company depreciation and depletion) / 0.7 / 1.0
Total cash operating expenses (cash Opex) / 12.1 / 12.6
Energy and production taxes / 2.9 / 2.4
Total cash operating expenses (cash Opex) excluding energy and production taxes / 9.2 / 10.2
Billions of dollars unless specified otherwise.
Due to rounding, numbers presented above may not add up precisely to the totals indicated.
31
Visuals: A reconciliation table with three numeric/label columns: label column (x 2.8% to 72%), column 1Q21 (x 72% to 83.6%), column 1Q20 (x 83.6% to 95.2%). Header row 'COMPONENTS OF OPERATING COSTS' with 1Q21 and 1Q20 in blue #0C479D. Rows: From ExxonMobil’s Consolidated statement of income: (no values); Production and manufacturing expenses 8.1 / 8.3; Selling, general and administrative expenses 2.4 / 2.6; Depreciation and depletion 5.0 / 5.8; Exploration expenses, including dry holes 0.2 / 0.3; Non-service pension and postretirement benefit expense 0.4 / 0.3; Subtotal 16.0 / 17.3 (grey band); ExxonMobil’s share of equity company expenses 2.1 / 2.5; Total operating costs 18.2 / 19.7 (grey band). Section header CASH OPERATING EXPENSES (CASH OPEX) in blue band with no values; Total operating costs 18.2 / 19.7 (grey band); Less: (no values); Depreciation and depletion 5.0 / 5.8; Non-service pension and postretirement benefit expense 0.4 / 0.3; Other adjustments (includes equity company depreciation and depletion) 0.7 / 1.0; Total cash operating expenses (cash Opex) 12.1 / 12.6 (grey band); Energy and production taxes 2.9 / 2.4; Total cash operating expenses (cash Opex) excluding energy and production taxes 9.2 / 10.2 (grey band with bottom rule). Thin black rules sit above subtotal and total rows in the numeric columns. No charts, photographs or logos.
Slide 32
SUPPLEMENTAL INFORMATION
Forward-looking statements contained in this presentation regarding the potential for future earnings, cash flow, addressable markets, available cash from operations, and free
cash are not forecasts of actual future results. These figures are provided to help quantify the potential future results and goals of currently-contemplated management plans
and objectives to impact future results as discussed in this presentation. These figures are intended to quantify for illustrative purposes management’s view of the potentials for
these efforts over the time periods shown. For all price point comparisons, unless otherwise indicated, we assume $50/bbl Brent crude prices. Unless otherwise specified, crude
prices are Brent prices. Except where noted, natural gas prices used are consistent with management’s internal price assumptions for the relevant natural gas markets relative to
the crude price for a given case. All crude and natural gas prices for future years are adjusted for inflation from 2021. These prices are not intended to reflect management’s
forecasts for future prices or the prices we use for internal planning purposes. We have assumed that other factors such as laws and regulations, including tax and environmental
laws, and fiscal regimes remain consistent with current conditions for the relevant periods. This presentation does not attempt to model potential COVID-19 outbreaks or
recoveries beyond historical pricing.
Non-GAAP and other measures. With respect to historical periods, reconciliation and other information is provided on pages 29 through 31 of this presentation and in the
Frequently Used Terms available on the Investor page of our website at www.exxonmobil.com under the heading News & Resources for certain terms used in this presentation
including operating cash flow. For future periods, we are unable to provide a reconciliation of forward-looking non-GAAP or other measures to the most comparable GAAP
financial measures because the information needed to reconcile these measures is dependent on future events, many of which are outside management’s control as described
above. Additionally, estimating such GAAP measures and providing a meaningful reconciliation consistent with our accounting policies for future periods is extremely difficult
and requires a level of precision that is unavailable for these future periods and cannot be accomplished without unreasonable effort. Forward-looking non-GAAP measures are
estimated in a manner consistent with the relevant definitions and assumptions noted above.
32
Slides 33 to 38 continue in the full text file.
Download this deck
The hosted PDF of every library deck is free for readers of the SlideDeck Co newsletter. Join with your email and the viewer and download appear here.
Preparing a results presentation or business update of your own? The SlideDeck Co Standard Deck is a slide library for business reviews, updates and plans.







