
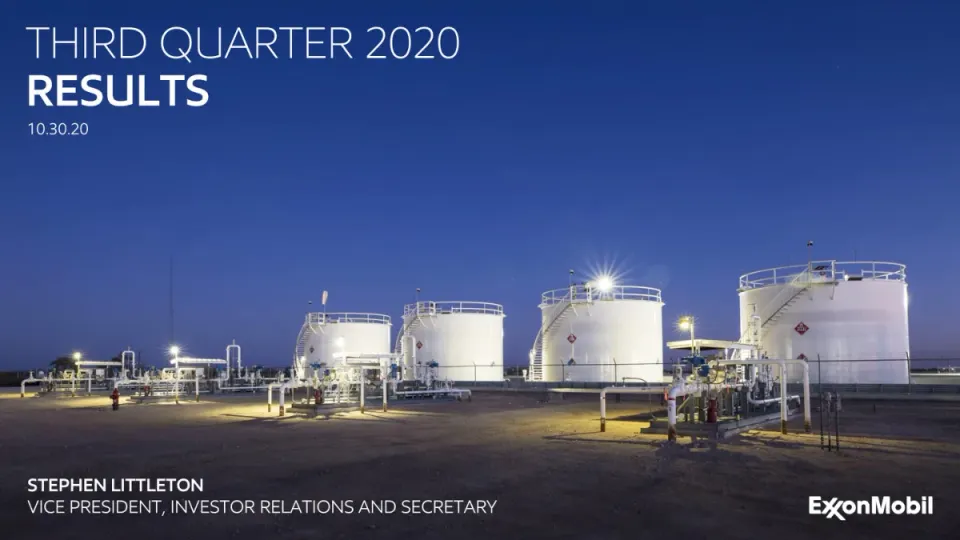
The deck opens with a title slide naming the presenter, Stephen Littleton, Vice President of Investor Relations, followed by a cautionary statement on forward-looking information. It then moves through a developments summary across the Upstream, Downstream, Chemical and Corporate segments. The results section compares third quarter 2020 with the second quarter and with the third quarter of 2019, using earnings bridges, volume bridges and short bullet lists for each business. Next come a cash profile and a fourth quarter outlook with maintenance impacts. A management perspectives section follows, covering liquids supply and demand, industry investment, margins, 2021 spending priorities, Guyana and Permian updates, and capital allocation priorities. The deck closes with a Q&A slide that points to the Investor Day in March 2021. Supplemental slides at the end give sources, definitions and footnotes. The slides worth studying are the waterfall bridges, which pair a bold headline with a single chart and three short points, and the segment comparison table on the results slide.
Slides worth studying
- Slide 5: The waterfall bridge pairs a red-and-green chart with three short bullets, so the financial change reads at a glance.
- Slide 4: The compact table lays out segment earnings and a short bullet column beside it, keeping the numbers and the explanation together.
- Slide 3: Four colored row blocks group developments by segment, each with one or two short lines of text.
Details
- Company: ExxonMobil
- Year: 2020
- Type: Investor presentation
- Industry: Oil and gas
- Pages: 37
The hosted copy of this deck is being prepared. Newsletter readers will find the download here.
Review score: 8 out of 10, Strong
Presentation quality, judged with the SlideDeck Co review heuristic. Ask, evidence and idea merit are not rated here.
The deck's strength is a strict, repeatable results grammar: every results title names the two periods being compared (slide 5 reads UPSTREAM 3Q20 VS. 2Q20), each segment gets one waterfall against the prior quarter and one against the prior year, and three or four bullets beside the chart explain the bars. Slide 4 walks from 2Q20 GAAP of (1.1) to 3Q20 GAAP of (0.7) by segment and shows the loss plainly, and slide 8 splits the fall from 3,899 to 3,672 Koebd into curtailments, divestments, entitlements, growth and decline, with the government mandate share shaded separately. Outlook is kept apart on slide 16, the management section starts behind its own divider on slide 17, and the footnotes on slides 35 and 36 are indexed by slide number. The bottleneck is the second half, where slides 23, 24 and 30 are bullet lists, slides 20 and 21 are the same chart twice with one added band, and slide 31 repeats slide 18 word for word.
Worth keeping: Keep the title convention that states the segment and the two periods, and the pairing of each waterfall with the bullets that explain its bars.
Most useful repair: Merge the duplicate chart on slides 20 and 21 into one, drop the repeated key messages on slide 31, and give slides 24 and 30 an exhibit that carries the numbers they cite, such as the Capex range of $16 to $19 billion.
What would change the score: If the repeated and text-only slides in the second half are builds and speaker prompts that worked in the live call, the remaining weakness is small; if the half-size pages I did not read at full size carry unlabeled charts, the score would fall to 7.
Confidence high. 37 of 37 pages inspected on contact sheets, 12 at readable size. Reviewed 2026-11-15. Model-assisted review (claude-fable-5-2, in session).
Full text of the slides (37 slides)
Every slide's words and a description of its charts and images, so the deck can be searched and rebuilt. Also available as Markdown.
Slide 1
THIRD QUARTER 2020 / RESULTS / 10.30.20 / STEPHEN LITTLETON / VICE PRESIDENT, INVESTOR RELATIONS AND SECRETARY / ExxonMobil
Visuals: Full-bleed night photograph of an oil and gas storage facility. Four large white cylindrical storage tanks stand in a row on a gravel yard, with white metal stair cases and safety railings on the top of the tanks. The two right-most tanks show red-and-white diamond hazard placards. Blue and white pipework, valves, and a red fire hydrant sit in the foreground and midground, with a fence line and a tall thin antenna mast at the far left. Several floodlights glow, including a starburst light on the third tank and warm yellow light on the gravel. Composition is wide and horizontal, with the tanks in the middle-right and the open ground in the lower third. Lighting is artificial night lighting against a dusk sky. Dominant colours are deep blue sky (about #1C3A9A at top shading to about #3D57B5 near the horizon), white tanks (about #E8EAF2), and warm tan gravel (about #8A6A4A). The photo is uncropped and full-bleed with no overlay or tint.
Slide 2
CAUTIONARY STATEMENT
•
Statements of future events or conditions in this presentation or the subsequent discussion period are forward-looking statements. Actual future results, including financial / and operating performance; demand growth and mix; the impacts of the COVID-19 pandemic and current industry oversupply conditions on ExxonMobil’s business and / results; price and margin recovery; planned capital and operating expense reductions and efficiencies; future cash flows, dividends, cash and debt balances, and capital / allocation; corporate and financing expenses; volume/production growth and mix; the total amount and mix of capital expenditures; resource recoveries; production rates; / rates of return; development costs; project plans, timing, costs, and capacities; drilling programs and improvements; product sales and mix; accounting and financial reporting / effects resulting from market developments and ExxonMobil’s responsive actions, including impairment charges resulting from changes in development plan strategy or / potential divestments; and the impact of technology, including impacts on capital efficiency, production and greenhouse gas emissions, could differ materially due to a / number of factors including global or regional changes in oil, gas, petrochemicals, or feedstock prices, differentials, or other market or economic conditions affecting the oil, / gas, and petrochemical industries and the demand for our products; the outcome of government policies and actions, including actions taken to address COVID-19 and to / maintain the functioning of national and global economies and markets; the severity, length and ultimate impact of COVID-19 on people and economies and the timing and / pace of regional and global economic recovery; the ability to access short- and long-term debt markets on a timely and affordable basis; the ability to realize efficiencies / within and across our business lines and to maintain cost reductions without impairing our competitive positioning; the impact of company actions to protect the health and / safety of employees, vendors, customers, and communities; reservoir performance; the outcome and timing of exploration and development projects; timely completion of / construction projects; war and other security disturbances, including shipping blockades or harassment; political factors including changes in local, national, or international / policies affecting our business; or changes in law or government regulation, including trade sanctions, tax and environmental regulations; the outcome of commercial / negotiations and impact of commercial terms; actions of competitors and commercial counterparties; actions of consumers; opportunities for and regulatory approval of / investments or divestments that may arise, including the ability to reach mutually acceptable pricing and other terms; the outcome of research efforts and the ability to bring / new technology to commercial scale on a cost-competitive basis; the development and competitiveness of alternative energy and emission reduction technologies; / unforeseen technical or operating difficulties; and other factors discussed here and in under Item 1A. Risk Factors of our Annual and Quarterly Reports filed with the U.S. / SEC. Statements regarding plans or expectations for 2021 also remain subject to completion of ExxonMobil’s annual corporate planning process and approval of the / resulting company plan by the Board of Directors, expected in November 2020. All forward-looking statements are based on management’s knowledge and reasonable / expectations at the time of this presentation and we assume no duty to update these statements as of any future date.
•
Forward-looking statements in this release regarding project timing, returns, and results; targeted capital spending and operating expense reductions; market strategies; capital / allocation; and other future plans, targets or key milestones refer to plans outlined in ExxonMobil’s press release dated April 7, 2020 and subsequent public disclosures including / our first and second quarter earnings press releases and conference calls on May 1 and July 31, 2020, respectively. Forward-looking statements contained in our March 5, 2020 / Investor Day materials were based on different plans and assumptions prior to the impacts of the COVID-19 pandemic and should not be relied upon to represent ExxonMobil’s future business plans or results of operations. Updates on spending and timing of certain projects have been provided, but are not meant to / represent a complete view of all plans and projects that could be impacted by the current pandemic, the government responses to the pandemic, or other market factors.
•
Reconciliations and definitions of non-GAAP measures and other terms are provided in the text or in the supplemental information accompanying these slides.
2
Slide 3
DEVELOPMENTS SINCE SECOND QUARTER 2020 / 3 / UPSTREAM / Liquids realizations increased significantly, offsetting lower gas realizations mainly due to LNG price lag / All economic curtailments back online; government-mandated curtailments of ~140 Koebd / Achieved best-ever safety performance despite pandemic challenges; best reliability since 2015 / Guyana: Payara FID achieved, with government approval of the development; two additional discoveries / DOWNSTREAM / Achieved best reliability, process and personnel safety performance in last 10 years / Refining margins decreased with continued excess industry capacity and high product inventories / CHEMICAL / Industry-leading safety performance; strong reliability underpinning growth and earnings / Sustained packaging and hygiene demand; improving automotive and construction markets / CORPORATE / Capital spending further reduced by >$1 billion (>20%) from 2Q20 / Signed agreement with Global Clean Energy Holdings to broaden distribution of renewable diesel / Expanded agreement with Global Thermostat to advance and scale direct air capture technology
Slide 4
RESULTS 3Q20 VS. 2Q20 / Liquids prices improved from 2Q lows / Higher volumes driven by demand recovery / Earnings benefit from reduced expenses across all businesses / $0.2 billion vs. 2Q20 / $1 billion vs. 3Q19 / Billions of dollars unless specified otherwise. / Due to rounding, numbers presented above may not add up precisely to the totals indicated. / 4 / U/S / D/S / CHEM / C&F / TOTAL / 2Q20 GAAP Earnings / (Loss) / (1.7) / 1.0 / 0.5 / (0.9) / (1.1) / Non-cash inventory valuation / 0.2 / 1.6 / 0.1 / - / 1.9 / 2Q20 Earnings / (Loss) ex. Identified Items / (1.9) / (0.6) / 0.4 / (0.9) / (3.0) / Price / margin / forex / 1.4 / - / (0.1) / - / 1.3 / Demand / volume / 0.1 / 0.3 / 0.2 / - / 0.7 / Other base business / - / 0.1 / - / 0.1 / 0.2 / 3Q20 Earnings / (Loss) ex. Identified Items / (0.4) / (0.2) / 0.5 / (0.7) / (0.8) / Non-cash inventory valuation / - / - / 0.1 / - / 0.1 / 3Q20 GAAP Earnings / (Loss) / (0.4) / (0.2) / 0.7 / (0.7) / (0.7) / Billions of dollars unless specified otherwise.
Visuals: Table: header row filled blue #0D47A1 with white bold capital labels U/S, D/S, CHEM, C&F and TOTAL in the value columns; the first column header is blank. Rows in order: 2Q20 GAAP Earnings / (Loss) with values (1.7), 1.0, 0.5, (0.9), (1.1) (bold); Non-cash inventory valuation 0.2, 1.6, 0.1, -, 1.9; 2Q20 Earnings / (Loss) ex. Identified Items (bold, light grey #D3D3D3 band) (1.9), (0.6), 0.4, (0.9), (3.0); Price / margin / forex 1.4, -, (0.1), -, 1.3; Demand / volume 0.1, 0.3, 0.2, -, 0.7; Other base business -, 0.1, -, 0.1, 0.2; 3Q20 Earnings / (Loss) ex. Identified Items (bold, light grey band) (0.4), (0.2), 0.5, (0.7), (0.8); Non-cash inventory valuation -, -, 0.1, -, 0.1; 3Q20 GAAP Earnings / (Loss) (0.4), (0.2), 0.7, (0.7), (0.7). Thin black horizontal rules sit above the 2Q20 ex. Identified Items row, above the 3Q20 GAAP Earnings row and below the final row, spanning the value columns. No chart, photograph, logo or icon.
Slide 5
UPSTREAM 3Q20 VS. 2Q20
CONTRIBUTING FACTORS TO CHANGE IN EARNINGS
Million USD
(1,864)
1,390
140
110
(150)
(372)
2Q20 ex. / Ident. Items
Price
Volume
Expenses
Tax / other
3Q20 ex. / Ident. Items
• Liquids realizations increased ~75%, gas realizations down ~10% mainly due to LNG price lag
• Higher volumes from curtailment recovery, sales timing and entitlements
• Lower expenses due to reduced activity and efficiencies, offset by unfavorable one-time tax items
5
Visuals: Vertical waterfall bar chart titled 'CONTRIBUTING FACTORS TO CHANGE IN EARNINGS' with subtitle 'Million USD'. No value axis, gridlines or tick labels are printed. A thin black horizontal baseline runs across the top of the chart at about y 28.5%. Six bars, left to right: (1) '2Q20 ex. Ident. Items' blue bar hanging down from the baseline to about 80% of the height, labelled (1,864) below it in bold black; (2) 'Price' green bar floating from about 41.8% to 80% of slide height, labelled 1,390 in white centred inside the bar; (3) 'Volume' small green bar labelled 140 in white centred inside; (4) 'Expenses' small green bar labelled 110 in white centred inside; (5) 'Tax / other' small red bar labelled (150) in white centred inside; (6) '3Q20 ex. Ident. Items' blue bar hanging from the baseline, labelled (372) in bold black below it. Blue is #0B4A9E, green #00A24E, red #C00000. No legend. No points are highlighted beyond the colour coding of increase (green), decrease (red) and totals (blue).
Slide 6
UPSTREAM 3Q20 VS. 3Q19 / CONTRIBUTING FACTORS TO CHANGE IN EARNINGS / Million USD / 2,168 / (2,630) / (60) / 500 / (350) / (372) / 3Q19 ex. / Ident. Items / Price / Volume / Expenses / Tax / other / 3Q20 ex. / Ident. Items / • Liquids realizations decreased ~30%, gas / realizations down ~40% / • Higher entitlements and volume growth more than / offset by curtailments and divestments / • Lower production and exploration expenses partly / offset by one-time tax items / 6
Visuals: Waterfall chart titled 'CONTRIBUTING FACTORS TO CHANGE IN EARNINGS', unit 'Million USD'. No y-axis, gridlines or legend are drawn. A thin black horizontal baseline runs across the chart at about 71.5% of slide height, from about 3% to 50% across. Six bars, left to right: (1) '3Q19 ex. Ident. Items' blue total bar, value 2,168 printed in bold above it, spanning about 4.6-9.0% across and rising from the baseline to about 30% down. (2) 'Price' dark red bar, value (2,630) printed in white inside it, spanning about 12.5-16.9% across and running from about 30% down to about 80% down. (3) 'Volume' thin dark red bar, value (60) printed below it, about 20.4-24.7% across, sitting just under the baseline. (4) 'Expenses' green bar, value 500 printed in white inside it, about 28.3-32.6% across, hanging below the baseline. (5) 'Tax / other' dark red bar, value (350) printed in white inside it, about 36.1-40.4% across, hanging below the baseline. (6) '3Q20 ex. Ident. Items' blue total bar, value (372) printed in bold below it, about 44.0-48.3% across, hanging from the baseline to about 79% down. Category labels sit in two-line centred captions under each bar at about 87-89% down. Values are all printed, so no estimates are needed. No highlighted points beyond the colour coding of bars: blue for totals, red for negatives, green for the positive expense item. Flat rendering, no shadows or 3D.
Slide 7
UPSTREAM VOLUMES 3Q20 VS. 2Q20 / CONTRIBUTING FACTORS TO CHANGE IN VOLUMES / Koebd / 3,638 / (20) / 160 / 50 / Kearl / diluent / outage / Other / (90) / (70) / 3,672 / 2Q20 / Govt / mandated / curtailments / Economic / curtail- / ments / Projects / growth1 / Downtime / / maintenance / Decline / / other / 3Q20 / • Government-mandated curtailments through / quarter (~140 Koebd) / • Recovery of economic curtailments in / unconventional and heavy oil / • Volume growth driven by Permian / • Kearl scheduled maintenance and third party / diluent supply outage / • Decline partially offset by higher entitlements / 7 / 1See Supplemental Information.
Visuals: Waterfall chart titled CONTRIBUTING FACTORS TO CHANGE IN VOLUMES with unit subtitle Koebd (thousand oil-equivalent barrels per day). No value axis or scale is printed; bar heights are proportional to the labelled values. Categories left to right: 2Q20 total bar 3,638 (blue, from baseline); Govt mandated curtailments (20) (red, floating down); Economic curtailments 160 (green, floating up); Projects growth1 50 (green, floating up); Downtime / maintenance split into two stacked red segments, a light red top segment labelled Kearl diluent outage and a dark red lower segment labelled Other, with the combined total (90) printed below; Decline / other (70) (dark red, floating down); 3Q20 total bar 3,672 (blue, from baseline). The 2Q20 and 3Q20 total bars carry white double diagonal break marks near their lower third. Category labels sit below a thin black horizontal baseline. No legend. No highlighted points beyond the colour coding of increases (green), decreases (red) and totals (blue).
Slide 8
UPSTREAM VOLUMES 3Q20 VS. 3Q19
CONTRIBUTING FACTORS TO CHANGE IN VOLUMES
Koebd
3,899
Govt
mandate
(185)
Liquids
Gas
(155)
150
150
(185)
3,672
3Q19
Curtail-
ments
Divestments
Entitle-
ments
Projects
growth1
Decline
/ other
3Q20
1 See Supplemental Information.
8
•
Government-mandated and economic curtailments in unconventional and heavy-oil
•
Divestments driven by Norway sale
•
Growth in Permian, Abu Dhabi and Guyana
•
Decline and lower Netherlands production partly offset by higher entitlements
Visuals: Waterfall bar chart titled 'CONTRIBUTING FACTORS TO CHANGE IN VOLUMES', unit label 'Koebd' (thousand oil-equivalent barrels per day), no printed axis scale or range; values are printed on bars. Bars left to right: 3Q19 total blue bar 3,899 with axis break marks; Curtailments floating bar (185) with top segment dark red and lower segment salmon labelled 'Govt mandate'; Divestments floating bar (155) stacked dark red 'Liquids' over salmon 'Gas'; Entitlements green bar 150; Projects growth (footnote 1) green bar 150; Decline / other dark red bar (185); 3Q20 total blue bar 3,672 with axis break marks. Series colours: totals #0F4C9A-style blue, decreases red #C00000 and salmon #FF7F7F, increases green #00A050. No legend. Baseline is a thin black horizontal line under the bars. No highlighted points.
Slide 9
DOWNSTREAM 3Q20 VS. 2Q20
CONTRIBUTING FACTORS TO CHANGE IN EARNINGS
Million USD
(618)
70
300
60
(60)
(240)
2Q20 ex. / Ident. Items
Margin
Demand
Expenses
Forex / other
3Q20 ex. / Ident. Items
•
Favorable trading, optimization, price/timing, and marketing more than offset $470 million decrease from record low refinery margins
•
Significant demand recovery for transportation fuels and lubricants
•
Captured savings from maintenance and turnaround efficiencies, reduced contractors, and logistics optimization
9
Visuals: Chart: waterfall (bridge) chart titled CONTRIBUTING FACTORS TO CHANGE IN EARNINGS, units Million USD, no visible value axis or gridlines, a single thin black horizontal baseline at about 39.6% of slide height spanning the chart width. Series, left to right: 2Q20 ex. Ident. Items total bar, value (618), solid blue bar hanging from the baseline down to about 82% of slide height; Margin increase bar, value 70, green, floating; Demand increase bar, value 300, green, floating; Expenses increase bar, value 60, green, floating; Forex / other decrease bar, value (60), red, floating; 3Q20 ex. Ident. Items total bar, value (240), solid blue, hanging from the baseline. Value labels: white text inside the green bars (70, 300, 60) and inside the red bar (60) in white parentheses, black bold text below the blue bars for (618) and (240). Category labels in black Calibri below the bars. No legend. No highlighted points beyond the colour coding of increase (green), decrease (red) and totals (blue). Bullets are the only other visual, a small red dot per bullet.
Slide 10
DOWNSTREAM 3Q20 VS. 3Q19
CONTRIBUTING FACTORS TO CHANGE IN EARNINGS
Million USD
1,230
(1,880)
(80)
360
130
(240)
3Q19 ex. Ident. Items
Margin
Demand
Expenses
Tax / other
3Q20 ex. Ident. Items
• Favorable trading, optimization, and marketing of ~$400 million partially offset $2.3 billion decrease from refinery margins
• Reduced demand with COVID-19 impacts
• Lower expenses resulting from value chain approach and lower maintenance / turnaround
• Improved reliability, refinery optimizations, and favorable tax items increased earnings by $130 million
10
Visuals: Chart: waterfall bar chart titled CONTRIBUTING FACTORS TO CHANGE IN EARNINGS, with units Million USD. No y-axis or gridlines are drawn. A black horizontal baseline runs across the chart at about y 62%, from x 3% to 50%, 0.1% thick. Six bars, left to right: (1) 3Q19 ex. Ident. Items, blue #0D47A1 bar, value 1,230, rising from the baseline to about y 29%. (2) Margin, red #C00000 bar, value (1,880), hanging from the baseline down to about y 79.6%; label (1,880) in white inside the bar. (3) Demand, red #C00000 bar, value (80), small bar below the baseline at about y 79.6% to 81.6%; label (80) in white inside. (4) Expenses, green #00A050 bar, value 360, floating from about y 72% to 81.6%; label 360 in white inside. (5) Tax / other, green #00A050 bar, value 130, floating from about y 68.5% to 72%; label 130 in white inside. (6) 3Q20 ex. Ident. Items, blue #0D47A1 bar, value (240), hanging below the baseline from about y 62% to 68.4%; label (240) in black below the bar. Category labels sit under each bar in black, centred, in two lines for the first and last bars. No legend. No highlighted points. Bars are flat, with no shadows or gradients.
Slide 11
CHEMICAL 3Q20 VS. 2Q20 / CONTRIBUTING FACTORS TO CHANGE IN EARNINGS / Million USD / 352 / (80) / 220 / 40 / 10 / 546 / 2Q20 ex. Ident. Items / Margin / Volume / Expenses / Forex / other / 3Q20 ex. Ident. Items / Margins impacted by higher feed costs / Record polyethylene sales in 3Q / Recovering demand from automotive and construction markets / Continuing to capture savings through supply chain improvements, reduced contractor spend and pacing of activity / 11
Visuals: Waterfall bar chart titled CONTRIBUTING FACTORS TO CHANGE IN EARNINGS, with units Million USD printed beneath the title. No axis scale, gridlines or axis tick values are printed; values are labelled on each bar. Six bars left to right: 2Q20 ex. Ident. Items = 352 (blue, total bar, value printed above); Margin = (80) (red, floating down, value inside bar in white); Volume = 220 (green, floating up, value inside bar in white); Expenses = 40 (green, floating up, value inside bar in white); Forex / other = 10 (green, thin floating bar, value printed above in dark grey); 3Q20 ex. Ident. Items = 546 (blue, total bar, value printed above in bold). Bars are drawn on a shared baseline with a thin black horizontal axis line beneath them. Approximate bar tops: 352 bar top near 27% of slide height, 546 bar top near 26%, baseline near 85%. No legend. No highlighted points beyond the colour coding of increases (green), decrease (red) and totals (blue). Category labels sit below the baseline in black sans-serif, two-line for the first and last bars.
Slide 12
CHEMICAL 3Q20 VS. 3Q19
CONTRIBUTING FACTORS TO CHANGE IN EARNINGS
Million USD
241
70
30
170
40
546
3Q19 ex. Ident. Items
Margin
Volume
Expenses
Forex / other
3Q20 ex. Ident. Items
Margins benefited from lower feed costs
Higher volumes on strong reliability
Delivering aggressive cost reduction through supply chain efficiencies, contractor management, and pacing of activity
12
Visuals: Waterfall (bridge) column chart titled CONTRIBUTING FACTORS TO CHANGE IN EARNINGS with unit line Million USD. Six columns left to right: 3Q19 ex. Ident. Items = 241 (blue total bar, value label above in bold black); Margin = +70 (green floating bar, label 70 inside in white); Volume = +30 (green floating bar, label 30 inside in white); Expenses = +170 (green floating bar, label 170 inside in white); Forex / other = +40 (green floating bar, label 40 inside in white); 3Q20 ex. Ident. Items = 546 (blue total bar, value label above in bold black). Values are printed, so no estimates are needed. No value axis, gridlines or tick marks are shown; a thin black horizontal baseline sits under the columns. Each floating bar starts where the previous bar ended, rising from 241 to about 546 across the chart. Highlighted points: none beyond the colour split between blue totals and green increments. Legend: none. Bar heights are proportional to the printed values relative to the 241 and 546 totals.
Slide 13
DRIVING OPEX EFFICIENCIES
CASH OPERATING COSTS
Billion USD
15
10
5
0
3Q’19
//
1Q’20
2Q’20
3Q’20
Energy,
production taxes,
turnarounds /
maintenance
See Supplemental Information.
13
• On track to exceed reduction target
– Maintaining safety and operations integrity spend
– Cash operating costs reduced ~20% vs. 3Q19
• Reorganizations driving structural improvements
– Optimizing supply chain, logistics, and execution
– Reduced workforce
– Work process simplification
• Optimizing maintenance spend
Visuals: Stacked column chart. Title: CASH OPERATING COSTS (bold), subtitle Billion USD. Y-axis: Billion USD, linear, range 0 to 15, labelled ticks at 0, 5, 10, 15 (gridlines none). X-axis categories: 3Q’19, 1Q’20, 2Q’20, 3Q’20, with a break mark // between 3Q’19 and 1Q’20. Series, bottom dark segment (unlabelled): about 8.7 for 3Q’19, about 8.3 for 1Q’20, about 7.4 for 2Q’20, about 7.5 for 3Q’20. Series, top light segment labelled Energy, production taxes, turnarounds / maintenance: about 3.2 for 3Q’19 (top about 11.9), about 2.9 for 1Q’20 (top about 11.2), about 2.2 for 2Q’20 (top about 9.6), about 2.3 for 3Q’20 (top about 9.8). Values are estimates; the slide prints no values. Legend: none; the light segment is identified by a direct label beside the 3Q’20 bar. No highlighted points. Bar width about 7.3% of slide width, bars evenly spaced; baseline is a thin dark grey horizontal line at 0.
Slide 14
DRIVING CAPEX EFFICIENCIES
CAPEX
Billion USD
10
5
0
3Q19
1Q20
2Q20
3Q20
On track to exceed reduction for capital spending
Year-to-date Capex of ~$17 billion
Reducing Capex through pacing of short-cycle unconventional, exploration activity, and Downstream / Chemical projects
Leveraging market environment to offset deferral costs
14
Visuals: Chart: vertical bar chart, untitled apart from its label CAPEX, with unit Billion USD. Y-axis runs from 0 to 10 with labelled ticks at 0, 5 and 10 (no gridlines). X-axis categories are 3Q19, 1Q20, 2Q20 and 3Q20, with a break marker (//) on the axis between 3Q19 and 1Q20. Single series, values not printed on the slide; estimates: 3Q19 about 7.7, 1Q20 about 7.1, 2Q20 about 5.3, 3Q20 about 4.1. Bars 1 to 3 are mid grey; the 3Q20 bar is highlighted in cobalt blue. No legend. Bullets: red round bullet points with a red dash sub-bullet. No photographs, logos or icons.
Slide 15
THIRD QUARTER 2020 CASH PROFILE
3Q20 / 2Q20
Beginning Cash / 12.6 / 11.4
Earnings / (Loss) / (0.7) / (1.1)
Depreciation / 5.0 / 4.9
Non-cash Inventory Adjustment1 / (0.1) / (2.1)
Working Capital / Other / 0.2 / (1.8)
Cash Flow from Operating Activities / 4.4 / 0.0
Proceeds Associated with Asset Sales / 0.1 / 0.0
Cash Flow from Operations and Asset Sales / 4.5 / 0.0
Shareholder Distributions / (3.7) / (3.7)
PP&E Adds / Investments and Advances2 / (3.8) / (5.1)
Debt / Other Financing / (0.7) / 10.0
Ending Cash / 8.8 / 12.6
Ending Debt3 / 68.8 / 69.5
• Improved cash flow from operations of $4.4 billion
• Working capital benefit from inventory draws
• Capital spending down with investment pacing
• Debt levels consistent with plans
Billions of USD. Due to rounding, numbers presented above may not add up precisely to the totals indicated.
1,2,3 See Supplemental Information.
15
Visuals: Table with three columns: row label, 3Q20, 2Q20. Header row shows 3Q20 and 2Q20 in bold black with no fill. Rows, in order with values as printed: Beginning Cash 12.6 / 11.4 (bold, dark blue band); Earnings / (Loss) (0.7) / (1.1) (white row); Depreciation 5.0 / 4.9 (light blue-grey band); Non-cash Inventory Adjustment1 (0.1) / (2.1) (white); Working Capital / Other 0.2 / (1.8) (light band); Cash Flow from Operating Activities 4.4 / 0.0 (bold, dark blue band); Proceeds Associated with Asset Sales 0.1 / 0.0 (white, indented); Cash Flow from Operations and Asset Sales 4.5 / 0.0 (bold, dark blue band); Shareholder Distributions (3.7) / (3.7) (light band); PP&E Adds / Investments and Advances2 (3.8) / (5.1) (white); Debt / Other Financing (0.7) / 10.0 (light band); Ending Cash 8.8 / 12.6 (bold, dark blue band); Ending Debt3 68.8 / 69.5 (bold, dark blue band). Bold rows are white text on dark blue #0B4DA0 bands; body rows alternate white #FFFFFF and pale blue #D9E2F3 with black text. No chart, photo, or logo.
Slide 16
FOURTH QUARTER 2020 OUTLOOK / UPSTREAM / Announced government-mandated curtailments averaging ~220 Koebd compared to ~140 Koebd in 3Q / Production in line with 3Q; curtailments offsetting seasonal higher European gas demand / DOWNSTREAM / Demand levels consistent with 3Q / Scheduled maintenance higher than 3Q / CHEMICAL / Increased industry supply from capacity additions and improved utilization / Scheduled maintenance in line with 3Q / CORPORATE / Corporate and financing expenses expected to be ~$900 million / Capex increase with project milestone payments; full year 2020 below target / 16
Visuals: None apart from graphic blocks: four solid blue label rectangles (UPSTREAM, DOWNSTREAM, CHEMICAL, CORPORATE) and four thin blue horizontal rules, one above each band. No charts, photographs, illustrations, logos or icons.
Slide 17
MANAGEMENT
PERSPECTIVES
ANDREW SWIGER
SENIOR VICE PRESIDENT
JACK WILLIAMS
SENIOR VICE PRESIDENT
ExxonMobil
Visuals: One photograph, full-bleed: a petrochemical or refinery complex at dusk. Tall cylindrical distillation columns with ring platforms and ladders stand in a row, the tallest at the far right edge and a shorter pair at centre. They are lit amber and orange by many lamps, with dense pipe racks, steel structures and a pipe bridge in the foreground right. Left of centre, a dark road with a guardrail and light trails runs across the bottom, and a dark tree line sits at the far left. The sky is a deep blue twilight with streaked clouds, brightest near the horizon at left. Lighting is low-angle dusk with warm artificial light against the cool blue sky. Dominant colours are deep blue #2B4C7E and amber #E8A33D, with near-black #1A1F2B in the foreground. The photo is not cropped and has no tint or overlay. Also one logo: the ExxonMobil wordmark in white at bottom right, with the red X swoosh crossing the letters.
Slide 18
KEY MESSAGES
Record safety and operations performance despite challenging conditions
On track to exceed reduction targets for 2020 Capex and Opex
Aggressively reducing costs while maintaining operations integrity
Efficiently pacing investments while preserving long-term value
18
Visuals: Two thin horizontal blue rules spanning nearly the full width, one above and one below the bullet list. No photographs, charts, tables, logos or icons. The background image covers the full slide and is plain white.
Slide 19
LIQUIDS SUPPLY/DEMAND BALANCE RECOVERING
LIQUIDS SUPPLY / DEMAND¹
Millions of barrels per day
Range of 3P estimates
IEA demand
IEA supply
100
85
70
2019
2020
2021
2022
• 3Q20 demand increased ~13% versus 2Q20
• 3Q20 supply decreased by ~1% versus 2Q20
• 3Q20 inventory levels decreased by ~200 million barrels
• Expect continuing recovery in demand
¹ See Supplemental Information.
19
Visuals: One line chart titled 'LIQUIDS SUPPLY / DEMAND¹' with subtitle 'Millions of barrels per day'. Y axis: millions of barrels per day, labelled ticks 70 (bottom), 85 (middle) and 100 (upper), with the axis top about 103 (estimated) and bottom 70; the labelled ticks are the only printed values. X axis: years 2019, 2020, 2021, 2022 at evenly marked positions along a thin black baseline (no printed values between ticks). Series 1, 'IEA supply', solid red line (#E30613), rising slightly from about 100 in early 2019 with small wiggles, falling sharply in early 2020 to a trough of about 88 (estimated) around mid-2020, then rising to about 92 (estimated) at its last plotted point in late 2020. Series 2, 'IEA demand', solid blue line (#0070C0), tracking near 98 to 101 (estimated) through 2019, falling steeply in early-mid 2020 to a low of about 78 (estimated) around Q2 2020, then recovering to about 88 (estimated) by late 2020 where it becomes a dashed blue projection line climbing to about 100 (estimated) by end 2022. Series 3, shaded band labelled 'Range of 3P estimates', filled light steel blue (#B4C7E7) with about 60% opacity, spanning from the end of the demand line in late 2020 to the right edge at 2022, with upper edge rising from about 92 to about 103 (estimated) and lower edge from about 88 to about 98 (estimated). Legend: no separate legend box; series are identified by direct labels 'IEA supply' in red beside the red line, 'IEA demand' in blue beside the dashed projection, and 'Range of 3P estimates' in grey-blue above the band. No highlighted data points. No photographs, logos or icons.
Slide 20
INDUSTRY INVESTMENT DOWN
UPSTREAM OIL INVESTMENT1
Billion USD
BRENT2
$/bbl, adjusted to 2020
500
160
Brent
250
80
Unconventional
Conventional / Other
0
0
2000
2005
2010
2015
2020
2025
• Investment responds to price signals
• Five year decline in supply-development spend
– Shift to short-cycle unconventional
– Significant further reduction with pandemic
– Exploration at multi-decade lows
• Underlying production decline continues
1,2 See Supplemental Information.
20
Visuals: Chart: stacked area chart with a red line overlay. Title: none printed on the chart itself; headers read UPSTREAM OIL INVESTMENT1, Billion USD (left axis, 0 to 500) and BRENT2, $/bbl, adjusted to 2020 (right axis, 0 to 160). X axis years 2000 to 2025 with labels at 2000, 2005, 2010, 2015, 2020, 2025; the baseline runs from 2000 to about 2021. Left axis ticks 0, 250, 500; right axis ticks 0, 80, 160. Series: Conventional / Other, light blue area (about #B4C7E7) rising from about 120 billion USD in 2000 to a peak of about 300 billion in 2014 and falling to about 0 by 2021; Unconventional, mid blue area (about #7F9CCB) lying above conventional, peaking near 2014 at about 370 billion USD and dropping sharply around 2015 to 2020, with a small tail to about 2021. Brent: red line (about #E8001C), labelled 'Brent' in red, starting near 2000 at about 45 dollars per barrel on the right scale, dipping to about 35 in 2002, rising to a spike near 2008 at about 105, dropping to about 40 in 2009, peaking near 2011 at about 125, falling to about 45 in 2015, about 30 in 2016, about 55 in 2018, and ending at about 40 in 2020. Legend: none; series are identified by direct labels. Highlighted points: none marked beyond the red Brent line and the red word 'Other' in the label. Values are estimates marked about, as the slide prints no data values.
Slide 21
INDUSTRY INVESTMENT DOWN / Investment responds to price signals / Five year decline in supply-development spend / Shift to short-cycle unconventional / Significant further reduction with pandemic / Exploration at multi-decade lows / Underlying production decline continues / Future demand requires significant industry investment / Limited industry financial capacity / Price signal required / UPSTREAM OIL INVESTMENT1 / Billion USD / BRENT2 / $/bbl, adjusted to 2020 / 500 / 160 / 250 / 80 / 0 / 0 / Brent / Unconventional / Conventional / Other / 3P est. investment / to meet demand / 2000 / 2005 / 2010 / 2015 / 2020 / 2025 / 1,2 See Supplemental Information. / 21
Visuals: Chart: stacked area chart with a line overlay, titled UPSTREAM OIL INVESTMENT (superscript 1) in Billion USD on the left axis (0 to 500, tick labels 0, 250, 500), and BRENT (superscript 2) in $/bbl, adjusted to 2020 on the right axis (0 to 160, tick labels 0, 80, 160). X-axis runs 2000 to 2025 with labels every five years (2000, 2005, 2010, 2015, 2020, 2025). Series 1, Conventional / Other: light blue #B4C7E7 filled area from 2000 to about 2021, about 110 to 300 Billion USD in the early years, rising to a peak near 2014 and falling to zero by about 2021. Series 2, Unconventional: mid blue #7F9CCB band stacked above Conventional, peaking near 2014 and declining to about 2019. Series 3, 3P est. investment to meet demand: salmon-pink #FF9999 band from about 2019 to 2025, opening upward to about 400 to 450 Billion USD by 2023 to 2025 with a dip near 2020. Series 4, Brent: red #E00000 line, about 45 $/bbl in 2000, about 38 in 2001 and 2002, about 116 in 2008, about 128 in 2011, about 108 in 2014, about 46 in 2016, about 73 in 2018, and about 41 in 2020; the line ends at 2020. Legend: none, series are labelled directly on the chart with the labels Brent in red, Unconventional in black, Conventional / Other with Other in red, and 3P est. investment to meet demand in black bold. No highlighted points.
Slide 22
MARGIN ENVIRONMENT
NET INDUSTRY REFINING MARGIN1
%, indexed to 2000
200
0
-200
2000
2010
2020
Refining margins at historic lows
Driving increased rationalizations
Chemical margins near bottom of cycle
Increasing number of project deferrals and cancellations
Industry supply / capacity reductions expected to improve margins
CHEMICAL POLYETHYLENE MARGIN2
%, indexed to 2000
200
0
-200
2000
2010
2020
1,2 See Supplemental Information.
22
Visuals: Two line charts, both in the same style. Chart 1: line chart titled NET INDUSTRY REFINING MARGIN (superscript 1), subtitle '%, indexed to 2000'. Y axis labelled 200, 0 and -200 (unitless index, % indexed to 2000, range -200 to 200), X axis labelled 2000, 2010 and 2020 (years, annual points 2000 to 2020). Single series in blue, values about: 2000 0; 2001 -5; 2002 -120; 2003 -50; 2004 60; 2005 150; 2006 115; 2007 140; 2008 75; 2009 -120; 2010 -30; 2011 0; 2012 75; 2013 -10; 2014 5; 2015 80; 2016 -5; 2017 40; 2018 5; 2019 -75; 2020 -180 (all values about, as no values are printed). A black horizontal zero line crosses the plot at 0. No legend; no highlighted points. Chart 2: line chart titled CHEMICAL POLYETHYLENE MARGIN (superscript 2), subtitle '%, indexed to 2000'. Y axis labelled 200, 0 and -200 (range -200 to 200), X axis labelled 2000, 2010 and 2020 (annual points 2000 to 2020). Single blue series, values about: 2000 0; 2001 -30; 2002 -20; 2003 5; 2004 120; 2005 90; 2006 110; 2007 55; 2008 10; 2009 15; 2010 5; 2011 -35; 2012 -60; 2013 -20; 2014 25; 2015 95; 2016 120; 2017 110; 2018 55; 2019 -20; 2020 20 (all values about). Black zero line across the plot. No legend or highlighted points. No photographs, logos or icons.
Slide 23
LOOKING TO 2021
Manage near-term constraints while positioning for recovery
Maintain record safety and operational performance
Sustain Opex reductions and advance further structural efficiencies
Continue to pace capital spending while preserving value
Expect 2021 Capex of $16 – $19 billion
Increase emphasis on highgrading asset portfolio
Maintain capital allocation priorities
23
Slide 24
DRIVING REDUCTION IN SPEND
Reorganizations allow step-change in efficiency and improved responsiveness
Better line-of-sight to work process improvements
Work to date delivering ~15% workforce¹ reduction
Optimizing spend while maintaining safety and operational integrity
Driving cost reductions in maintenance, logistics, and supply chain
Global projects organization optimizing project execution pace and spend
Managing execution of corporate project portfolio improves prioritization, coordination, and optimization
Single interface with contractor community
Leveraging portfolio scale and diversity to maintain optionality and position for market recovery
¹ See Supplemental Information.
24
Slide 25
PRIORITIZING HIGHEST VALUE INVESTMENTS
UPSTREAM
DOWNSTREAM /
CHEMICAL
Progressing Guyana developments; >750 Kbd by 2026
Bacalhau on schedule
Maintaining exploration activities in Guyana and Brazil
Pacing short-cycle Permian growth
Optimizing pace of PNG and Mozambique LNG developments with stakeholders
Progressing steam cracker projects in China and Texas
Corpus Christi cracker under budget and ahead of schedule
Startup timing of remaining Downstream and Chemical projects paced 1-3 years
25
Visuals: Two photographs, both boxed as plain rectangles with square corners and no overlay or tint, not cropped. Left photograph: a floating production vessel (FPSO) on open deep-blue ocean under a pale blue sky with scattered white cumulus clouds, a small supply boat at the right horizon. The hull is orange and red-striped with a yellow-and-grey topside of process modules, a flare boom and a green helideck at the stern; it is shown in three-quarter aerial view, full daylight, dominant colours blue, orange, yellow and green. Right photograph: a wide-angle view of a steam cracker construction site under a hazy pale blue sky, with a large pale cylindrical tank on the left, rows of blue-capped equipment on a steel frame in the centre, a white crane boom and tall red-grey pipe racks and columns to the right, pipelines on the ground, and a white guard rail along the left edge; dominant colours grey, white, blue and rust red, flat daylight. Two header boxes: UPSTREAM is a solid red rectangle with white bold capitals; DOWNSTREAM / CHEMICAL is a solid royal blue rectangle with white bold capitals on two lines. Red bullet dots are used throughout.
Slide 26
GUYANA UPDATE / Discovered resources approaching 9 Boeb / 18th discovery at Redtail-1 / Additional discoveries at Yellowtail-2 / Liza Phase 2 on schedule for 2022 start-up / Completed Payara FID / ~600 Mbo1 development / 220 Kbd capacity / On-line 2024 / Cost of supply < $40/bbl2 / 1,2 See Supplemental information. / 26 / Atlantic Ocean / GUYANA / BRAZIL / KAIETEUR / STABROEK / CANJE / Payara / Liza / Yellowtail / Redtail / Georgetown / 275 MILES / SURINAME / Atlantic Ocean
Visuals: Map illustration occupying the lower-left and left-centre of the slide. A yellow (#FFCC00) polygon of petroleum licence blocks shaped like a diagonal band from upper-left to a stepped block at centre, labelled KAIETEUR (north block), STABROEK (west block), CANJE (east block). Small green dots mark wells, with black leader lines to labels Payara, Liza, Yellowtail and Redtail clustered near the block centre. A double-headed grey arrow labelled 275 MILES runs diagonally from upper-left to lower-right parallel to the coastline. Georgetown is marked with a black dot on the coast. Background land is light grey topographic shading (#C8C8C8 to #9A9A9A) with a pale blue (#A9D8F0) glow for the Atlantic Ocean along the coastline. Inset: a circular grey (#6E6E6E) map of South America with a white outline, a small blue (#8FD0F0) rectangle marking Guyana, and labels Atlantic Ocean (top), GUYANA and BRAZIL in white capitals on the grey. No photographs, logos or icons; the map is not cropped and is not boxed, sitting directly on the white background.
Slide 27
PERMIAN UPDATE
PERMIAN PRODUCTION
Koebd, net
400
200
0
2018
2019
2020
2021
Sept YTD
•
Meeting 2020 production commitments despite
curtailments and pacing
–
>35% reduction in Capex
–
14 Koebd year-to-date impact due to curtailments
•
Significant improvement in performance vs. 2019
–
Drilling and completion cost reduced >20%
–
Drilling lateral feet per day increased >30%
–
Frac stages per day increased >30%
•
Expect continued production growth in 2021
Volumes shown on a net basis.
27
Visuals: Vertical bar chart titled PERMIAN PRODUCTION, with unit line Koebd, net. Y-axis runs from 0 at the bottom to 400 at the top, with labelled ticks at 0, 200 and 400 (no minor ticks), and no axis title beyond the unit line. X-axis categories are 2018, 2019, 2020 and 2021, with a thin black horizontal baseline at 0. Single series, no legend. 2018 bar is green, about 152 Koebd (no value printed). 2019 bar is green, about 272 Koebd (no value printed). 2020 bar is green, about 360 Koebd (no value printed), with a small red diamond marker near its top, about 350 Koebd, labelled Sept YTD in red bold text to its left; this is the only highlighted point. 2021 bar is a full-height grey bar reaching the 400 level, with its top third fading from white to grey, indicating a projected value; no value printed. All bars are flat-topped rectangles of equal width with equal gaps, and there are no gridlines and no data labels.
Slide 28
HIGHGRADING PORTFOLIO
• Growing industry-leading portfolio of development / opportunities
– Guyana, Brazil, Permian, LNG (Mozambique, PNG)
– Robust returns across range of prices
• Investment program unchanged in Guyana, Brazil
– Pacing Permian and LNG consistent with capital / allocation priorities and market demand
• Continuing to progress $15B divestment program
– Less strategic end-of-life assets: 11 assets in market
• Evaluating expanded divestment program
– Assessing development plans for N. America dry gas / assets
– Finalizing plans in November
28
Countries with ExxonMobil operations
Upstream
Downstream
Chemical
Visuals: World map (illustration/diagram) in flat vector style, Mercator-like projection, full map spanning about x 3 to 50 and y 23 to 72 of the slide, unboxed and not cropped. Countries with ExxonMobil operations are filled mid-grey #6D6E71; countries without are light grey #D9D9DB; Greenland and other non-operating areas are light grey. Coloured circular markers sit on the countries: red #E31B23 for Upstream, blue #0066B3 for Downstream, green #00A651 for Chemical, many grouped in clusters of two to four dots, with a few thin black connector lines and arrows in Europe and the Middle East. Legend at bottom-left (about x 3 to 22, y 78 to 90): a grey square #6D6E71 labelled Countries with ExxonMobil operations, then a red dot labelled Upstream, a blue dot labelled Downstream, and a green dot labelled Chemical, stacked vertically at about 3 percent spacing. No chart axes, no photographs, no logos.
Slide 29
EARNINGS POTENTIAL
PRICES / MARGINS
2010 - 2020
Crude¹
($/bbl)
Natural gas²
($/mbtu)
Downstream
margins³
($/bbl)
Chemical
margins⁴
($/tonne)
2010-19
Annual
range
3Q 2020
Unprecedented price/margin environment with all businesses below 10-year range
Environment resulting in:
– Underinvestment in Upstream
– Accelerated refinery rationalizations
– Chemical project deferrals
Significant Downstream and Chemical earnings upside; 2010-19 annual earnings ranges:
– Downstream: $2 – $8 billion⁵
– Chemical: $1 – $5 billion
2021 plans maintain dividend within the low end of historic price/margin range
¹,²,³,⁴,⁵ See Supplemental Information.
29
Visuals: Bar-and-marker chart titled PRICES / MARGINS, subtitle 2010 - 2020. Four categories with no printed axis, scale or numeric values: Crude¹ ($/bbl), Natural gas² ($/mbtu), Downstream margins³ ($/bbl), Chemical margins⁴ ($/tonne). Each category has a light blue-grey bar (#B8C7E0) spanning the 2010-19 annual range, all bars with the same top and bottom edge (about 35% to 65% of slide height), labelled by the blue text 2010-19 Annual range beside the Chemical bar. Each category has one red diamond (#E00000, about 1% of slide width) marking 3Q 2020: Crude diamond sits just below its bar bottom at left, Natural gas diamond well below its bar, Downstream diamond lowest, Chemical diamond just inside the bar bottom; the 3Q 2020 red label sits beside the Chemical bar. Values are not printed; positions are about only. No legend, no axis lines, no photographs, logos or icons.
Slide 30
CAPITAL ALLOCATION PRIORITIES
• Long-term capital allocation priorities remain unchanged
– Invest in advantaged projects
– Maintain strong balance sheet
– Provide reliable and growing dividend
• Developing 2021 Plan consistent with near-term demand uncertainties and commitments
– Reducing Capex to $16 – $19 billion
– Further reducing cash operating expense, focus on overhead
– Maintaining dividend without increasing gross debt levels above 2Q20 levels
• Maintaining flexibility to respond as markets evolve
See Supplemental Information.
30
Slide 31
KEY MESSAGES
Record safety and operations performance despite challenging conditions
On track to exceed reduction targets for 2020 Capex and Opex
Aggressively reducing costs while maintaining operations integrity
Efficiently pacing investments while preserving long-term value
31
Slide 32
Q&A
Mark your calendars for
ExxonMobil Investor Day
March 3, 2021
Virtual
ExxonMobil
Visuals: Full-bleed aerial photograph of an LNG carrier moored alongside a long grey steel loading jetty on calm blue sea. The white-and-cream hull with a black waterline and a red funnel cap sits left of centre, with the jetty running diagonally to the right edge and a small white control house at the far right. A low island is visible on the horizon at right. Sky is pale blue with thin white cirrus streaks. Lighting is bright daytime sun; the photo is uncropped in a landscape frame and carries no tint. Dominant colours are blue (sky and sea), white and cream (ship), and red (funnel). The white text sits over the darker lower sea area.
Slide 33
FOURTH QUARTER 2020 OUTLOOK
DOWNSTREAM SCHEDULED MAINTENANCE QUARTERLY EARNINGS IMPACT¹
Million USD
500
250
0
2019 quarterly / average
1Q20
2Q20
3Q20
4Q20 Est.
CHEMICAL SCHEDULED MAINTENANCE QUARTERLY EARNINGS IMPACT²
Million USD
200
100
0
2019 quarterly / average
1Q20
2Q20
3Q20
4Q20 Est.
• Full year 2020 turnaround activity down from 2019
• Downstream maintenance up from 3Q
• Chemical maintenance in line with 3Q
¹ Estimates based on September margins.
² Based on operating expenses related to turnaround activities.
33
Visuals: Two vertical bar charts, both in solid blue bars with no gridlines, a black horizontal baseline at zero and no legend. Chart 1: title 'DOWNSTREAM SCHEDULED MAINTENANCE QUARTERLY EARNINGS IMPACT' with superscript 1, unit 'Million USD'. Y axis labelled 0, 250, 500 (Million USD), range 0 to about 500. Categories left to right: '2019 quarterly average', '1Q20', '2Q20', '3Q20', '4Q20 Est.'. Bars: 2019 quarterly average about 470; 1Q20 about 275; 2Q20 about 175; 3Q20 about 115. No printed values. The 4Q20 Est. position has no bar, only a black I-shaped error-range marker (vertical line with horizontal caps at top and bottom) spanning about 110 to 210, centred about 160, marked as an estimate. Chart 2: title 'CHEMICAL SCHEDULED MAINTENANCE QUARTERLY EARNINGS IMPACT' with superscript 2, unit 'Million USD'. Y axis labelled 0, 100, 200 (Million USD), range 0 to about 200. Same categories. Bars: 2019 quarterly average about 95; 1Q20 about 72; 2Q20 about 28; 3Q20 about 26. The 4Q20 Est. position has a black I-shaped error-range marker spanning about 30 to 50, centred about 40. No printed values; all values are estimates. Bullets are red dot markers. No photographs, logos or icons.
Slide 34
SUPPLEMENTAL INFORMATION / “Curtailments,” as used on slides 7 and 8, includes both (1) government mandates and (2) economic / curtailments. Government mandates are shown as a separate category below. Economic curtailments are included / below as part of the “Demand / Other” category. / UPSTREAM VOLUME FACTOR ANALYSIS¹ / 3Q20 vs. 2Q20 / 3Q20 vs. 3Q19 / Prior Period / 3,638 / 3,899 / Downtime / Maintenance / -90 / +7 / Growth / Decline / -45 / +8 / Entitlement / Divestments / +23 / -4 / Government mandates / -20 / -139 / Demand / Other / +166 / -99 / Current Period / 3,672 / 3,672 / ¹ Koebd / 34
Visuals: One table, no photographs, charts or logos. Table columns: row label column (left-aligned labels, indented for sub-rows), '3Q20 vs. 2Q20' column (centred values), '3Q20 vs. 3Q19' column (centred values). Header row: label 'UPSTREAM VOLUME FACTOR ANALYSIS' with superscript 1, solid blue header bar with white bold text. Rows in order: Prior Period (bold) 3,638 | 3,899; Downtime / Maintenance -90 | +7; Growth / Decline -45 | +8; Entitlement / Divestments +23 | -4; Government mandates -20 | -139; Demand / Other +166 | -99; Current Period (bold) 3,672 | 3,672. Sub-rows are separated by thin dark grey horizontal rules; the table closes with a blue rule under the Current Period row. No chart axes, legend or highlighted points.
Slide 35
SUPPLEMENTAL INFORMATION
Slide 7
1) Includes Permian, Guyana and Abu Dhabi.
Slide 8
1) Includes Permian, Guyana and Abu Dhabi.
Slide 15
1) Includes noncontrolling interests of $2M in 3Q20 and ($147M) in 2Q20.
2) Includes PP&E Adds of ($3.3B) and net investments / advances of ($0.5B) in 3Q20.
3) Ending debt is the sum of (1) Notes and loans payable and (2) Long-term debt as reported in Form 10-Q, at the end of the respective quarter (September 30 or June 30).
Slide 19
1) Sources: IEA (IEA supply and IEA demand); EIA, S&P Global Platts, IHS Markit, Goldman Sachs, FGE, Energy Aspects, Rystad Energy, Argus, OPEC (range); company analysis of third-party data.
Slides 20 and 21
1) Source: ExxonMobil analysis based on data and research from the IEA World Energy Investment 2020, IEA World Energy Outlook 2020, IHS, Rystad, and Wood Mackenzie. Historical spend from 2005-2020 adjusted for escalation using IEA’s Upstream Cost Index.
2) Annual values are the averages of daily close prices for Dated Brent in the respective year.
Slide 22
1) Source: S&P Global Platts and ExxonMobil analysis. Equal weighting of US Gulf Coast (Maya-coking), Northwest Europe (Brent – catalytic cracking), and Singapore (Dubai – catalytic cracking) netted for industry average Opex and renewable identification numbers (RINS).
2) Source: IHS Markit. Margin equals Asia Pacific polyethylene less ethylene cash cost.
Slide 24
1) Includes employees and contractors.
35
Slide 36
SUPPLEMENTAL INFORMATION / Slide 26 / 1) Millions of barrels of crude oil. / 2) Cost of supply: The per-unit cost of developing a resource making it merchantable including all costs and a specified discount rate. Measured in constant dollars with Brent as the basis (incorporating premiums or debits as appropriate). / Slide 29 / 1) Source: S&P Global Platts. / 2) Source: ICE. Equal weighting of Henry Hub and NBP. / 3) Source: S&P Global Platts and ExxonMobil analysis. Equal weighting of U.S. Gulf Coast (Maya – Coking), Northwest Europe (Brent – Catalytic Cracking), and Singapore (Dubai – Catalytic Cracking) netted for industry average Opex and renewable identification numbers (RINS). / 4) Source: IHS Markit, Platts, and company estimates. Weighting of polyethylene, polypropylene, and paraxylene based on ExxonMobil capacity. / 5) Excluding $5.3 billion restructuring and divestment gain in 2012. / 36
Slide 37
SUPPLEMENTAL INFORMATION
Definitions
Cash Flow from Operations and Asset Sales. Cash flow from operations and asset sales is the sum of the net cash provided by operating activities and / proceeds associated with sales of subsidiaries, property, plant and equipment, and sales and returns of investments from the Summary statement of / cash flows. This cash flow reflects the total sources of cash from both operating the Corporation’s assets and from the divesting of assets.
Cash Operating Costs. Cash operating costs consist of (1) Production and manufacturing expenses, (2) Selling, general and administrative expenses, / and (3) Exploration expenses, including dry holes from ExxonMobil’s consolidated statement of income. The sums of these income statement lines / serve as an indication of cash operating costs and do not reflect the total cash operating costs of the Corporation. This measure is useful in / understanding the Corporation’s efforts to conserve cash on hand while progressing planned projects.
Project. The term “project” as used in this presentation can refer to a variety of different activities and does not necessarily have the same meaning / as in any government payment transparency reports.
Resources, resource base, and recoverable resources. Along with similar terms, these refer to the total remaining estimated quantities of oil and / natural gas that are expected to be ultimately recoverable. ExxonMobil refers to new discoveries and acquisitions of discovered resources as resource / additions. The resource base includes quantities of oil and natural gas classified as proved reserves, as well as, quantities that are not yet classified as / proved reserves, but that are expected to be ultimately recoverable. The term “resource base” or similar terms is not intended to correspond to SEC / definitions such as “probable” or “possible” reserves. The term “in-place” refers to those quantities of oil and natural gas estimated to be contained in / known accumulations and includes recoverable and unrecoverable amounts. “Potential” resource amounts are not currently included in the resource / base.
Returns, investment returns, project returns. Unless referring specifically to ROCE, references to returns, investment returns, project returns, and / similar terms mean future discounted cash flow returns on future capital investments based on current company estimates. Investment returns / exclude prior exploration and acquisition costs.
37
Download this deck
The hosted PDF of every library deck is free for readers of the SlideDeck Co newsletter. Join with your email and the viewer and download appear here.
Preparing a results presentation or business update of your own? The SlideDeck Co Standard Deck is a slide library for business reviews, updates and plans.







