
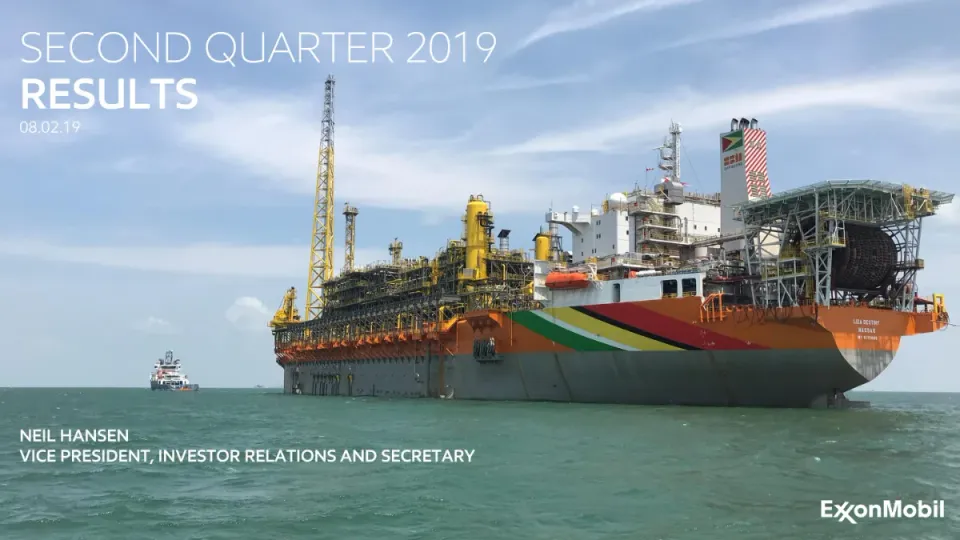
This is the ExxonMobil earnings presentation for the second quarter of 2019, delivered by Neil Hansen, Vice President of Investor Relations, with a management section by Neil Chapman, Senior Vice President. It opens with a title slide, a cautionary statement on forward-looking statements, and a first half 2019 summary of momentum. Key messages follow, then developments since the first quarter, and then the quarter's earnings and volume results compared with the prior quarter and prior year. The middle sections cover the cash profile, cash flow perspective, and third quarter outlook, including scheduled maintenance charts. Management perspectives on Permian, Guyana, and divestments come next, followed by a closing set of key messages and a Q&A slide. Supplemental information and definitions appear at the end. The deck uses a consistent layout: a large red highlight word in each headline, paired bar-chart waterfalls with short bullet commentary, and tables for segment earnings. The earnings and cash flow waterfalls each pair one chart with a few concise points, and the key messages table places a compact financial summary beside short commentary.
Slides worth studying
- Slide 6: The earnings waterfall from 1Q19 to 2Q19 uses clear colour coding for gains and losses with a short bullet explanation for each segment.
- Slide 8: The cash flow waterfall labels each bar directly and keeps the commentary to a few points beside the chart.
- Slide 4: The key messages slide pairs a compact financial summary table with brief commentary, so the numbers and the message read together.
Details
- Company: ExxonMobil
- Year: 2019
- Type: Investor presentation
- Industry: Energy
- Pages: 32
The hosted copy of this deck is being prepared. Newsletter readers will find the download here.
Review score: 8 out of 10, Strong
Presentation quality, judged with the SlideDeck Co review heuristic. Ask, evidence and idea merit are not rated here.
The decisive strength is that results, outlook and management commentary are kept apart and each is easy to find: slide 4 gives the summary table for 2Q19, 1Q19 and 1H19 including the negative free cash flow of (0.9), slides 6 to 9 explain the changes, slides 10 and 11 are titled 'Third quarter 2019 outlook' with estimates drawn as ranges, and management perspectives start at slide 12. Slide 6 puts a segment table with a change column next to the waterfall from 2,350 to 3,130, and the year-over-year and sequential waterfalls are moved to an appendix (slides 21 to 27) with an identified-items table on slide 28 and a volume factor table on slide 29. Exceptions are visible, such as the split 'Scheduled' portion of the (190) downtime bar on slide 24. The bottleneck is a few exhibits that ask for trust: slide 9 places red markers in 10-year high and low bands with no values, the liquids area chart on slide 7 starts at 2,100, and the negative free cash flow is not addressed in the bullets on slides 4 or 8.
Worth keeping: Keep the separate outlook pages with range marks for estimates and the appendix of second-comparison waterfalls so the main route stays short.
Most useful repair: Add the values behind the markers and the high and low ends on slide 9 and start the liquids chart on slide 7 at zero or mark the break.
What would change the score: If the outlook ranges on slide 11, read only on a contact sheet, turn out to carry no values at full size, the separation of outlook would be weaker and the score would be closer to 7.
Confidence high. 32 of 32 pages inspected on contact sheets, 12 at readable size. Reviewed 2026-11-15. Model-assisted review (claude-fable-5-2, in session).
Full text of the slides (32 slides)
Every slide's words and a description of its charts and images, so the deck can be searched and rebuilt. Also available as Markdown.
Slide 1
SECOND QUARTER 2019
RESULTS
08.02.19
NEIL HANSEN
VICE PRESIDENT, INVESTOR RELATIONS AND SECRETARY
ExxonMobil
Visuals: Full-bleed photograph of the offshore floating production vessel Liza Destiny moored at sea, seen from the port-side bow quarter. The hull is orange with a diagonal stripe band in green, white, yellow, black and red running along the side. A tall yellow lattice flare or derrick tower rises at left, with yellow process piping, pressure vessels and white deckhouses across the middle. At the upper right a red and white striped funnel carries an SBM Offshore logo and a Guyana flag, and a helideck with a grey steel frame sits at far right. The name LIZA DESTINY and NASSAU with IMO number appear in small white letters on the hull. A small white and red offshore supply vessel is at far left on the horizon. Sky is pale blue with thin white cirrus streaks and a few small cumulus clouds; sea is teal-green with light chop. Lighting is bright daylight, with no overlay or tint visible. The photo is uncropped at the edges and fills the full slide.
Slide 2
CAUTIONARY STATEMENT
•
Statements of future events or conditions in this presentation or the subsequent discussion period are forward-looking statements.
Actual future results, including financial and operating performance; demand growth and mix; ExxonMobil’s volume/production growth
and mix; the amount and mix of capital expenditures; resource recoveries; production rates; rates of return; development costs; project
plans, timing, costs, and capacities; drilling programs and efficiency improvements; product sales and mix; dividend and share purchase
levels; cash and debt balances; corporate and financing expenses; and the impact of technology, including impacts on capital efficiency,
production and greenhouse gas emissions, could differ materially due to a number of factors including global or regional changes in oil or
gas prices, differentials, or other market or economic conditions affecting the oil, gas, and petrochemical industries and the demand for
our products; reservoir performance; the outcome and timing of exploration and development projects; timely completion of construction
projects; war and other political or security disturbances, including shipping blockades or harassment; changes in law or government
regulation, including trade, sanctions, tax and environmental regulations; the outcome of commercial negotiations; the impact of fiscal
and commercial terms; opportunities for investments or divestments that may arise; the actions of competitors and customers; the
outcome of future research efforts; unexpected technological developments and the ability to bring new technology to commercial scale
on a cost-competitive basis, including large-scale hydraulic fracturing projects; unforeseen technical difficulties; and other factors
discussed here and under the heading "Factors Affecting Future Results" in the Investors section of our web site at exxonmobil.com. Any
forward-looking statements regarding future earnings, cash flows, returns, volumes, new projects, or market strategies are as of the
March 6, 2019 Investor Day except as specifically updated on this webcast. All forward-looking statements are based on management’s
knowledge and reasonable expectations and we assume no duty to update these statements as of any future date.
•
Forward-looking statements in this release regarding future earnings, cash flows, returns, volumes, new projects, market strategies, or
key milestones refer to plans outlined at ExxonMobil’s Investor Day held on March 6, 2019, except for our third quarter outlook on pages
10 through 11. The growth figures presented at that meeting are not forecasts of actual future results but were intended to help quantify
future potential and goals of management plans and initiatives. See the complete March 6, 2019 presentation available in archive form
(including the Cautionary Statement and Supplemental Information included with that presentation) on the Investors page of our website
at www.exxonmobil.com for more detailed information. That material includes a description of the assumptions underlying these
potential growth estimates including a flat real oil price of $60 Brent per barrel (which is not intended to be a forecast of future prices),
downstream and chemical margins consistent with 2017 levels, and future gas prices consistent with our internal company plans, as well
as a reconciliation of adjusted 2018 earnings used as a baseline.
2
Slide 3
FIRST HALF 2019 MOMENTUM
Growth plans progressing on schedule, supported by long-term fundamentals
Nine major project FIDs in first half
Four significant deepwater discoveries in Guyana and Cyprus
Key milestones achieved for PNG and Mozambique LNG
Year-over-year liquids growth of 144 Kbd (+7%), driven by Permian
Progressing Permian infrastructure and takeaway capacity build-out
Recent Downstream and Chemical start-ups accretive to earnings in current margin environment
Beaumont hydrofiner, Antwerp coker, Rotterdam hydrocracker, Baytown steam cracker, Newport Santoprene
Baytown steam cracker production exceeding design capacity by 10%
Quarterly dividend increased by 6%, marking 37th consecutive year of dividend growth
3
Slide 4
SECOND QUARTER 2019 KEY MESSAGES
FINANCIAL SUMMARY 2Q19 1Q19 1H19
Earnings 3.1 2.4 5.5
Cash Flow from Operations and Asset Sales1 6.0 8.4 14.4
Cash Flow from Operations and Asset Sales excluding Working Capital1 7.2 6.2 13.4
CAPEX 8.1 6.9 15.0
Free Cash Flow1 (0.9) 2.5 1.6
Billions of dollars unless specified otherwise
Earnings and cash flow in line with commodity market factors previously communicated
Positive $0.12 earnings per share from one-time tax item
Natural gas prices and industry product margins challenged by short-term market imbalances
First half 2019 CAPEX at 50% of full-year guidance
1 See Supplemental Information for reconciliation and definition
4
Visuals: A single table, not a chart: header row FINANCIAL SUMMARY with columns 2Q19, 1Q19 and 1H19. Rows: Earnings 3.1 / 2.4 / 5.5; Cash Flow from Operations and Asset Sales1 6.0 / 8.4 / 14.4; Cash Flow from Operations and Asset Sales excluding Working Capital1 7.2 / 6.2 / 13.4; CAPEX 8.1 / 6.9 / 15.0; Free Cash Flow1 (0.9) / 2.5 / 1.6. The header row is filled blue #1A4B9B with white bold sans-serif capitals. Body rows are separated by thin dark grey horizontal rules about 1 pt. The table has no vertical rules and no shading on body rows. Values are right-aligned or centred under each column heading. No photographs, icons, logos or charts appear on the slide.
Slide 5
DEVELOPMENTS SINCE FIRST QUARTER 2019
UPSTREAM
Liquids realizations up with improvement in markers
Gas realizations declined with supply length and LNG lag effect
Permian production increased by 21% to 274 Koebd
Guyana: Liza 1 FPSO in transit, Liza Phase 2 FID, resource updated to 6+ Boeb
Other: Rovuma LNG development plan approval, Argentina expansion, additional exploration acreage
DOWNSTREAM
Refining industry margins improved, but remain near five-year lows
Reliability events at Baytown, Sarnia, and Yanbu impacted results
Group II basestock production increased with Rotterdam hydrocracker ramp-up and Singapore expansion
CHEMICAL
Paraxylene margins weakened with industry capacity additions
Beaumont polyethylene expansion started up, capturing integration benefits with Baytown steam cracker
Reached FID for Gulf Coast Growth Venture 1.8 Mta steam cracker and derivative units
CORPORATE
Agreement signed with Global Thermostat to advance carbon capture and sequestration technology
Entered long-term partnership with Department of Energy to advance lower-emissions technologies
5
Visuals: none. The slide contains no charts, photographs, icons or logos; its only graphic elements are four solid blue rectangular label blocks (#0B4AA0) and four thin blue horizontal rules (#1F4E9A, about 0.3% of slide height) separating the bands. The measured full-slide image is a blank white background.
Slide 6
EARNINGS 2Q19 VS. 1Q19 / EARNINGS / Million USD / 2,350 / 385 / 707 / (330) / 18 / 3,130 / 1Q19 / Upstream / Downstream / Chemical / Corp & Fin / 2Q19 / • Upstream: higher liquids realizations and one-time tax items, partly offset by lower natural gas prices / • Downstream: improved fuels margins, North American crude differentials, and mark-to-market derivative impacts, partly offset by reliability events / • Chemical: increased scheduled maintenance, weaker paraxylene margins / SEGMENT EARNINGS / 2Q19 / 1Q19 / CHANGE / Upstream / 3,261 / 2,876 / 385 / Downstream / 451 / (256) / 707 / Chemical / 188 / 518 / (330) / Corporate and financing / (770) / (788) / 18 / Total / 3,130 / 2,350 / 780 / 6
Visuals: Waterfall chart titled EARNINGS with subtitle Million USD at top left of the chart area; no y-axis, no gridlines, no numeric scale; a single thin horizontal baseline in black (#000000, about 0.1% of height) under the bars at about 88.9% y, spanning about 2% to 45% x. Seven categories left to right with labelled values: 1Q19 total bar 2,350 (blue, from baseline to about 54% y); Upstream increase 385 (green, floating); Downstream increase 707 (green, floating, larger); Chemical decrease (330) (red, floating); Corp & Fin increase 18 (green, very thin floating bar about 0.3% high); 2Q19 total bar 3,130 (blue, from baseline to about 43% y). Colours: totals blue #0F4A9C, increases green #009900, decrease red #C00000. Value labels sit above each bar in black Calibri about 2.6% of height. Category labels below the baseline in black Calibri. Connector lines none. Highlighted points none. Legend none. Table: header row filled blue #0F4A9C with white bold uppercase text; columns SEGMENT EARNINGS, 2Q19, 1Q19, CHANGE; rows Upstream 3,261 / 2,876 / 385; Downstream 451 / (256) / 707; Chemical 188 / 518 / (330); Corporate and financing (770) / (788) / 18; Total (bold) 3,130 / 2,350 / 780. Body rows white with thin grey (#7F7F7F, about 0.1% high) horizontal rules between rows and a dark rule under the total. Numbers right aligned in their columns.
Slide 7
UPSTREAM VOLUMES
VOLUMES, 2Q19 vs. 2Q18
Koebd
3,647
45
Liquids: +40 / Gas: +5
175
Liquids: +140 / Gas: +35
40
Liquids: -5 / Gas: +45
3,909
2Q18
Downtime / Maintenance
Growth / Decline
Other
2Q19
QUARTERLY LIQUIDS PRODUCTION
Kbd
2,384
2,389
2,100
4Q16
2Q17
4Q17
2Q18
4Q18
2Q19
7
Year-over-year volumes increased by 7%
• Growth driven by Permian (+129 Koebd, +89%), Hebron, and Kaombo
• Lower maintenance in Canada and absence of PNG earthquake
• Stronger seasonal gas demand in Europe
Strong liquids growth
• Liquids increased by 177 Kbd (+8%) from 2Q18
• Highest liquids production since 2016
• Highest 2Q liquids production in last 10 years
Visuals: Two charts. (1) Top-left: a waterfall (bridge) chart titled VOLUMES, 2Q19 vs. 2Q18, unit Koebd, no visible y-axis or scale. Bars left to right with category labels 2Q18, Downtime / Maintenance, Growth / Decline, Other, 2Q19. 2Q18 is a solid blue column labelled 3,647 (about 3,647 Koebd). Downtime / Maintenance is a thin green floating bar labelled 45 with detail Liquids: +40 and Gas: +5 beneath. Growth / Decline is a taller green floating bar labelled 175 with detail Liquids: +140 and Gas: +35 beneath. Other is a thin green floating bar labelled 40 with detail Liquids: -5 and Gas: +45 beneath. 2Q19 is a solid blue column labelled 3,909. A thin dark grey horizontal baseline runs under the bars. No legend, no highlighted points beyond the colour coding of blue totals and green increments. (2) Bottom-left: a filled area chart titled QUARTERLY LIQUIDS PRODUCTION, unit Kbd, y-axis baseline labelled 2,100 at bottom-left, no other y-axis ticks. X-axis labels 4Q16, 2Q17, 4Q17, 2Q18, 4Q18, 2Q19, with 11 quarterly points. Labelled values: 2,384 at 4Q16 and 2,389 at 2Q19. Unlabelled points about: 1Q17 2,333, 2Q17 2,269, 3Q17 2,280, 4Q17 2,251, 1Q18 2,217, 2Q18 2,213, 3Q18 2,285, 4Q18 2,348, 1Q19 2,328. Area filled solid blue from the baseline up to the line, no legend, no highlighted points.
Slide 8
SECOND QUARTER 2019 CASH PROFILE / CASH FLOW / Billion USD / $6B Cash Flow From Operating Activities / Depreciation / Earnings / 4.6 / 3.1 / 4.6 / (1.2) / Working Capital / Other / (0.5) / (6.9) / 4.2 / (3.7) / 4.2 / 4.6 / 1Q19 / Earnings / Depreciation / Working Capital / Other / PP&E Adds / Investments and / Advances¹ / Debt / Other / Financing / Shareholder / Distributions / 2Q19 / Cash flow from operating activities reflects industry market conditions / Working capital/other driven by seasonal payables and non-cash tax items / Asset-marketing activities in line with divestment plans / Capital spend in line with growth plans / Leveraging financial capacity to invest through cycle / ¹ Includes PP&E Adds of ($6.2B) and net investments/advances of ($0.7B) / 8
Visuals: Waterfall chart titled CASH FLOW with unit label Billion USD. Seven categories on the horizontal axis: 1Q19, Earnings / Depreciation, Working Capital / Other, PP&E Adds / Investments and Advances¹, Debt / Other Financing, Shareholder Distributions, 2Q19. There is no printed numeric value axis; the only axis is a thin black horizontal baseline. Bars and printed values: 1Q19 blue total bar 4.6; Earnings/Depreciation stack of green solid Earnings bar 3.1 (lower segment) with green dotted-pattern Depreciation segment 4.6 (upper segment); Working Capital/Other stack of red Working Capital segment (1.2) above red hatched Other segment (0.5) with (0.5) printed below the stack, floating down; PP&E Adds / Investments and Advances red floating-down bar (6.9); Debt / Other Financing green floating-up bar 4.2; Shareholder Distributions red floating-down bar (3.7); 2Q19 blue total bar 4.2. Series labels are printed beside the first stack: Depreciation (upper) and Earnings (lower) on the left; Working Capital and Other on the right of the red stack. A black curly brace spans the Earnings/Depreciation and Working Capital/Other columns, with the heading $6B Cash Flow From Operating Activities above it. No legend box and no highlighted points beyond the brace. No photographs, logos or icons.
Slide 9
CASH FLOW PERSPECTIVE
PRICE / MARGIN ENVIRONMENT
Crude1
($/bbl)
Natural gas2
($/mbtu)
Downstream margins3
($/bbl)
Chemical margins4
($/tonne)
10-year high
YTD average
10-year low
FREE CASH FLOW5
Billion USD
CUMULATIVE FREE CASH FLOW AND DIVIDENDS
Billion USD
40
30
20
10
200
150
100
50
Free cash flow
Cumulative free cash flow
Cumulative dividends
2010
2011
2012
2013
2014
2015
2016
2017
2018
• Current margin environment consistent with historical experience and anticipated scenarios
• Recent chemical and refining start-ups accretive to earnings and cash flow
• Financial strength provides capacity to invest across commodity cycles and grow dividend
• Counter-cyclical investments provide opportunity to capture incremental value
1 Source: Brent via publicly available sources
2 Source: Equal weighting of Henry Hub and NBP via publicly available sources
3 Source: S&P Global Platts Analytics, equal weighting of U.S. Gulf Coast (Maya – Coking), Northwest Europe (Brent – Catalytic Cracking), Singapore (Dubai – Catalytic Cracking)
4 Source: IHS Markit and EM estimates, weighting of polyethylene, polypropylene, and paraxylene based on EM capacity
5 See Supplemental Information for reconciliation and definition
9
Visuals: Chart 1, price and margin environment: four vertical range bars, each a light blue rectangle with a red diamond marker, with no printed numeric values. Crude ("$/bbl"): bar from 10-year low (bottom) to 10-year high (top); red diamond labelled YTD average near the lower third (about 25% up from the bottom). Natural gas ("$/mbtu"): diamond about 40% up from the bottom. Downstream margins ("$/bbl"): diamond at the very bottom, about the 10-year low. Chemical margins ("$/tonne"): diamond about 30% up from the bottom. Scale labels 10-year high (top) and 10-year low (bottom) apply to the crude bar's left side. No legend. Chart 2, free cash flow (left, Billion USD): blue vertical bars, left axis 0 to 40 with gridlabels 10, 20, 30, 40, no gridlines, baseline at 0. Bar values (about): 2010 about 25; 2011 about 33; 2012 about 30; 2013 about 11; 2014 about 18; 2015 about 6; 2016 about 10; 2017 about 14; 2018 about 20. Label Free cash flow in blue above the 2010 to 2011 area. Chart 3, cumulative free cash flow and dividends (right, Billion USD): black line, right axis 50 to 200 with labels 50, 100, 150, 200; values (about): 2010 about 25; 2011 about 60; 2012 about 88; 2013 about 99; 2014 about 117; 2015 about 123; 2016 about 133; 2017 about 147; 2018 about 167. Line labelled Cumulative free cash flow in black above the 2017 to 2018 area. Red diamond marker at 2018 on the dividend series at about 100 labelled Cumulative dividends in red. Bars in blue with x-axis years 2010 to 2018 below a thin grey baseline. No legend beyond the direct labels.
Slide 10
THIRD QUARTER 2019 OUTLOOK
UPSTREAM
Volumes expected to be in line with second quarter
Absence of non-U.S. tax item
DOWNSTREAM
Permian crude differentials expected to narrow with additional takeaway capacity
Refining margins expected to be in line with seasonal demand patterns
Lower scheduled maintenance
CHEMICAL
Supply length continues to impact margins
Lower scheduled maintenance
CORPORATE
Corporate and financing expenses expected to be $700 million - $900 million
10
Slide 11
THIRD QUARTER 2019 OUTLOOK
DOWNSTREAM SCHEDULED MAINTENANCE QUARTERLY EARNINGS IMPACT1
Million USD
750
500
250
2Q19
3Q Est.
4Q Est.
CHEMICAL SCHEDULED MAINTENANCE QUARTERLY EARNINGS IMPACT2
Million USD
200
2Q19
3Q Est.
4Q Est.
Heavy turnaround activities in 2018/19,
including preparation for IMO 2020
Lower third quarter scheduled maintenance
for Downstream and Chemical
1 Future estimates based on July YTD margins
2 Based on operating expenses related to turnaround activities
11
Visuals: Two bar-and-range charts. Chart 1 (Downstream, Million USD, y axis 0 to about 750 with labelled ticks at 250, 500 and 750; x categories 2Q19, 3Q Est., 4Q Est.). 2Q19 is a solid light steel blue bar reaching about 650. 3Q Est. is a range shown as two dark blue horizontal caps joined by a dotted vertical line, spanning about 150 to about 250. 4Q Est. is a range spanning about 335 to about 480. Chart 2 (Chemical, Million USD, y axis ticks at 200 only, baseline 0; categories 2Q19, 3Q Est., 4Q Est.). 2Q19 is a light steel blue bar to about 170. 3Q Est. range about 65 to about 100. 4Q Est. range about 85 to about 125. No legend and no values are printed; the figures above are estimates. No points are highlighted. Thin light grey horizontal baselines sit under each chart. Bars are solid #8FAADC, range caps and dotted connectors are dark blue #1F4E9C.
Slide 12
MANAGEMENT
PERSPECTIVES
NEIL CHAPMAN
SENIOR VICE PRESIDENT
ExxonMobil
Visuals: Full-bleed aerial photograph of a drilling rig on rolling grassland. Subject: a tall lattice drilling derrick with a blue-grey substructure, standing on a cleared red-brown dirt pad with storage tanks, metal containers, pipe racks and a small white cabin, set on a grassy ridge. Several black cattle graze on the hillsides and along a dirt track at the right. Composition: the rig is near the centre-right at about 56% to 60% of slide width and 34% to 57% of slide height, on the horizon of a rolling ridge, with the hills in the foreground and background. The sky fills the upper third in a clear blue gradient that fades to pale near the horizon. Lighting: low warm sunlight, possibly early morning or late evening, with golden highlights on the grass. Dominant colours: sky blue about #5B8BC4 at the top fading to #D9DDE0 at the horizon, grass tan-gold about #B08D57, and dirt red-brown about #8A5A3C. The photo is uncropped in a landscape frame, full-bleed, with no overlay or tint visible.
Slide 13
SECOND QUARTER PERSPECTIVES / Strong liquids growth / Growth projects progressing on schedule / Strong Permian growth / Rapid development in Guyana / 11 of 19 major Downstream and Chemical projects started up / Business model resilient to cyclicality / 1H Downstream and Chemical margins at a low point in cycle / Margin cycles anticipated, strategies unchanged / Financial capacity to invest through cycle / Three events led to disappointing refining reliability / 1 Source: S&P Global Platts Analytics, equal weighting of U.S. Gulf Coast (Maya – Coking), Northwest Europe (Brent – Catalytic Cracking), Singapore (Dubai – Catalytic Cracking) / 2 Source: IHS Markit and EM estimates / Industry refining margin1 / $/bbl / 10 / 5 / '00 / '05 / '10 / '15 / 1H19 / Asia Pacific industry polyethylene margin2 / $/tonne / 800 / 400 / '00 / '05 / '10 / '15 / 1H19 / 13
Visuals: Two line charts stacked in the right column. Chart 1: line chart titled 'Industry refining margin¹' with unit '$/bbl'; y-axis labels printed only at 5 and 10 (implied range about 0 to 10); x-axis labels '00, '05, '10, '15, 1H19 with annual points between them and no printed data values; the values are about 4.5 in 2000, about 4.2 in 2001, about 1 in 2002 (low point), about 3 in 2003, about 6.5 in 2004, about 9 in 2005, about 8.3 in 2006, about 9.2 in 2007, about 7.8 in 2008, about 2.5 in 2009 (low point), about 4 in 2010, about 5.5 in 2011, about 8 in 2012, about 6.5 in 2013, about 7 in 2014, about 9 in 2015, about 7.5 in 2016, about 7.8 in 2017, about 3.9 in 1H19. Chart 2: line chart titled 'Asia Pacific industry polyethylene margin²' with unit '$/tonne'; y-axis labels printed at 400 and 800; x-axis labels '00, '05, '10, '15, 1H19; values about 350 in 2000, about 310 in 2001, about 290 in 2002, about 370 in 2003, about 620 in 2004, about 630 in 2005, about 710 in 2006, about 580 in 2007, about 640 in 2008, about 550 in 2009, about 480 in 2010, about 380 in 2011, about 260 in 2012 (low point), about 320 in 2013, about 500 in 2014, about 720 in 2015, about 780 in 2016 (peak), about 610 in 2017, about 540 in 2018, about 440 in 1H19. Both series are single dark blue lines with no legend and no highlighted points; each chart has a thin light grey horizontal baseline at the bottom and no gridlines. No photographs, logos or icons.
Slide 14
MAJOR GROWTH PROJECTS ON SCHEDULE
Portfolio
Project
Status / notable updates
Upstream
Permian
Production ramp-up on plan
Guyana
Liza Phase 1 on schedule, FPSO in Guyana 3Q19; Liza Phase 2 FID completed 2Q19
Brazil
Carcara project on schedule to start up 2023/24; Uirapuru exploration drilling planned in 2H19
PNG
Critical Papua LNG expansion agreement approved 2Q19
Mozambique
Government approval of Rovuma development plan 2Q19
Downstream
Beaumont hydrofiner
2018 start-up, 45 Kbd naphtha and gasoil to higher-value products including low-sulfur gasoline, distillates
Antwerp coker
2018 start-up, 50 Kbd fuel oil to higher-value products including marine gasoil and ultra-low-sulfur diesel
Rotterdam hydrocracker
2018 start-up, 42 Kbd gasoil to higher-value products including Group II basestocks and ultra-low-sulfur diesel
1H19 FIDs
Singapore resid upgrade, Fawley hydrofiner, and Beaumont light crude expansion
Chemical
Baytown steam / cracker / polyethylene
2017/2018 start-up, 1.5 Mta steam cracker running above design capacity
Beaumont polyethylene
July 2019 start-up (ahead of schedule), 650 Kta polyethylene
Newport Santoprene expansion
May 2019 start-up, increases global manufacturing capacity of Santoprene by 25 percent
1H19 FIDs
Baton Rouge polypropylene 450 Kta, Baytown chemical expansion (linear alpha olefins 350 Kta and / Vistamaxx 400 Kta), Gulf Coast Growth Venture 1.8 Mta steam cracker and derivatives
14
Visuals: Table with three columns and three portfolio groups, rows as follows. Upstream: Permian / Production ramp-up on plan; Guyana / Liza Phase 1 on schedule, FPSO in Guyana 3Q19; Liza Phase 2 FID completed 2Q19; Brazil / Carcara project on schedule to start up 2023/24; Uirapuru exploration drilling planned in 2H19; PNG / Critical Papua LNG expansion agreement approved 2Q19; Mozambique / Government approval of Rovuma development plan 2Q19. Downstream: Beaumont hydrofiner / 2018 start-up, 45 Kbd naphtha and gasoil to higher-value products including low-sulfur gasoline, distillates; Antwerp coker / 2018 start-up, 50 Kbd fuel oil to higher-value products including marine gasoil and ultra-low-sulfur diesel; Rotterdam hydrocracker / 2018 start-up, 42 Kbd gasoil to higher-value products including Group II basestocks and ultra-low-sulfur diesel; 1H19 FIDs / Singapore resid upgrade, Fawley hydrofiner, and Beaumont light crude expansion. Chemical: Baytown steam cracker / polyethylene / 2017/2018 start-up, 1.5 Mta steam cracker running above design capacity; Beaumont polyethylene / July 2019 start-up (ahead of schedule), 650 Kta polyethylene; Newport Santoprene expansion / May 2019 start-up, increases global manufacturing capacity of Santoprene by 25 percent; 1H19 FIDs / Baton Rouge polypropylene 450 Kta, Baytown chemical expansion (linear alpha olefins 350 Kta and Vistamaxx 400 Kta), Gulf Coast Growth Venture 1.8 Mta steam cracker and derivatives. Horizontal black rules (about 1 pt) separate the Upstream, Downstream and Chemical bands and close the table at the bottom and under the header. No charts, photographs, icons or logos.
Slide 15
UNCONVENTIONAL BUSINESS UPDATE
PERMIAN AND BAKKEN PRODUCTION, 2019 OUTLOOK1
Koebd net
1,500
1,000
500
0
'15
'20
'25
Actual production
Permian
Bakken
1 Potential production as communicated at 2019 Investor Day
Permian includes Midland and Delaware basins
See Supplemental Information
15
•On plan Permian production growth
–2019 1Q – 2Q production increased ~20%
–2018 2Q – 2019 2Q production increased ~90%
•2Q operating status
–51 rigs; 12 frac crews
•Progressing unique development plan
–Delaware central delivery point and pipeline to Wink terminal on track
–FID and agreement with partners to proceed with >1 Mbd Permian to U.S. Gulf Coast crude pipeline
Visuals: Chart: stacked area chart titled 'PERMIAN AND BAKKEN PRODUCTION, 2019 OUTLOOK' with superscript 1, subtitle 'Koebd net'. Y-axis labelled in Koebd net with ticks 0, 500, 1,000 and 1,500 (range 0 to about 1,500). X-axis ticks '15, '20 and '25 (2015 to 2025); no value labels printed. Series 1, Permian, bright green fill (about #1BAE5A) as the upper band, reaching about 1,300 Koebd net by about 2024 with a soft, blurred top edge fading into the background. Series 2, Bakken, dark green fill (about #17704A) as the lower band, reaching about 250 by about 2022 to 2024 (about values, not printed). The Permian band's white label 'Permian' sits inside it around 2022 at about 400 level; the white label 'Bakken' sits inside the dark band around 2021 at about 150. Actual production is a red line (about #E10D1B), about 3 px wide, running from 2015 at about 100 Koebd net to about 2019 at about 400 (about values), with small wiggles. Legend: a short thick red dash followed by 'Actual production' at the upper left of the plot area, at about 500 to 1,300 height. No gridlines. No highlighted points.
Slide 16
GUYANA UPDATE
LIZA DESTINY
First FPSO Liza Destiny (120 Kbd) en route to Guyana
1Q 2020 start-up
Liza Phase 2 (220 Kbd) completed FID in May
On schedule for 2022 start-up
Three discoveries in 1H19
Recoverable resource up from 5.5. to 6+ Boeb
Three drill ships in basin, adding fourth drillship in 4Q
Anticipate three more exploration wells in 2H19
Completed additional drilling / testing on Hammerhead
Commenced additional drilling on Ranger
Ongoing development drilling for Liza Phase 1
Considerable undrilled potential
FUTURE EXPLORATION POTENTIAL
Prospect count1
50
25
0
'15
'16
'17
'18
'19 YTD
1 Exploration prospect count across Stabroek, Canje, and Kaieteur blocks
16
Visuals: Photograph: an FPSO (floating production storage and offloading vessel) named Liza Destiny, a large orange-and-yellow hull with a yellow derrick tower and flare boom on its deck, moored in calm brown-grey water. Two red and white tugboats sit beside it, and a third tug is at far left. Sky is blue with large white cumulus clouds. Shot from a low side angle, full daylight, landscape framing, boxed with a sharp rectangle and no overlay. A green, yellow and red stripe is painted on the hull. Stacked bar chart titled FUTURE EXPLORATION POTENTIAL, subtitle Prospect count with superscript 1. Y-axis 0 to 50 with labels 0, 25 and 50 (no units printed beyond prospect count). X-axis categories '15, '16, '17, '18, '19 YTD. Series Drilled (dark blue #0B4EA2 solid) and Undrilled (grey gradient fading from dark grey at bottom to white at top). Values are not printed; about values: '15 drilled about 1, undrilled about 5 (total about 6); '16 drilled about 2, undrilled about 17 (total about 19); '17 drilled about 7, undrilled about 17 (total about 24); '18 drilled about 12, undrilled about 32 (total about 44); '19 YTD drilled about 14, undrilled about 36 (total about 50). Legend at top inside plot: blue square Drilled and grey square Undrilled. No highlighted points.
Slide 17
UPSTREAM PORTFOLIO MANAGEMENT
17
UPSTREAM ASSETS1
Count
2019 planned assets in market
YE 2018
Potential
Risked
Unrisked
2019 – 2021 divestment plan
Highgrading portfolio based on strategic fit,
materiality, and growth potential
Anticipate asset sales of ~$15G by end of 2021
Marketing activities in line with plan
Assets currently in market
Mobile Bay, Gulf of Mexico shelf and deepwater
Azerbaijan
Norway
Others
Source: Wood Mackenzie; EM analysis on potential divestments
1 Assets defined by Wood Mackenzie do not correspond to management's view of
assets but is provided to illustrate potential
Visuals: One column chart titled UPSTREAM ASSETS with superscript 1 and subtitle Count, with no axis numerals or scale. Three columns on a shared baseline: (1) YE 2018, solid red #FF0000 bar, full height about 28 percent of slide height, labelled YE 2018; (2) 2019 planned assets in market, a floating grey #808080 bar sitting at the top of the plot area, short (about 3.8 percent of slide height), labelled 2019 planned assets in market; (3) Potential, a stacked column with an unrisked lower segment in light pink #E6B8B8 (about 17 percent of slide height) and a risked upper segment with red diagonal hatching on white (about 5.5 percent of slide height), labelled Potential, with segment labels Risked and Unrisked to its right. No printed values; the bars are not to scale beyond their relative heights. Baseline is a thin light grey #BFBFBF horizontal rule under all columns. No legend box; segment labels act as legend. No highlighted points beyond the red YE 2018 bar.
Slide 18
U.S. GULF COAST CHEMICAL GROWTH
Baytown/Mont Belvieu steam cracker/polyethylene
Started up 2017/18
Baytown exceeding design capacity by 10%
Beaumont polyethylene started up July 2019
Ahead of schedule
Performance polyethylene: higher margin vs. commodity
2Q19 FID Corpus Christi steam cracker/derivatives
50/50 partnership EM and SABIC
Advantaged Permian feedstock
~25% lower capital cost than industry
Start-up by 2022
Map labels: Baton Rouge, Beaumont, Mont Belvieu, Baytown, Corpus Christi
Chart labels: Capacity (Mtpa), 0, 1, 2, 3, 4, Investment, Base, Beaumont, Mont Belvieu, Baytown ethylene, Mont Belvieu and Beaumont polyethylene
18
Visuals: A grey outline map of the US Gulf Coast (Texas, Louisiana, Gulf coastline) with a soft pale-blue glow along the coast and a blue dot marker at each site: Corpus Christi, Baytown, Mont Belvieu, Beaumont and Baton Rouge, each labelled in italic black text beside the dot. A stacked column chart beneath the map titled none (no chart title printed): y-axis labelled Capacity (Mtpa), ticks 0, 1, 2, 3, 4, range 0 to 4. Two columns: first column Baytown ethylene with a grey Base segment of about 2.3 Mtpa and a green Investment segment from about 2.3 to about 3.9 Mtpa; second column Mont Belvieu and Beaumont polyethylene with a grey Base segment of about 2.0 Mtpa, a green segment from about 2.0 to about 3.3 Mtpa labelled by a leader line to Mont Belvieu, and a green segment from about 3.3 to about 4.0 Mtpa labelled by a leader line to Beaumont. Segments separated by thin white lines. Green is about #40B040, grey about #A6A6A6, labels white inside segments. No legend box; leader lines are thin green lines.
Slide 19
KEY MESSAGES
Organization focused
High confidence in plans
Delivering on growth commitments
19
Slide 20
Q&A
Visuals: One photograph, full-bleed, covering 100% of the slide. Subject: an aerial view of a large petrochemical or oil refinery at dusk. Composition: wide landscape, camera elevated and looking across the plant towards the horizon. Foreground: pipe racks, low process buildings and a white pickup truck. Mid-ground: a tall tan/beige chimney stack at centre-right, a tall grey column and a dense cluster of lit towers and vessels. Right: several white spherical LPG tanks on legs. Left: white cylindrical storage tanks and a steel lattice structure. Upper-left of the centre: a blue-and-white single-storey building. Background: flat dark land, a bay or river with lights, and a line of trees at the horizon. Sky: deep indigo/violet at the top fading to magenta, then orange-red and amber at the horizon, with thin streaked cloud. Lighting: dusk, sunlight gone, the plant lit by warm amber and white industrial lamps and some green-tinted lights. Dominant colours: indigo #2B2D6E, magenta #A93F7A, orange-red #E8553A, amber #F5A623, and dark steel grey. Not cropped; full-bleed; no overlay or tint visible.
Slide 21
UPSTREAM VOLUMES 2Q19 VS. 1Q19 / VOLUMES / Koebd / 3,981 / (100) / 120 / (120) / 25 / 3,909 / Liquids: -60 / Gas: -40 / Liquids: +105 / Gas: +15 / Gas: -120 / Liquids: +15 / Gas: +10 / 1Q19 / Downtime / Maintenance / Growth / Decline / Seasonal Gas / Demand / Other / 2Q19 / Higher scheduled maintenance at Kearl, Qatar, and Kashagan / Growth includes increased U.S. unconventional liquids and Hebron ramp-up / Permian production increased 48 Koebd (21%) / Lower European seasonal gas demand / See Supplemental Information / 21
Visuals: Waterfall bar chart titled VOLUMES with unit subtitle Koebd, no axis line labels or tick values, shown on a baseline across about x 2-45% of the slide. Bars left to right: 1Q19 total blue bar labelled 3,981 (about 1,000 Koebd tall, scale not printed); Downtime / Maintenance red floating bar labelled (100), sublabels Liquids: -60 and Gas: -40; Growth / Decline green floating bar labelled 120, sublabels Liquids: +105 and Gas: +15; Seasonal Gas Demand red floating bar labelled (120), sublabel Gas: -120; Other green floating bar labelled 25, sublabels Liquids: +15 and Gas: +10; 2Q19 total blue bar labelled 3,909. Bar heights are about proportional to values; the 1Q19 and 2Q19 totals are about the same height, and the small floating bars are about 0.1 of the total height. No legend. No highlighted points beyond the colour coding: red = decrease, green = increase, blue = totals.
Slide 22
UPSTREAM EARNINGS 2Q19 VS. 1Q19 / EARNINGS / Million USD / 2,876 / 540 / (550) / 70 / 330 / 3,261 / 1Q19 / Liquids / Price / Gas / Price / Volume / Other / 2Q19 / • Higher liquids realizations offset by lower gas prices / • Liquids growth offset by increased scheduled maintenance and lower seasonal gas demand / • Other includes one-time tax items, partly offset by higher growth-related expenses / 22
Visuals: Bar chart (waterfall-style) titled EARNINGS, unit Million USD, with no printed axis scale or gridlines. Categories left to right: 1Q19 (total bar), Liquids Price (increase), Gas Price (decrease), Volume (increase), Other (increase), 2Q19 (total bar). Printed values: 1Q19 = 2,876; Liquids Price = +540; Gas Price = (550); Volume = 70; Other = 330; 2Q19 = 3,261. Totals are blue bars rising from a common baseline; the Liquids Price, Volume and Other bars are green floating bars that step up from the running total; the Gas Price bar is a red floating bar stepping down. Approximate bar tops as percent of slide height: 1Q19 top about 46.7%, Liquids Price top about 38.8% to bottom about 46.7%, Gas Price top about 38.8% to bottom about 46.8%, Volume about 45.8% to 46.8%, Other about 41.1% to 45.8%, 2Q19 top about 41.1%. Baseline is a thin grey horizontal axis line at about 88.4% of height spanning from about 2.2% to 45.2% of width. No legend; colours carry the meaning (blue totals, green increases, red decrease). No highlighted points beyond the colour coding. Bars are flat with no outline, shadow or gradient. Colours: blue #0E4A9E, green #009900, red #C00000.
Slide 23
UPSTREAM EARNINGS 2Q19 VS. 2Q18 / EARNINGS / Million USD / 2018 3,040 / (730) / 720 / 230 / 3,261 / 2Q18 / Price / Volume / Other / 2Q19 / • Lower liquids and gas realizations / • Growth in Permian and Hebron, higher seasonal / gas demand, and absence of downtime in Canada / and PNG / • Other includes one-time tax items partly offset by / higher growth-related expenses / 23
Visuals: Waterfall (bridge) chart titled EARNINGS with unit label Million USD. Five columns left to right: 2Q18 = 3,040 (blue total bar), Price = (730) (red decrease bar), Volume = 720 (green increase bar), Other = 230 (green increase bar), 2Q19 = 3,261 (blue total bar). Each bar is labelled with its value above it. No y-axis scale, tick marks or gridlines are printed; the bars are unlabelled by axis range, so bar heights are estimates only (about 3,040 and 3,261 for totals). Floating bars: Price spans from the 2Q18 top down to about 2,310 (about 730 down), Volume rises from about 2,310 to about 3,030, Other rises from about 3,030 to about 3,261. A thin grey horizontal baseline runs under all columns. Category labels sit below the baseline. No legend. The colour coding is blue for totals, red for the negative Price bar and green for positive Volume and Other bars; no bar is highlighted beyond this colour coding. Red bullet dots on the right.
Slide 24
DOWNSTREAM EARNINGS 2Q19 VS. 1Q19 / EARNINGS / Million USD / (190) / 1,120 / (120) / (100) / 451 / Scheduled / (256) / 1Q19 / Margin / Downtime / Maintenance / Yield / Sales Mix / Other / 2Q19 / • Stronger industry fuels margins in North America / • Increased North American crude differentials / • Absence of first quarter unfavorable mark-to-market derivative impacts / • Scheduled maintenance in line with first quarter; reliability events at Baytown, Sarnia, and Yanbu / • Unfavorable yield and sales mix with seasonal grade changes / • Other includes higher marketing expenses / 24
Visuals: Waterfall chart titled 'EARNINGS', subtitle 'Million USD', no axis lines or gridlines, no y-axis scale; values printed above or inside each bar. Categories left to right: 1Q19 (256) as a blue bar hanging below the baseline; Margin +1,120 as a green bar rising from the baseline; Downtime / Maintenance (190) as a floating light red bar with a dark red strip labelled 'Scheduled' at its base; Yield / Sales Mix (120) as a red floating bar; Other (100) as a red floating bar; 2Q19 451 as a blue bar rising from the baseline. A thin black horizontal baseline runs across the chart at the zero level. Values are printed values, not estimates; bar heights are approximately proportional to the values.
Slide 25
DOWNSTREAM EARNINGS 2Q19 VS. 2Q18 / EARNINGS / Million USD / 724 / (240) / (140) / 70 / 40 / 451 / 2Q18 / Margin / Downtime / Maintenance / Portfolio / Projects / Other / 2Q19 / Lower industry refining fuels and basestocks margins / Higher scheduled maintenance, partly offset by improved reliability / Portfolio improvements with recent major project start-ups / Other includes favorable foreign exchange impacts, partly offset by higher expenses / 25
Visuals: One waterfall (bridge) chart titled EARNINGS with unit line Million USD. Type: vertical column waterfall with floating bars and no visible y-axis, gridlines or axis ticks; a single black horizontal baseline runs under the bars. Categories left to right: 2Q18, Margin, Downtime / Maintenance, Portfolio / Projects, Other, 2Q19. Values printed above each bar: 2Q18 = 724 (total bar, blue, rises from baseline to full height); Margin = (240) (red, floating, decrease, top about 466px and bottom about 597px in the 1125px-high slide); Downtime / Maintenance = (140) (red, floating decrease, below Margin); Portfolio / Projects = 70 (green, floating increase, bottom of bar sits near 674px); Other = 40 (green, floating increase, thin bar); 2Q19 = 451 (blue total bar ending at about 617px). Colours: totals blue #0F4A9C, decreases red #C00000, increases green #009900. Bars are flat rectangles with no outlines, no shadows and no gradients. No legend and no highlighted points beyond colour coding. The chart is not cropped.
Slide 26
CHEMICAL EARNINGS 2Q19 VS. 1Q19 / EARNINGS / Million USD / 518 / (180) / (120) / (30) / 188 / 1Q19 / Margin / Downtime / Maintenance / Other / 2Q19 / • Weaker paraxylene margins with lengthening / supply on industry capacity additions / • Higher scheduled maintenance / 26
Visuals: Waterfall chart titled EARNINGS with unit line Million USD, shown in the upper-left of the chart area. Categories left to right: 1Q19, Margin, Downtime / Maintenance, Other, 2Q19. Series values: 1Q19 518 (total bar, blue), Margin (180) (decrease, red floating bar), Downtime / Maintenance (120) (decrease, red floating bar), Other (30) (decrease, red floating bar), 2Q19 188 (total bar, blue). No value axis or gridlines are printed; bar heights are proportional to the labelled values, with about 518 as the full height of the 1Q19 bar. Value labels sit above each bar, with the negative values in parentheses. The horizontal category baseline is a thin dark grey line. No legend and no highlighted points beyond the colour coding of totals (blue) versus decreases (red).
Slide 27
CHEMICAL EARNINGS 2Q19 VS. 2Q18 / EARNINGS / Million USD / 890 / (440) / (120) / (30) / (110) / 188 / 2Q18 / Margin / Downtime / Maintenance / Growth / Expenses / Other / 2Q19 / 27 / • Lower margins due to lengthening supply / • Higher scheduled maintenance / • Higher expenses related to growth projects / • Other includes unfavorable tax and forex impacts
Visuals: Chart: vertical waterfall (floating column) chart titled EARNINGS with unit label Million USD, placed at the left. The y-axis is not drawn and no numeric scale or range is printed; bar heights are proportional to the labelled values. Six columns in order: 2Q18 = 890 (blue total bar, rising from the baseline to about 37% from the top), Margin = (440) (red decrease floating from the top of the 2Q18 bar down to about 63% from the top), Downtime / Maintenance = (120) (red decrease, about 6.9% of slide height), Growth Expenses = (30) (red decrease, thinnest bar, about 1.7% of slide height), Other = (110) (red decrease), 2Q19 = 188 (blue total bar, top at about 77.5% from the top). Value labels sit above each bar in black. Estimated relative bar heights (no values printed): Margin bar about 26% of slide height, Downtime about 7%, Growth about 2%, Other about 6%, 2Q19 about 11%. No legend and no highlighted points beyond the blue totals versus red decreases. The baseline is a thin grey horizontal line at about 88.4% from the top spanning from about 2% to 45% across. Bars are flat with no outlines or shadows. Bar colours: blue #0D47A1 for totals, red #C00000 for decreases.
Slide 28
SECOND QUARTER IDENTIFIED ITEMS / (blank header cells) U/S D/S CHEM C&F TOTAL / U.S. GAAP earnings 3,261 451 188 (770) 3,130 / Non-U.S. tax item 487 (9) 2 25 505 / Earnings excluding identified items1 2,774 460 186 (795) 2,625 / Millions of dollars unless specified otherwise / 1 Earnings excluding identified items are earnings excluding significant (≥ $250 million) non-operational events. We believe this information is useful to assist investors in assessing the / performance of our ongoing business operations. / 28
Visuals: One table, no chart, photograph, logo or icon. Table columns: a blank row-label column, then U/S, D/S, CHEM, C&F, TOTAL. Rows: header row (blue band with white bold labels U/S, D/S, CHEM, C&F, TOTAL); row 1 U.S. GAAP earnings with values 3,261 / 451 / 188 / (770) / 3,130 in bold black; row 2 Non-U.S. tax item (indented) with values 487 / (9) / 2 / 25 / 505 in regular weight; row 3 Earnings excluding identified items (superscript 1) with values 2,774 / 460 / 186 / (795) / 2,625 in bold black. Thin dark grey horizontal rules separate rows 1 and 2 and rows 2 and 3, and a thicker blue rule closes the bottom of the table. No highlighted cells. Units stated: millions of dollars unless specified otherwise.
Slide 29
SUPPLEMENTAL INFORMATION
The following information provides a more detailed view of the factors portrayed on slides 7 and
21. “Other” includes Entitlements / Divestments and Demand / Other, below.
UPSTREAM VOLUME FACTOR ANALYSIS / 2Q19 vs. 2Q18 / 2Q19 vs. 1Q19
Prior Period / 3,647 / 3,981
Downtime / Maintenance / 45 / (100)
Growth / Decline / 175 / 120
Entitlements / Divestments / 10 / 5
Demand / Other / 30 / (100)
Current Period / 3,909 / 3,909
Koebd
29
Visuals: One table, titled 'UPSTREAM VOLUME FACTOR ANALYSIS', with a blue header band across the top. Columns: row label, '2Q19 vs. 2Q18', '2Q19 vs. 1Q19'. Rows: Prior Period 3,647 | 3,981 (bold); Downtime / Maintenance 45 | (100); Growth / Decline 175 | 120; Entitlements / Divestments 10 | 5; Demand / Other 30 | (100); Current Period 3,909 | 3,909 (bold). Parentheses denote negative values. No chart, photograph, logo or icon. Thin grey horizontal rules separate the body rows and a blue rule closes the table at the bottom.
Slide 30
SUPPLEMENTAL INFORMATION / 2Q19 1Q19 1H19 / Cash Flow from Operating Activities 6.0 8.3 14.3 / Proceeds Associated with Asset Sales 0.0 0.1 0.1 / Cash Flow from Operations and Asset Sales 6.0 8.4 14.4 / PP&E Adds / Investments & Advances1 (6.9) (5.9) (12.8) / Free Cash Flow2 (0.9) 2.5 1.6 / Billions of dollars unless specified otherwise / For information concerning the calculation of free cash flow for prior periods, see Frequently Used Terms on the Investors page of our website at www.exxonmobil.com / 2Q19 1Q19 1H19 / Cash Flow from Operating Activities 6.0 8.3 14.3 / Proceeds Associated with Asset Sales 0.0 0.1 0.1 / Cash Flow from Operations and Asset Sales 6.0 8.4 14.4 / Changes in Working Capital (1.2) 2.2 1.0 / Cash Flow from Operations and Asset Sales excluding Working Capital2 7.2 6.2 13.4 / Billions of dollars unless specified otherwise / 1 Includes PP&E Adds of ($6.2B) and net investments/advances of ($0.7B) for 2Q19; / includes PP&E Adds of ($5.2B) and net investments/advances of ($0.7B) for 1Q19; / includes PP&E Adds of ($11.4B) and net investments/advances of ($1.4B) for 1H19 / 2 See slide 32 for definition / 30
Visuals: Two tables with blue header bars and horizontal rules. Left table columns: row label, 2Q19, 1Q19, 1H19. Rows: Cash Flow from Operating Activities 6.0 / 8.3 / 14.3 (bold); Proceeds Associated with Asset Sales 0.0 / 0.1 / 0.1 (indented); Cash Flow from Operations and Asset Sales 6.0 / 8.4 / 14.4 (bold); PP&E Adds / Investments & Advances1 (6.9) / (5.9) / (12.8) (indented); Free Cash Flow2 (0.9) / 2.5 / 1.6 (bold). Right table columns: row label, 2Q19, 1Q19, 1H19. Rows: Cash Flow from Operating Activities 6.0 / 8.3 / 14.3 (bold); Proceeds Associated with Asset Sales 0.0 / 0.1 / 0.1 (indented); Cash Flow from Operations and Asset Sales 6.0 / 8.4 / 14.4 (bold); Changes in Working Capital (1.2) / 2.2 / 1.0 (indented); Cash Flow from Operations and Asset Sales excluding Working Capital2 7.2 / 6.2 / 13.4 (bold). No charts, photographs, logos or icons. Table cells contain no shading other than the blue header bar.
Slide 31
SUPPLEMENTAL INFORMATION
DOWNSTREAM EARNINGS
Billion USD
15
10
5
'00
'05
'10
'15
'18
CHEMICAL EARNINGS
Billion USD
6
4
2
'00
'05
'10
'15
'18
31
Visuals: Two vertical bar charts, both with blue bars on a white ground and a thin light-grey horizontal baseline; neither chart has a legend or highlighted points. Left chart: title DOWNSTREAM EARNINGS, unit Billion USD. Y axis labelled 5, 10 and 15 (0 at baseline, no unit label on the axis). X axis labelled '00, '05, '10, '15 and '18. 19 bars, one per year 2000 to 2018. Values are not printed; approximate values read from the bars are: 2000 about 3.3; 2001 about 4.1; 2002 about 1.2; 2003 about 3.4; 2004 about 5.6; 2005 about 7.9; 2006 about 8.4; 2007 about 9.5; 2008 about 8.1; 2009 about 1.7; 2010 about 3.5; 2011 about 4.4; 2012 about 13.1 (tallest bar); 2013 about 3.4; 2014 about 3.0; 2015 about 6.5; 2016 about 4.1; 2017 about 5.5; 2018 about 5.9. Right chart: title CHEMICAL EARNINGS, unit Billion USD. Y axis labelled 2, 4 and 6. X axis labelled '00, '05, '10, '15 and '18. 19 bars, one per year 2000 to 2018. Approximate values: 2000 about 1.2; 2001 about 0.9; 2002 about 0.85; 2003 about 1.5; 2004 about 3.5; 2005 about 4.0; 2006 about 4.4; 2007 about 4.6; 2008 about 3.0; 2009 about 2.3; 2010 about 4.9 (tallest bar); 2011 about 4.4; 2012 about 3.9; 2013 about 3.8; 2014 about 4.3; 2015 about 4.4; 2016 about 4.6; 2017 about 4.5; 2018 about 3.4. Bars are solid blue rectangles about 0.6 of their slot width, with square tops and no gridlines or data labels.
Slide 32
SUPPLEMENTAL INFORMATION
Definitions
Cash Flow from Operations and Asset Sales. Cash flow from operations and asset sales is the sum of the net cash provided by operating activities and proceeds associated with sales of subsidiaries, property, plant and equipment, and sales and returns of investments from the Summary statement of cash flows. This cash flow reflects the total sources of cash from both operating the Corporation’s assets and from the divesting of assets
Cash Flow from Operations and Asset Sales excluding Working Capital. This includes cash flow from operations and asset sales less changes in operational working capital excluding cash and debt. This measure is useful when comparing the underlying performance of our business across periods when there are significant period-to-period changes in working capital.
Free cash flow. Free cash flow is cash flow from operations and asset sales less additions to property, plant and equipment, and additional investments and advances, plus other investing activities, including collection of advances. This measure is useful when evaluating cash available for financing activities, including shareholder distributions, after investment in the business.
Project. The term “project” as used in this presentation can refer to a variety of different activities and does not necessarily have the same meaning as in any government payment transparency reports.
Resources, resource base, and recoverable resources. Along with similar terms used, these refer to the total remaining estimated quantities of oil and natural gas that are expected to be ultimately recoverable. ExxonMobil refers to new discoveries and acquisitions of discovered resources as resource additions. The resource base includes quantities of oil and natural gas that are not yet classified as proved reserves, but that are expected to be ultimately moved into the proved reserves category and produced in the future. The term “resource base” is not intended to correspond to SEC definitions such as “probable” or “possible” reserves. The term “in-place” refers to those quantities of oil and natural gas estimated to be contained in known accumulations and includes recoverable and unrecoverable amounts.
Returns, investment returns, project returns. Unless referring specifically to ROCE, references to returns, investment returns, project returns, and similar terms mean discounted cash flow returns based on current company estimates. Future investment returns exclude prior exploration and acquisition costs.
32
Download this deck
The hosted PDF of every library deck is free for readers of the SlideDeck Co newsletter. Join with your email and the viewer and download appear here.
Preparing a results presentation or business update of your own? The SlideDeck Co Standard Deck is a slide library for business reviews, updates and plans.







