
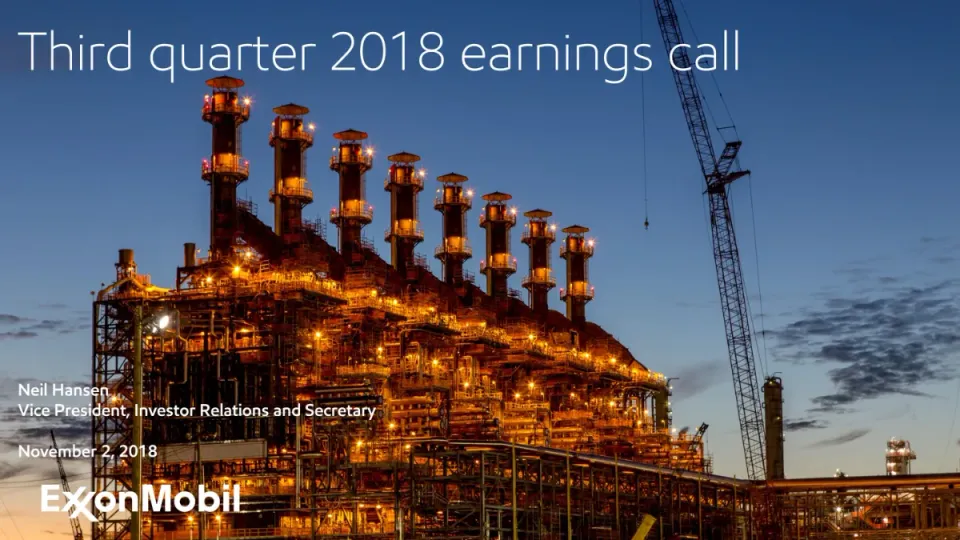
The deck opens with a title slide for the third quarter 2018 earnings call, presented by Neil Hansen, followed by a cautionary statement on forward-looking information. It then moves through a short summary of developments since the second quarter, a table of third quarter financial results, and a run of waterfall-style charts comparing Upstream, Downstream and Chemical earnings and volumes against both the prior quarter and the same quarter of 2017. A management perspectives section, led by Jack Williams, follows, covering the Downstream and Chemical growth plans, the Permian and Western Canadian integrated value chains, and other highlights. The deck closes with a Q&A slide, then supplemental information with footnotes and definitions of terms such as free cash flow and surplus cash. Slides worth seeing are the earnings bridges on slides 5 and 7, where each bar of the waterfall is labelled with a short headline and a bulleted explanation beside it, and the regional value chain maps on slides 18 and 19, which pair a simple graphic with a few figures.
Slides worth studying
- Slide 4: A compact financial highlights table with the current quarter boxed in blue makes the key comparison readable at a glance.
- Slide 5: The earnings waterfall pairs each bar with a short explanation in the margin, so the chart and its commentary read together.
- Slide 18: A map-style value chain diagram combined with a few headline figures turns a complex integrated business into one clear picture.
Details
- Company: ExxonMobil
- Year: 2018
- Type: Investor presentation
- Industry: Oil and gas
- Pages: 25
The hosted copy of this deck is being prepared. Newsletter readers will find the download here.
Review score: 8 out of 10, Strong
Presentation quality, judged with the SlideDeck Co review heuristic. Ask, evidence and idea merit are not rated here.
The decisive strength is that changes are explained on the page and each bar is accounted for: slide 5 pairs a waterfall from 3,040 to 4,229 with bullets that name every step, including 'Other includes net, absolute favorable one-time tax impacts of $370M in 3Q18', and slides 8, 10 and 12 do the same for volumes, Downstream and Chemical. Slide 4 puts 3Q18 beside 3Q17, 2Q18 and YTD with a box around the current quarter, and slide 3 sorts developments by segment, including the unfavorable ones such as weaker Chemical margins. The route is clearly divided: results to slide 13, a 'management perspectives' section from slide 14, then supplemental information from slide 23 with definitions and a note that the slide 18 chart reflects March projections that are not being re-affirmed. The bottleneck is finish and outlook: the axis labels on slides 5 and 8 run into the footer, titles are topic labels, and there is no stated next-quarter outlook, only plan charts such as the one on slide 18 drawn at small size.
Worth keeping: Keep the chart-plus-explanation pairing in which each bar, including 'Other', gets its own bullet, as on slides 5, 10 and 12.
Most useful repair: Lift the waterfall axis labels clear of the footer on slides 5 and 8 and add one next-quarter outlook slide before slide 14.
What would change the score: If the slides seen only on contact sheets (for example 6, 7, 9 and 11) leave bars unexplained where the readable ones do not, the score would drop to 7.
Confidence high. 25 of 25 pages inspected on contact sheets, 12 at readable size. Reviewed 2026-11-15. Model-assisted review (claude-fable-5-2, in session).
Full text of the slides (25 slides)
Every slide's words and a description of its charts and images, so the deck can be searched and rebuilt. Also available as Markdown.
Slide 1
Third quarter 2018 earnings call
Neil Hansen
Vice President, Investor Relations and Secretary
November 2, 2018
ExxonMobil
Visuals: Full-bleed photograph of an industrial gas processing plant at dusk. Nine tall vertical stacks with round caps and illuminated platforms run in a row across the centre-left, sitting on a dense lattice of pipes, scaffolding, walkways and lit vessels. A tall lattice crane with a hanging cable and hook stands on the right, and a short column and a small lit tower sit at the far right edge. A pipe runs horizontally across the lower right. Lighting is warm amber and orange from the plant's lamps and flares against a deep blue dusk sky that lightens to orange near the horizon at the lower left. Wispy dark clouds are on the right. Composition is a wide landscape frame with the plant filling the lower two-thirds and the sky the upper third. The image is cropped at the edges and is not boxed. No overlay or tint is visible beyond a slight darkening of the sky.
Slide 2
Cautionary statement
Statements of future events or conditions in this presentation or the subsequent discussion period are forward-looking statements. Actual future
results, including financial and operating performance; demand growth and mix; ExxonMobil’s volume/production growth and mix; the amount and
mix of capital expenditures; resource recoveries; production rates; rates of return; development costs; project plans, timing, costs, and capacities;
drilling programs and efficiency improvements; product sales and mix; dividend and share purchase levels; cash and debt balances; corporate and
financing expenses; and the impact of technology could differ materially due to a number of factors including changes in oil or gas prices or other
market or economic conditions affecting the oil, gas, and petrochemical industries and the demand for our products; reservoir performance; the
outcome and timing of exploration and development projects; timely completion of construction projects; war and other political or security
disturbances; changes in law or government regulation, including trade, sanctions, tax and environmental regulations; the outcome of commercial
negotiations; the impact of fiscal and commercial terms; opportunities for investments or divestments that may arise; the actions of competitors and
customers; the outcome of future research efforts; unexpected technological developments; unforeseen technical difficulties; and other factors
discussed here and under the heading "Factors Affecting Future Results" in the Investors section of our web site at exxonmobil.com. Any forward-
looking statements regarding future earnings, cash flows, returns, volumes, new projects, or market strategies are as of the March 7, 2018 Analyst
Meeting except as specifically updated on this webcast. All forward-looking statements are based on management’s knowledge and reasonable
expectations and we assume no duty to update these statements as of any future date.
Forward-looking statements in this release regarding future earnings, cash flows, returns, volumes, new projects, or market strategies refer to plans
outlined at ExxonMobil’s Analyst Meeting held on March 7, 2018. The growth figures presented at that meeting are not forecasts of actual future
results but were intended to help quantify future potential and goals of management plans and initiatives. See the complete March 7, 2018
presentation available in archive form (including the Cautionary Statement and Supplemental Information included with that presentation) on the
Investors page of our website at www.exxonmobil.com for more detailed information. That material includes a description of the assumptions
underlying these potential growth estimates including a flat real oil price of $60 Brent per barrel (which is not intended to be a forecast of future
prices), downstream and chemical margins consistent with 2017 levels, and future gas prices consistent with our internal company plans, as well as a
reconciliation of adjusted 2017 earnings used as a baseline.
ExxonMobil third quarter 2018 earnings call
2
ExxonMobil
Exxon Mobil Esso Mobil 1
Visuals: A full-bleed, light-grey industrial illustration sits behind the text across the lower part of the slide: silhouettes of refinery towers, storage tanks, pipelines, flare stacks, pylons and tanker trucks, drawn in pale grey tones with low contrast. The illustration is not photographic and is not tinted or overlaid. Logos: ExxonMobil wordmark bottom-left in red and blue; at bottom-right the Exxon wordmark (red), Mobil wordmark (red), Esso oval roundel (blue outline, red letters) and Mobil 1 logo (red with black square). No charts, tables or diagrams.
Slide 3
Developments since second quarter 2018
Corporate
Strongest cash flow from operating activities since third quarter 2014
Lower corporate charges due to net favorable one-time items of $420M
Upstream
Brent and WTI increased by $0.92 and $1.71, respectively
17% growth in Permian tight oil relative to second quarter
Lower downtime and improved performance in Canada
Significant progress in Guyana and Brazil
Downstream
Fuels margins strengthened in North America and Europe
Captured value from Permian and Canadian differentials with logistics and manufacturing integration
Utilization improved due to lower scheduled maintenance and better reliability
Start-up of Beaumont hydrofiner and Antwerp delayed coker
Chemical
Weaker margins due to higher feedstock costs, primarily U.S. ethane, outpacing realizations
Results impacted by Singapore scheduled turnaround
Start-up of 1.5MT Baytown steam cracker
ExxonMobil third quarter 2018 earnings call
3
ExxonMobil
Exxon Mobil Esso Mobil 1
Visuals: Background photograph: faint grey silhouette of offshore platform structures (cranes, legs, deck modules, bridge trusses) across the bottom third and a crane arm at the far right edge, rendered in pale grey at low opacity, not cropped, full-bleed behind all elements. No charts, tables, or photographs within the content area. Logos: ExxonMobil wordmark in red at bottom left; Exxon, Mobil, Esso (blue oval), and Mobil 1 logos at bottom right. Bands behind the upper and lower text rows are flat light blue fills; the top and bottom bars are flat dark blue fills.
Slide 4
Third quarter 2018 financial results
Financial Highlights 3Q18 3Q17 2Q18 YTD
Earnings 6.2 4.0 4.0 14.8
Earnings Per Share – Diluted (dollars) 1.46 .93 .92 3.47
Cash Flow from Operations and Asset Sales1 12.6 8.4 8.1 30.6
CAPEX 6.6 6.0 6.6 18.1
Free Cash Flow2 7.2 5.0 2.7 16.5
Shareholder Distributions 3.5 3.3 3.5 10.3
Debt 40.0 40.6 41.2 40.0
Cash 5.7 4.3 3.4 5.7
Billions of dollars unless specified otherwise
1 Includes Proceeds Associated with Asset Sales; see slide 13 for reconciliation and Supplemental Information for definition
2 See Supplemental Information for reconciliation and definition
ExxonMobil
ExxonMobil third quarter 2018 earnings call
4
Exxon Mobil Esso Mobil 1
Visuals: Table: 'Financial Highlights' with columns 3Q18, 3Q17, 2Q18 and YTD. Rows: Earnings 6.2 / 4.0 / 4.0 / 14.8; Earnings Per Share – Diluted (dollars) 1.46 / .93 / .92 / 3.47; Cash Flow from Operations and Asset Sales (footnote 1) 12.6 / 8.4 / 8.1 / 30.6; CAPEX 6.6 / 6.0 / 6.6 / 18.1; Free Cash Flow (footnote 2) 7.2 / 5.0 / 2.7 / 16.5; Shareholder Distributions 3.5 / 3.3 / 3.5 / 10.3; Debt 40.0 / 40.6 / 41.2 / 40.0; Cash 5.7 / 4.3 / 3.4 / 5.7. Values are in billions of dollars unless specified otherwise. The 3Q18 column is outlined by a thin steel-blue rectangle running from the header to below the Cash row. Faint grey offshore drilling platform silhouettes sit behind the lower-right of the table and footer. Logos: ExxonMobil (footer left), and Exxon, Mobil, Esso and Mobil 1 (footer right).
Slide 5
Upstream earnings – 3Q18 vs. 2Q18
Millions of Dollars
4,229
470
3,040
320
270
130
2Q18
Price
Volume - Downtime
Volume - Other
Other
3Q18
Liquids growth contributed to stronger earnings
• Crude realizations flat; gas prices up 7%
• Permian and Western Canadian logistics value in Downstream
• Lower scheduled downtime, primarily in Canada; absence of PNG earthquake impacts
• Other volume reflects liquids growth
• Other includes net, absolute favorable one-time tax impacts of $370M in 3Q18
ExxonMobil third quarter 2018 earnings call
5
Visuals: Chart: waterfall (bridge) column chart titled 'Millions of Dollars' with no visible axis tick labels or value axis; the baseline is a thin dark grey horizontal axis line under the bars. Categories left to right: 2Q18 (blue total bar, value 3,040), Price (green floating bar, +270), Volume - Downtime (green floating bar, +130), Volume - Other (green floating bar, +320), Other (green floating bar, +470), 3Q18 (blue total bar, value 4,229). Each value is printed in bold black above its bar. Totals are solid blue bars rising from the baseline; increments are green floating bars stepping upward between totals. No legend. No highlighted points beyond colour coding of totals versus increments. Background decoration: light grey (about #D9D9D9) silhouettes of oil industry equipment, including a tall drilling derrick in the centre-left of the chart area (about x 26 to 30%, y 56 to 92%), a row of storage tanks and refinery structures along the bottom left (about x 8 to 45%, y 88 to 100%), and two pump jacks in the lower right (about x 56 to 78%, y 75 to 100%). Silhouettes are semi-transparent light grey, cropped by the bottom edge. Logos: ExxonMobil wordmark in red at bottom left; at bottom right, the Exxon wordmark in red, Mobil in blue, the Esso oval logo (blue oval with red-outlined white text), and the Mobil 1 logo (blue text with a black square containing a white 1).
Slide 6
Upstream volumes – 3Q18 vs. 2Q18 / koebd / 3,647 / (30) / 90 / 80 / 3,786 / Liquids: -40 / Gas: +10 / Liquids: +30 / Gas: +60 / Liquids: +85 / Gas: -5 / Entitlements / Divestments / Downtime / Maintenance / Growth / Decline / Other / 2Q18 / 3Q18 / Volumes up 5%, excluding entitlements and divestments, with value-focused growth and improved operations / • Liquids increased 3% (74 kbd) / • Natural gas up 5% (65 koebd) / • Liquids growth more than offset decline, driven primarily by Permian and improved performance at Kearl / • Natural gas increased with lower downtime in LNG portfolio / ExxonMobil / ExxonMobil third quarter 2018 earnings call / 6 / Exxon Mobil Esso Mobil 1
Visuals: Waterfall (bridge) chart, unit koebd (thousands of oil-equivalent barrels per day), no y-axis or gridlines shown, with a horizontal baseline. Bars left to right: 2Q18 total 3,647 (blue, full bar from baseline up to 3,647); Entitlements / Divestments (30) (red floating bar, sub-labels Liquids: -40 and Gas: +10); Downtime / Maintenance 90 (green floating bar, sub-labels Liquids: +30 and Gas: +60); Growth / Decline / Other 80 (green floating bar, sub-labels Liquids: +85 and Gas: -5); 3Q18 total 3,786 (blue full bar). Bar heights are proportional to values, the 2Q18 and 3Q18 totals are the tallest bars with the step bars floating between them. No legend and no highlighted points beyond the colour coding (red for decrease, green for increase, blue for totals). Behind the chart is a faint grey silhouette of an oil drilling derrick and a refinery or plant along the bottom edge.
Slide 7
Upstream earnings – 3Q18 vs. 3Q17 / Millions of Dollars / 2,580 / (80) / 130 / 30 / 4,229 / 1,567 / 3Q17 / Price / Volume - / Downtime / Volume - / Other / Other / 3Q18 / Captured benefit from higher commodity prices / • Crude realizations up 41%, gas prices rose 30% / • Permian and Western Canadian logistics value in / Downstream / • Downtime impacts resulting from carry-over of / 2Q18 Syncrude outage / • Other volume driven by growth and favorable / portfolio mix, partly offset by lower entitlements / ExxonMobil third quarter 2018 earnings call / 7 / ExxonMobil / Exxon / Mobil / Esso / Mobil 1
Visuals: Waterfall bar chart titled 'Millions of Dollars' with a horizontal baseline and no numeric y-axis or gridlines. Six bars left to right: 3Q17 total 1,567 (blue bar, labelled 1,567 above); Price increase 2,580 (green floating bar from about 1,567 to about 4,147, labelled 2,580 above); Volume - Downtime (80) (short red bar, labelled (80) above); Volume - Other 130 (short green bar, labelled 130 above); Other 30 (thin green bar, labelled 30 above); 3Q18 total 4,229 (blue bar, labelled 4,229 above). Bar heights are proportional to values; the 3Q17 and 3Q18 totals are about 1,567 and 4,229 respectively. No legend. No highlighted points beyond colour coding of increases (green) and decrease (red). Behind the chart in the centre is a pale grey silhouette of an oil drilling derrick and a refinery skyline along the bottom edge.
Slide 8
Upstream volumes – 3Q18 vs. 3Q17 / koebd / 3,878 / (155) / (20) / 85 / 3,786 / Liquids up 6%, excluding entitlements and divestments, with 57% growth in Permian / Gas decline mostly in U.S. unconventional; aligned with value focus / Lower entitlements with higher prices; portfolio highgraded through divestments / Increase in downtime driven by carry-over of 2Q18 Syncrude outage / Growth in Permian / Bakken, Hebron and improved performance at Kearl more than offset liquids decline in mature assets / Entitlements / Divestments / Liquids: -125 / Gas: -30 / Downtime / Maintenance / Liquids: -25 / Gas: +5 / Growth / Decline / Other / Liquids: +155 / Gas: -70 / 3Q17 / Entitlements / Divestments / Downtime / Maintenance / Growth / Decline / Other / 3Q18 / ExxonMobil third quarter 2018 earnings call / 8
Visuals: Waterfall bar chart titled 'koebd' (thousand oil-equivalent barrels per day), with no printed axis or scale and no legend apart from in-bar labels. Bars left to right: 3Q17 total bar, value 3,878, solid blue; Entitlements/Divestments decrease, value (155), a stacked red bar with an upper dark red segment labelled 'Entitlements' and a lower lighter red-coral segment labelled 'Divestments', with sub-labels 'Liquids: -125' and 'Gas: -30'; Downtime/Maintenance decrease, value (20), a thin dark red bar with sub-labels 'Liquids: -25' and 'Gas: +5'; Growth/Decline/Other increase, value 85, a green bar with sub-labels 'Liquids: +155' and 'Gas: -70'; 3Q18 total bar, value 3,786, solid blue. Bars sit on a thin dark grey baseline. Behind the chart, a faint light-grey silhouette of an oil derrick and refinery structures fills the lower left, partly behind the bars and footer. No other data points are highlighted.
Slide 9
Downstream earnings – 3Q18 vs. 2Q18
Millions of Dollars
170
1,642
460
140
150
724
2Q18
Margin
Downtime /
Maintenance
Forex
Other
3Q18
Higher earnings with improved operations; maximized
value from Permian and Western Canadian integration
•
Captured Permian and Western Canadian differentials with logistics
and manufacturing integration
•
Lower scheduled maintenance and improved reliability
•
Absence of unfavorable forex
•
Other items include improved yield / mix and minor asset sales gains
ExxonMobil
ExxonMobil third quarter 2018 earnings call
9
Exxon Mobil Esso Mobil 1
Visuals: Waterfall (bridge) chart titled 'Millions of Dollars' with no y-axis or gridlines shown; values are printed on each bar. Categories left to right: 2Q18 = 724 (total bar, blue); Margin = +150 (green floating bar); Downtime / Maintenance = +460 (green floating bar, the largest increment); Forex = +140 (green floating bar); Other = +170 (green floating bar); 3Q18 = 1,642 (total bar, blue). The floating bars step up from the 2Q18 top, and each bar's top meets the next one's base. A thin dark-grey horizontal baseline runs under the bars. No legend and no highlighted points beyond the colour split between totals (blue) and increments (green). Behind the chart is a full-slide, very light grey silhouette photograph/illustration of an industrial refinery with towers, tanks, pipe racks and a ship at the bottom, rendered faint and not overlaid by a tint beyond its pale grey tone.
Slide 10
Downstream earnings – 3Q18 vs. 3Q17 / Millions of Dollars / 1,532 / (110) / (10) / 230 / 1,642 / 3Q17 / Margin / Downtime / Maintenance / Other / 3Q18 / Maximized integration; weaker non-U.S. margins / • Lower fuels and lubricants margins (Europe and Asia Pacific); absence of Hurricane Harvey, offset with benefit from Permian and W. Canadian differentials / • Downtime due to higher maintenance, offset by absence of Hurricane Harvey / • Other items include lower U.S. tax rate, minor asset sales gains, and improved yield / mix / ExxonMobil / ExxonMobil third quarter 2018 earnings call / 10 / Exxon Mobil Esso Mobil 1
Visuals: Waterfall (bridge) chart titled 'Millions of Dollars' in the upper-left of the chart area, with a thin grey horizontal baseline. Values in millions of dollars, no printed value axis or scale. Bars left to right: 3Q17 total bar blue with value label 1,532; Margin floating bar red with label (110), dropping from 1,532; Downtime / Maintenance thin red floating bar with label (10); Other floating green bar with label 230, rising; 3Q18 total bar blue with label 1,642. Bar heights are proportional to values: the totals are drawn from the baseline up to the top at about 35% of height, the Other bar sits above the Margin and Downtime bars. No legend and no highlighted points beyond colour coding of increases (green) and decreases (red). Behind the chart and the whole slide is a faint light-grey watermark silhouette of refinery towers, distillation columns, storage tanks, pipes and a tanker-truck at the bottom, low contrast, full-bleed. Brand logos at bottom-left and bottom-right in red and blue.
Slide 11
Chemical earnings – 3Q18 vs. 2Q18
Millions of Dollars
890
(20)
40
(140)
(60)
713
2Q18
Margin
Sales
Downtime /
Maintenance
Other
3Q18
Sales growth of higher-value products; increased planned maintenance
•
Weaker PE margins with higher ethane prices, mostly offset by stronger aromatics margins
•
Sales volume growth driven by higher PE demand
•
Downtime mainly due to Singapore turnaround
•
Other items include unfavorable forex
ExxonMobil
ExxonMobil third quarter 2018 earnings call
11
Exxon Mobil Esso Mobil 1
Visuals: Waterfall chart. Title: 'Millions of Dollars' (centred above the chart, about 18% to 32% horizontally, 24% to 28% vertically). Category axis labels along a horizontal baseline at about 86% from the top, spanning about 3.7% to 46.7% horizontally; no value axis is shown. Bars, left to right, with printed values: 2Q18 solid blue bar, value 890, from baseline up to about 45% from top; Margin red floating bar, value (20), a thin bar just below 890 level; Sales green floating bar, value 40, rising above the Margin level; Downtime / Maintenance red floating bar, value (140), about 44% to 51% from top; Other red floating bar, value (60), about 51% to 56% from top; 3Q18 solid blue bar, value 713, top at about 53% from top. Values are printed above each bar in bold black Calibri-style type. Bar colours: blue #0F4AA0 for totals, red #C00000 for negatives, green #00A03C for the positive bar. No legend. No highlighted points beyond the colour coding. Bars are flat with no shadows or gradients.
Slide 12
Chemical earnings – 3Q18 vs. 3Q17 / Millions of Dollars / 1,092 / (140) / 30 / (90) / (180) / 713 / 3Q17 / Margin / Sales / Downtime / / Maintenance / Other / 3Q18 / Weaker margins; positioning for growing demand / • Lower margins with higher feed and energy costs outpacing improved realizations / • Sales volume growth from new assets / • Downtime mainly due to Singapore turnaround, partly offset by absence of Hurricane Harvey / • Other includes opex for new assets and projects, and unfavorable forex / ExxonMobil / ExxonMobil third quarter 2018 earnings call / 12 / Exxon / Mobil / Esso / Mobil 1
Visuals: Waterfall chart titled 'Millions of Dollars' (caption above the chart, no separate legend). It has no y-axis scale or gridlines; a single thin dark grey horizontal baseline runs under the bars. Categories left to right: 3Q17 (value 1,092, blue bar, full height from baseline), Margin (140, red floating bar, decrease), Sales (30, green floating bar, increase, thin), Downtime / Maintenance (90, red decrease), Other (180, red decrease, tallest red bar), 3Q18 (713, blue total bar). Each bar carries its value label above it in bold black. No highlighted points beyond colour coding. Behind the chart and footer is a faint light grey silhouette illustration of an oil refinery and industrial site (flare stacks, pipes, distillation columns, tanks, pipelines, and tanker trucks) spanning the bottom third of the slide at low contrast.
Slide 13
2018 sources and uses of cash
3Q18
YTD
Beginning Cash
3.4
3.2
Earnings
6.2
14.8
Depreciation
4.7
13.7
Working Capital / Other
0.2
(1.1)
Cash Flow from Operating Activities
11.1
27.4
Proceeds Associated with Asset Sales
1.5
3.2
Cash Flow from Operations and Asset Sales
12.6
30.6
PP&E Adds / Investments and Advances1
(5.4)
(14.1)
Shareholder Distributions
(3.5)
(10.3)
Debt / Other Financing
(1.4)
(3.7)
Ending Cash
5.7
5.7
Billions of dollars unless specified otherwise
1 Includes PP&E Adds of ($5.2B) and net investments/advances of ($0.2B) for 3Q18; includes PP&E Adds of ($13.5B) and net investments/advances of ($0.6B) for YTD18
ExxonMobil
ExxonMobil third quarter 2018 earnings call
13
Exxon Mobil Esso Mobil 1
Key Themes
• Strongest cash flow from operating activities since 3Q14
• Cash flow from operations and asset sales used for investments, shareholder distributions, and debt reduction
• Proceeds associated with asset sales includes 4Q18 Germany retail divestment
• Higher ending cash balance driven by timing of asset sale proceeds
Visuals: Table with three columns (row label, 3Q18, YTD) and 13 rows. Header row: blank, 3Q18, YTD. Rows: Beginning Cash 3.4 / 3.2 (blue band); Earnings 6.2 / 14.8; Depreciation 4.7 / 13.7 (light grey-blue band); Working Capital / Other 0.2 / (1.1); Cash Flow from Operating Activities 11.1 / 27.4 (blue band); Proceeds Associated with Asset Sales 1.5 / 3.2; Cash Flow from Operations and Asset Sales 12.6 / 30.6 (blue band); PP&E Adds / Investments and Advances (superscript 1) (5.4) / (14.1); Shareholder Distributions (3.5) / (10.3) (light band); Debt / Other Financing (1.4) / (3.7); Ending Cash 5.7 / 5.7 (blue band). Numbers are bold blue for the banded rows and bold blue for the others as printed. Background illustration: a faded light-grey (about #E4E6E9) outline silhouette of an offshore oil platform with derricks, cranes, and legs spanning the lower right and bottom of the slide, behind the table, rule and footer, not cropped at the bottom edge.
Slide 14
Third quarter 2018
management perspectives
Jack Williams
Senior Vice President
ExxonMobil
Visuals: Full-bleed photograph of a waterfront petrochemical or refinery complex. In the centre-right stand tall steel scaffold towers, distillation columns and pipe racks, with a silver spherical storage tank at left-centre and a cargo ship moored at far left. A red construction crane edge sits at the far right. A concrete quay runs across the middle distance and dark grey-blue water fills the bottom fifth. The sky is pale blue with grey-white cumulus clouds. Lighting is soft, low-angle daylight. Dominant colours are steel grey, pale blue, muted white and dark teal water, with red accents on the crane and small buildings. The image is uncropped and full-bleed with no overlay or tint. The white ExxonMobil wordmark is a logo at bottom left.
Slide 15
Reconnect to March Analyst Meeting - Downstream / Proprietary technology / Six refining investments growing higher value products / Underpinned by catalyst and process technology / Strong portfolio with > 20% return / Antwerp coker and Beaumont hydrofiner start-up / Rotterdam hydrocracker start-up ~ year-end / Higher-value products / Capturing integrated Permian advantage / Progressing Beaumont light crude expansion / Advancing Permian logistics / Integrated Permian advantage / See Supplemental Information / ExxonMobil / ExxonMobil third quarter 2018 earnings call / 15 / Exxon / Mobil / Esso / Mobil 1
Visuals: Full-bleed light grey refinery silhouette in the background, showing distillation columns, flare stacks, storage tanks, pipework and tanker trucks, with the lower half most visible and the upper area mostly white. It is a flat monochrome illustration with no photographic detail, drawn in pale grey tones with about 25% opacity. A thin navy vertical line (about 1 pt) divides the left and right columns. Logos: ExxonMobil wordmark (red Exxon with a stylised X and navy-grey Mobil) at bottom left; Exxon (red), Mobil (blue), Esso (blue oval with red text) and Mobil 1 (blue text with a black square containing a white 1) at bottom right.
Slide 16
Reconnect to March Analyst Meeting - Chemical
40% capacity growth AP & NA
13 new world-class facilities
Growing performance / products
• 13 new investments strengthen product leadership
– Underpinned by catalyst and performance product technology
– 7 of 13 new facilities now operating
– Baytown steam cracker started up early 3Q
• Growing capacity 40% by 2025 in Asia and North America
– Leveraging global market access and advantaged feed
– Announced agreement for chemical complex in China
ExxonMobil
ExxonMobil third quarter 2018 earnings call
16
Exxon Mobil Esso Mobil 1
Visuals: Full-bleed faint grey silhouette illustration of a petrochemical plant across the lower half of the slide: vertical columns and cylindrical distillation towers, pipe networks, cooling structures, storage tanks and a flare-like tower at left, with a ship or jetty structure at lower right. The silhouette is light grey (about #E3E3E3 to #D0D0D0) and sits behind all text with no overlay. Non-text logos: ExxonMobil wordmark at bottom left in red and blue; at bottom right Exxon in red, Mobil in blue, Esso in a blue oval with red lettering, and Mobil 1 in blue with a black-and-white box.
Slide 17
Antwerp delayed coker / • 50 KBD coker advantaged versus industry / – Scale: regional coker for Europe optimization / – Cost: integration with Antwerp site / – Logistics: located near manufacturing center / • Positioned well for IMO 2020 / – Leverage global conversion capacity / – Increased distillate and marine gas oil / – Enables feed flexibility / Slagen / Rotterdam / Fawley / 3rd Party / Gravenchon / Antwerp / Fos / Augusta / ExxonMobil / ExxonMobil third quarter 2018 earnings call / 17 / Exxon Mobil Esso Mobil 1
Visuals: Map: a grey (#9E9E9E) outline map of Europe with white national borders and a white sea/background, showing the UK, Ireland, Iberia, France, Italy, Germany, Scandinavia and the Balkans; it fills a rectangle about x 9 y 20 w 32 h 59 and is not boxed. Map markers: small black factory icons (#000000) with a black leader arrow to each label at Slagen (northern Scandinavia-side coast), Rotterdam (Low Countries), Fawley (southern England), Gravenchon (northern France), Fos (southern France), and Augusta (Sicily); a 3rd Party marker is a thin outlined label box with a black arrow that bends to point at the Gravenchon-area site. The Antwerp site is marked by a blue factory icon (#4A90D9) at about x 21 y 47 with a thick light-blue (#5B9BD5) curved arrow rising from the Antwerp caption box to the icon. Photograph: an industrial refinery at dusk-like daylight, showing a dense cluster of tall distillation columns, vessels, pipes and stairways seen from a low angle, with a blue-grey sky and a grey-green cast; it is a rectangular unbordered photo at about x 22.6 y 45.6 w 6.7 h 9.0 with a thin black frame, sitting directly above the Antwerp caption box. No legend, no chart values. Background silhouette: a faint light-grey (#E3E3E3) refinery and ship skyline runs along the bottom of the slide behind the footer.
Slide 18
Permian integrated value chain
Permian1 and Bakken production
KOEBD net
800
Actual Production
High-side flexibility
600
Permian/Bakken prod.
34% increase vs. 3Q17
400
200
0
Jan '15
'17
'19
'21
'23
'25
1Midland and Delaware Basins only
Integrated Permian1 and Bakken earnings2
$60/bbl, Refining / Chemical margins @ '17 actual
Billion USD
6
Downstream & Chemical
Upstream
0
2018
2019
'20-'24 Avg
2025
1Midland and Delaware Basins only
2See Supplemental Information
ExxonMobil
ExxonMobil third quarter 2018 earnings call
18
Exxon Mobil Esso Mobil 1
•
Advantaged Upstream growth (>1.6M net acres)
–
Average 3Q Permian net production 170 KOEBD
•
Optimizing Midstream with USGC manufacturing
–
Leveraging Downstream footprint and Upstream position
–
Strategically securing transportation commitments; currently at 270 KBD
–
450 KBD light crude capacity growing to >750 KBD
•
Global market access with export capability
–
Processed worldwide at 13 equity sites, including Singapore crude cracker
Visuals: 1) Line-and-area chart titled 'Permian1 and Bakken production', unit KOEBD net, y-axis 0 to 800 in steps of 200, x-axis Jan '15 to '25 with ticks at '17, '19, '21, '23, '25. Series A: 'Actual Production' red line (#E31B23), about 100 KOEBD at Jan '15, about 200 by '17, rising to about 320 at the last point near '18.5; annotated 'Permian/Bakken prod. 34% increase vs. 3Q17' with a thin grey leader line. Series B: green filled area (#00875A) under a lighter mint band (#CDEBDD) labelled 'High-side flexibility'; the green rises from about 100 at Jan '15 to about 750 by '25 with a flattening S-curve; the mint band sits about 30 to 50 KOEBD above it. Footnote '1Midland and Delaware Basins only'. No legend box; the legend entry 'Actual Production' sits top-centre with red line sample. 2) Stacked bar chart titled 'Integrated Permian1 and Bakken earnings2', subtitle '$60/bbl, Refining / Chemical margins @ '17 actual', unit Billion USD, y-axis 0 to 6 (ticks 0 and 6 printed). Categories 2018, 2019, '20-'24 Avg, 2025. Two stacks: Upstream dark blue (#0E4595) at the bottom, Downstream & Chemical light blue (#7FA2D6) on top. No values printed; approximate values: 2018 Upstream about 0.8, total about 1.5; 2019 Upstream about 1.7, total about 2.7; '20-'24 Avg Upstream about 3.3, total about 5.1; 2025 Upstream about 4.0, total about 6.2. Series labels 'Downstream & Chemical' and 'Upstream' sit to the right with thin leader lines. Footnotes '1Midland and Delaware Basins only' and '2See Supplemental Information'. No highlighted points. 3) Background illustration of a faded grey refinery and tanker silhouette across the whole slide. 4) Logos: ExxonMobil wordmark (red and blue) bottom left; at bottom right Exxon (red/blue wordmark), Mobil (red wordmark), Esso (blue oval with red text), Mobil 1 (red and blue box with white 1).
Slide 19
Western Canadian integrated value chain
Western Canadian crude placement
Equity Production / Heavies: Kearl, Cold Lake / Lights: Syncrude
Syncrude
Strathcona
Sarnia
Joliet
Baton Rouge
Baytown
Beaumont
Edmonton Rail Terminal
• Equity production 360 KBD
• Manufacturing capacity >500 KBD
– Canada: Strathcona and Sarnia
– Midwest: Joliet, Billings
– USGC: Baytown, Baton Rouge, Beaumont
• Advantaged logistics with Edmonton Rail Terminal
• Export capacity provides global market access
– Processed worldwide at 8 equity sites
ExxonMobil
ExxonMobil third quarter 2018 earnings call
19
Exxon Mobil Esso Mobil 1
Visuals: A schematic map of North America in light grey (#C8C8C8) with white state and province borders, filling the upper-left area. Black factory-cluster icons mark Syncrude, Strathcona, Sarnia and Joliet, and a black rail-train icon marks the Edmonton rail terminal. A small black arrow points from the train icon up to the Edmonton Rail Terminal photograph. Solid black arrows run from Strathcona toward Sarnia and Joliet, and from the Syncrude and Strathcona sites toward the lower-left; black dashed lines (double-dash style, about 2 px) represent pipelines from Edmonton down to the Gulf Coast inset. A black-outlined ellipse (about 2.5 px stroke) encloses an inset of Texas in yellow (#F5D000) and Louisiana in orange (#E8862A), with the words Austin (small serif, black) and Baton Rouge (tiny serif, black) printed on the shapes. Three blue industrial-plant icons (#1F7BD0) sit inside the inset, and a single blue plant icon sits on the Louisiana coast; short black leader arrows point from them to the Baytown, Beaumont and Baton Rouge labels. The Edmonton Rail Terminal photograph is an aerial daytime photo of an oval-track rail yard with grey gravel and dark tracks, showing a tan and grey ground surface, framed as a small boxed rectangle with a thin black border and no crop beyond the rectangle. Logos: ExxonMobil wordmark in red (#E31937) with black-and-white outline (bottom-left); Exxon, Mobil, Esso (in a blue oval with red text) and Mobil 1 (in a black box with white numeral) in the bottom-right corner. Behind the footer there is a faint grey silhouette of refinery and industrial structures across the full width.
Slide 20
Chemical growth
Product leadership position
- New facility
Polyethylene
Differentiated polyethylene
Fluids / plasticizer
Propylene-based plastomer1
Adhesions
Synthetics
TPV
Butyl rubber
Lube & fuel additives
EPDM
Aromatics
Source: HIS, unless noted
1ExxonMobil estimates based on available data
7 of 13 investments online and operational ~5 MTA
– Strengthening product leadership position
Baytown operational – scale and integration advantage
Corpus Christi steam cracker on schedule, start-up planned 2022
Announced agreement for chemical complex in China
Growing performance products
– ~30% of sales
– ~2x growth versus commodity
– ~30% average uplift versus commodity
ExxonMobil
ExxonMobil third quarter 2018 earnings call
20
Exxon Mobil Esso Mobil 1
Visuals: Table: 11 rows by 3 columns with no header row. Column 1 product name, column 2 count of facilities (number), column 3 red star marking a new facility where present. Rows in order: Polyethylene 1 star; Differentiated polyethylene 1 star; Fluids / plasticizer 1 no star; Propylene-based plastomer1 1 no star; Adhesions 1 star; Synthetics 1 no star; TPV 1 star; Butyl rubber 1 star; Lube & fuel additives 2 no star; EPDM 2 star; Aromatics 2 star. Odd rows shaded light blue, even rows white. Legend above the star column: red star followed by '- New facility'. Background at lower part: faded grey silhouette of a refinery with tall columns, towers, pipes, storage tanks and a ship, spanning the bottom half, rendered in very pale grey, behind text and table. Footer brand logos: ExxonMobil wordmark in red and blue, and Exxon, Mobil, Esso (blue oval with red text) and Mobil 1 (red and black box) in red and blue.
Slide 21
Other highlights / Upstream / Brazil 5th pre-salt bid round success: 26 blocks (2.3M net acres) 66% operated / Guyana 9th discovery offshore at Hammerhead, 4th discovery year to date / Growth in profitable Permian production; up 57% vs 3Q17 / Angola Block 32 Kaombo FPSO Norte achieved first oil / Downstream / Indonesia: transition of lubes acquisition progressing well / Mexico: retail site streaming on target / Divestment of Germany retail completed October 1st / Augusta Refinery and Terminals divestment on schedule for 4Q18 / Chemical / Newport Santoprene expansion start-up / Beaumont PE expansion on track for mid-2019 start-up / ExxonMobil third quarter 2018 earnings call / 21 / ExxonMobil / Exxon / Mobil / Esso / Mobil 1
Visuals: Table-style structure with three row groups. Column 1 holds bold row labels: Upstream, Downstream, Chemical. Column 2 holds bullet lists. Upstream rows (4): Brazil 5th pre-salt bid round success: 26 blocks (2.3M net acres) 66% operated; Guyana 9th discovery offshore at Hammerhead, 4th discovery year to date; Growth in profitable Permian production; up 57% vs 3Q17; Angola Block 32 Kaombo FPSO Norte achieved first oil. Downstream rows (4): Indonesia: transition of lubes acquisition progressing well; Mexico: retail site streaming on target; Divestment of Germany retail completed October 1st; Augusta Refinery and Terminals divestment on schedule for 4Q18. Chemical rows (2): Newport Santoprene expansion start-up; Beaumont PE expansion on track for mid-2019 start-up. The Downstream band has a pale blue fill. Behind the lower half of the slide is a faint grey silhouette of offshore oil platforms, cranes and a flare structure, cropped at the bottom edge and partly behind the footer. Brand logos at bottom right: Exxon, Mobil, Esso oval, Mobil 1.
Slide 22
Q&A
Visuals: One full-bleed photograph of an industrial gas-processing plant under a blue sky with cumulus clouds. Two tall grey distillation or separation columns with steel lattice scaffolding and ladders stand in the centre-left and centre, with a smaller cluster of grey vessels and a pipe rack on the right. In the foreground a wide grey pipe runs diagonally from bottom centre toward the upper right, with yellow flanged valves and yellow handwheels, and a grey pipe bends to the right. Yellow safety labels read 'UP FLARE GAS' with a black arrow on the lower-centre pipe, 'VENT' with an arrow on a middle pipe, and 'UP FLARE GAS' with an arrow at the right edge. The foreground is a grey metal grating walkway; a grey steel handrail runs along the left edge. Lighting is bright daylight with sunlight on the steel. Dominant colours are sky blue #3F8FD0, cloud white #F2F2F2, steel grey #8A9196, and safety yellow #F2C200. The photograph is uncropped at full bleed, with a slight low-angle perspective, and has no overlay or tint.
Slide 23
Supplemental information
ExxonMobil third quarter 2018 earnings call
23
Visuals: Full-bleed faint grey line-art illustration of a refinery and petrochemical plant (distillation columns, towers, pipework, storage tanks, a flare-like stack and a ship or platform silhouette) across the bottom of the slide, in light grey tones with low contrast. No photograph, chart or table. Logos: red ExxonMobil wordmark at bottom left; at bottom right, red Exxon, blue Mobil, blue Esso oval and Mobil 1 wordmarks in a row.
Slide 24
Supplemental information / (blank) / 3Q18 / 3Q17 / 2Q18 / YTD / Cash Flow from Operating Activities / 11.1 / 7.5 / 7.8 / 27.4 / Proceeds Associated with Asset Sales / 1.5 / 0.9 / 0.3 / 3.2 / PP&E Adds / Investments & Advances1 / (5.4) / (3.4) / (5.4) / (14.1) / Free Cash Flow2 / 7.2 / 5.0 / 2.7 / 16.5 / Shareholder Distributions / (3.5) / (3.3) / (3.5) / (10.3) / Surplus Cash2 / 3.7 / 1.7 / (0.8) / 6.2 / Billions of dollars unless specified otherwise / 1 Includes PP&E Adds of ($5.2B) and net investments/advances of ($0.2B) for 3Q18; / includes PP&E Adds of ($4.9B) and net investments/advances of $1.5B for 3Q17; / includes PP&E Adds of ($4.9B) and net investments/advances of ($0.5B) for 2Q18; / includes PP&E Adds of ($13.5B) and net investments/advances of ($0.6B) for YTD18; / 2 See slide 25 for definition / ExxonMobil / ExxonMobil third quarter 2018 earnings call / 24 / Exxon / Mobil / Esso / Mobil 1
Visuals: One table with four numeric columns (3Q18, 3Q17, 2Q18, YTD) and six rows, all values in billions of dollars. Row 1 Cash Flow from Operating Activities: 11.1, 7.5, 7.8, 27.4. Row 2 Proceeds Associated with Asset Sales: 1.5, 0.9, 0.3, 3.2. Row 3 PP&E Adds / Investments & Advances (superscript 1): (5.4), (3.4), (5.4), (14.1). Row 4 Free Cash Flow (superscript 2): 7.2, 5.0, 2.7, 16.5. Row 5 Shareholder Distributions: (3.5), (3.3), (3.5), (10.3). Row 6 Surplus Cash (superscript 2): 3.7, 1.7, (0.8), 6.2. Rows 1, 4 and 6 are highlighted as solid blue bands with white labels and numbers; row 3 has a pale blue-grey band; rows 2 and 5 are plain white. Behind the lower half of the slide is a faint light-grey silhouette of refinery towers, pipes, storage tanks and tanker trucks, cropped at the bottom edge and at the left and right margins, with no overlay. No chart, photograph or legend is present.
Slide 25
Supplemental information
The chart presented on slide 18 speaks as of the March 7, 2018 Analyst Meeting and represents estimates of Upstream results from Permian and Bakken wells operated by ExxonMobil as well as the estimated portion of Downstream and Chemical results allocable to Permian and Bakken production. This chart is based on the projections and assumptions made at that Analyst Meeting and is not being updated or re-affirmed.
Definitions
Free cash flow. Free cash flow is cash flow from operations and asset sales less additions to property, plant and equipment, and additional investments and advances, plus other investing activities, including collection of advances. This measure is useful when evaluating cash available for financing activities, including shareholder distributions, after investment in the business.
Project. The term “project” as used in this presentation can refer to a variety of different activities and does not necessarily have the same meaning as in any government payment transparency reports.
Returns, investment returns, project returns. Unless referring specifically to ROCE, references to returns, investment returns, project returns, and similar terms mean discounted cash flow returns based on current company estimates. Future investment returns exclude prior exploration and acquisition costs.
Surplus cash. Surplus cash is calculated by subtracting Distributions to shareholders from Free cash flow. We believe this measure is useful to investors when evaluating cash available for certain financing activities, including debt reduction or incremental shareholder distributions.
ExxonMobil third quarter 2018 earnings call
25
Visuals: Full-bleed faint grey silhouette of an oil refinery and tanker terminal (towers, distillation columns, pipe racks, storage tanks, a ship and a pier) fills the lower part of the slide behind the text. It is a low-contrast light grey tint on white, with no photograph colour. Logos: ExxonMobil wordmark bottom-left in red and black; at bottom-right in a row Exxon (red), Mobil (red), Esso (red text inside a blue oval), and Mobil 1 (red with black box and numeral 1). No charts, tables or photographs apart from the background silhouette.
Download this deck
The hosted PDF of every library deck is free for readers of the SlideDeck Co newsletter. Join with your email and the viewer and download appear here.
Preparing a results presentation or business update of your own? The SlideDeck Co Standard Deck is a slide library for business reviews, updates and plans.







