
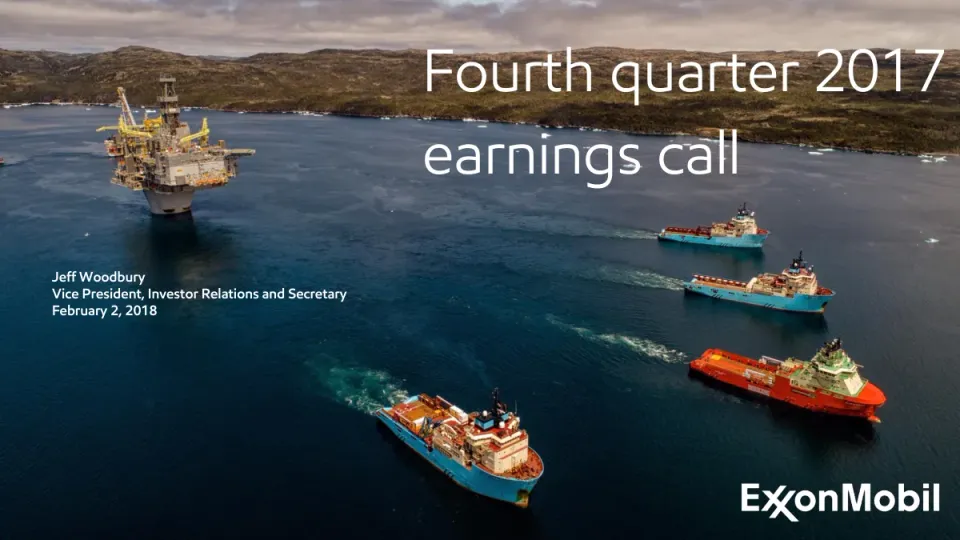
The deck is the slide presentation used on ExxonMobil's fourth quarter 2017 earnings call, delivered by Jeff Woodbury, Vice President of Investor Relations, on February 2, 2018. It opens with a full-screen title slide, then a cautionary statement covering forward-looking statements and defined terms. The headlines follow, along with business environment and financial results for the quarter. The main body runs through earnings bridges by segment (Total, Upstream, Downstream and Chemical) for the quarter and then for the full year. Volume bridges, sources and uses of cash, and full-year financial results come next. A project section covers exploration and development in Guyana, natural gas investments, project execution and capital efficiency in US shale. The deck closes with a summary titled Focused on value growth, a Q&A slide, and supplemental material with segment earnings reconciliations. Slides worth seeing are the sources and uses of cash flow on slide 14, which makes the funding picture clear at a glance, and the segment earnings bridges on slides 7 and 8, which pair a waterfall chart with a single headline sentence.
Slides worth studying
- Slide 14: A single graphic shows cash sources and uses side by side, with a clear headline stating that cash flow covers dividends and investments.
- Slide 7: The earnings waterfall pairs a chart with a headline that states the conclusion, so the number and its explanation read together.
- Slide 20: A map of the Stabroek block sits alongside short development bullets, combining a visual and text without crowding the slide.
Details
- Company: ExxonMobil
- Year: 2018
- Type: Investor presentation
- Industry: Energy
- Pages: 32
The hosted copy of this deck is being prepared. Newsletter readers will find the download here.
Review score: 7 out of 10, Effective
Presentation quality, judged with the SlideDeck Co review heuristic. Ask, evidence and idea merit are not rated here.
The strength is how the deck handles a quarter distorted by one-off items: every earnings waterfall gives U.S. tax reform and impairments their own bar with the parts listed beside it, as on slide 7 where 6,783 is split into +5,942, -1,294 and +2,135, so the underlying segment change is visible. Slide 32 then reconciles the reported change by segment to slides 7, 15 and 27, and a divider on slide 26 moves the sequential comparisons into supplemental material. Titles name both periods and subtitles state the change with its figure. The bottleneck is that the pages explain little beyond that. A photo fills the left half of each results page, the (710) Other bar on slide 18 has no explanation, and the tables on slides 12 and 24 show 2017 alone with no prior year. Outlook is one bullet on slide 14, about $24B of 2018 CAPEX, placed among results.
Worth keeping: Keep the separate U.S. Tax Reform and Impairments bar with its three-line breakdown and the reconciliation table on slide 32 that points back to the slides it supports.
Most useful repair: Replace the photo on slides 15 to 19 with short bullets that explain the Other and Vol/Mix bars, starting with the (710) on slide 18, and add a 2016 column to the table on slide 12.
What would change the score: If the reconciliation on slide 32 is legible at full size and the spoken remarks covered the Other bars, the handling of exceptions could justify an 8; I read slide 32 only on the contact sheet.
Confidence high. 32 of 32 pages inspected on contact sheets, 12 at readable size. Reviewed 2026-11-15. Model-assisted review (claude-fable-5-2, in session).
Full text of the slides (32 slides)
Every slide's words and a description of its charts and images, so the deck can be searched and rebuilt. Also available as Markdown.
Slide 1
Fourth quarter 2017 / earnings call / Jeff Woodbury / Vice President, Investor Relations and Secretary / February 2, 2018 / ExxonMobil
Visuals: Photograph (full-bleed, uncropped at edges): an aerial view of a wide, dark-blue sea inlet with a rocky, heath-covered brown-green coastline and low overcast cloud across the top. On the left, a large grey-and-yellow offshore production platform with a drilling derrick and yellow cranes stands on a concrete base in the water. Five offshore support vessels travel in formation toward the viewer: a blue-hulled vessel with a white superstructure in the lower centre, a red-hulled vessel with green-topped bridge at lower right, a blue vessel with white superstructure at centre right, and a smaller blue vessel further up at upper right; a small white wake trails behind each. Lighting is soft, overcast daylight; dominant colours are deep navy blue, muted olive-brown, grey cloud, with red and turquoise accents on the ships. No overlay or tint is applied to the photo itself. The ExxonMobil logo is white wordmark with a red-and-white crossed X in the double-x.
Slide 2
Cautionary statement / • Forward-Looking Statements. Statements of future events or conditions in this presentation or the subsequent discussion period are forward-looking statements. Actual / future results, including financial and operating performance; demand growth and mix; ExxonMobil’s volume/production growth and mix; the amount and mix of capital / expenditures; resource recoveries; production rates; rates of return; development costs; project plans, timing, costs, and capacities; drilling programs and efficiency / improvements; product sales and mix; dividend and share purchase levels; cash and debt balances; potential impairment charges; corporate and financing expenses; and the / impact of technology could differ materially due to a number of factors; including changes in oil or gas prices or other market or economic conditions affecting the oil, gas, / and petrochemical industries and the demand for our products; reservoir performance; the outcome and timeliness of exploration and development projects; war and other / political or security disturbances; changes in law or government regulation, including sanctions as well as tax and environmental regulations; the outcome of commercial / negotiations; the impact of fiscal and commercial terms; opportunities for investments or divestments that may arise; the actions of competitors and customers; the outcome / of future research efforts; unexpected technological developments; unforeseen technical difficulties; and other factors discussed here and under the heading "Factors / Affecting Future Results" in the Investors section of our Web site at exxonmobil.com. Forward-looking statements are based on management’s knowledge and reasonable / expectations on the date hereof, and we assume no duty to update these statements as of any future date. / • Frequently Used Terms. References to recoverable resources, oil equivalent barrels, and other quantities of oil, gas or condensate include volumes that are not yet classified / as proved reserves under SEC definitions but that we believe will likely be developed and moved into the proved reserves category in the future. Shareholder distributions / referred to in this presentation mean cash dividends plus any shares purchased to reduce shares outstanding (excluding anti-dilutive purchases). Unless otherwise indicated, / references to rates of return mean discounted cash flow returns based on current company estimates. For definitions and more information regarding resources, reserves, / cash flow from operations and asset sales, free cash flow, net investment, and other terms used in this presentation, see the "Frequently Used Terms" posted on the Investors / section of our Web site and the additional information in this presentation and the earnings release 8-K filed today. The Financial and Operating Review on our Web site also / shows ExxonMobil's net interest in specific projects. / • The term ‘project’ as used in this presentation can refer to a variety of different activities and does not necessarily have the same meaning as in any government payment / transparency reports. / 2 / ExxonMobil fourth quarter 2017 earnings call
Slide 3
Headlines
Full-year earnings of $19.7 billion; fourth quarter earnings of $8.4 billion
Cash flow more than covered net investments1 and dividends for the year
Advanced strategic opportunities that are foundational to future growth
Favorable non-cash impact from U.S. tax reform partly offset by Upstream impairments
1Cash flow means cash flow from operations and asset sales; Net investments means additions to property, plant, and equipment and net investments/advances
3
ExxonMobil fourth quarter 2017 earnings call
Visuals: One photograph, full-bleed across the width of the slide between about y 18.7% and y 95.5%. Subject: an offshore drillship (hull marked STENA CARRON, with a red-lettered Drillship panel on the superstructure) at night, its derrick, pipe racks, cranes and deck lit by warm yellow and orange work lights. Action: the vessel sits on calm dark water under an evening sky. Composition: wide landscape framing with the derrick near horizontal centre, the hull running across the lower third and the sky filling the upper two-thirds. Lighting: low dusk light with bright artificial illumination on the rig. Dominant colours: deep navy sky (about #1C2A4A), dark slate clouds (about #2B3140), warm amber lights (about #E8A33D) and black silhouettes. The photograph is not cropped, has no tint, and the lower footnote and white statements are laid over its dark sky. No charts, tables or diagrams.
Slide 4
Business environment
Moderate global economic growth in the quarter
Growth eased in U.S., Eurozone, and Japan
China growth maintained steady pace
Oil prices up, gas mixed
Global rig count steady
Refining margins decreased
Chemical margins softened
Brent
$/Barrel
75
50
25
0
Dec 2015 / Mar 2016 / Jun 2016 / Sep 2016 / Dec 2016 / Mar 2017 / Jun 2017 / Sep 2017 / Dec 2017
Source: Platt’s
4
ExxonMobil fourth quarter 2017 earnings call
MAERSK DEVELOPER
Visuals: Photograph: an aerial view of the offshore drilling rig Maersk Developer, a jack-up style drilling platform with a tall red and white lattice derrick mast, cranes, deck machinery and light blue and red hull legs with the name MAERSK DEVELOPER on the hull, standing on calm deep blue sea. It occupies roughly x 36 to 59 percent and y 24 to 86 percent of the slide, is not cropped, sits over the full-bleed ocean photo, and is lit by flat daylight with dominant colours navy blue sea, light blue hull, red and white derrick. Line chart: title Brent, subtitle $/Barrel, y axis 0 to 75 with labelled gridlines at 0, 25, 50 and 75 (no unit label beyond $/Barrel), x axis monthly dates from Dec 2015 to Dec 2017 with labels every three months, rotated about 45 degrees. One series in teal #2AB4C8, line about 2 pixels thick, no markers, no printed data values. Estimated values (about): Dec 2015 about 43, falling to a low of about 27 around Feb 2016, rising to about 40 by Apr 2016, about 50 by Jun 2016, dipping to about 45 around Sep 2016, about 50 by Dec 2016, about 53 to 55 through Mar to Jun 2017, about 50 in Aug 2017, rising to about 60 by Oct 2017 and ending about 66 in Dec 2017. No legend; no highlighted points. Source line Source: Platt’s beneath the chart. Five white filled rectangles sit at x 59 to 67 percent and x 74 to 79 percent, y 69 to 78 percent, behind the chart axis area, same white as the slide.
Slide 5
Fourth quarter 2017 financial results / Earnings / 8.4 / Earnings Per Share – Diluted (dollars) / 1.97 / Shareholder Distributions / 3.3 / CAPEX / 9.0 / Cash Flow from Operations and Asset Sales 1 / 8.8 / Cash / 3.2 / Debt / 42.3 / Billions of dollars unless specified otherwise / 1 Includes Proceeds associated with Asset Sales of $1.4B / 5 / ExxonMobil fourth quarter 2017 earnings call
Visuals: Table with two columns and seven rows, no header row. Column 1 holds the line-item labels, left-aligned in dark grey #595959 on alternating white and pale cyan #CCECFF rows. Column 2 holds bold white values, centred in narrow blue gradient cells (about #0A6BBE at the left to #00AEEF at the right). Rows from top to bottom: Earnings 8.4; Earnings Per Share – Diluted (dollars) 1.97; Shareholder Distributions 3.3; CAPEX 9.0; Cash Flow from Operations and Asset Sales (superscript 1) 8.8; Cash 3.2; Debt 42.3. Row fills alternate white, #CCECFF, white, #CCECFF, #CCECFF, #CCECFF, white as measured. No chart and no legend. Photograph: an industrial refinery or petrochemical plant at dusk, seen from a low three-quarter angle, with dense pipework, towers and steel lattice structures stacked in multiple levels and many small white and warm orange lights. Framing is a tall vertical crop filling its box fully, not cropped by any shape. Lighting is night-time artificial light against a deep blue twilight sky. Dominant colours are deep blue #1E3A6E in the sky, warm amber #E8A040 for lights and a grey-brown #5A5550 for steel. It is a plain rectangle with no tint or overlay. Footer band: a blue gradient strip with fine diagonal hatching texture across the full width.
Slide 6
Fourth quarter 2017 sources and uses of cash / Beginning Cash / 4.3 / Earnings / 8.4 / Depreciation / 5.8 / Working Capital / Other / (6.8) / 8.8 / Proceeds Associated with Asset Sales / 1.4 / Shareholder Distributions / (3.3) / PP&E Adds / Investments and Advances 1 / (7.9) / Debt / Other Financing / 1.3 / Ending Cash / 3.2 / Billions of dollars / 1 Includes PP&E Adds of ($4.5B) and net investments/advances of ($3.4B) / 6 / ExxonMobil fourth quarter 2017 earnings call
Visuals: Table with two columns and nine rows, plus a brace annotation. Column 1 holds labels and column 2 holds values in bold white on blue gradient cells. Row 1 is Beginning Cash with value 4.3, shaded light blue #CCECFF in bold. Row 2 is Earnings with 8.4, white row. Row 3 is Depreciation with 5.8, light grey #F2F2F2 row. Row 4 is Working Capital / Other with (6.8), white row. Row 5 is Proceeds Associated with Asset Sales with 1.4, light grey row. Row 6 is Shareholder Distributions with (3.3), white row. Row 7 is PP&E Adds / Investments and Advances with superscript 1 and value (7.9), light grey row. Row 8 is Debt / Other Financing with 1.3, white row. Row 9 is Ending Cash with 3.2, light blue bold row. Values are in billions of dollars, as stated by the italic caption Billions of dollars. A thin dark grey curly brace spans rows 2 to 6 on the right of the value column, pointing to a bold total of 8.8 in grey. Photograph: a petrochemical refinery at dusk with a deep blue sky at the top, dense steel towers, pipe racks, vessels and stairways lit by warm orange and yellow lights, and a canal or water channel in the foreground reflecting the lights. Composition is a wide frame with the towers filling the centre and the water across the bottom; it is not cropped on the left and runs to the right edge of the slide. Lighting is blue-hour ambient with warm artificial light. Dominant colours are deep blue, amber and grey steel. It is a plain rectangular box with no tint or overlay.
Slide 7
Total earnings – 4Q17 vs. 4Q16
Earnings increased $6.7 billion due to U.S. tax reform and improved Upstream results
Millions of Dollars
6,783
8,380
U.S. tax reform: +5,942
4Q17 impairments: -1,294
Abs. of 4Q16 impairments: +2,135
1,025
(289)
63
(882)
1,680
4Q16
U/S
D/S
Chem
C&F
U.S. Tax
Reform
& Impairments
4Q17
Note: changes in segment earnings adjusted for tax reform and impairments; see back-up for reconciliation
7
ExxonMobil fourth quarter 2017 earnings call
Visuals: Chart: waterfall (bridge) column chart titled 'Millions of Dollars' (unit: millions of US dollars; no axis scale or gridlines printed; baseline is a thin grey horizontal line). Seven columns left to right with printed values: 4Q16 = 1,680 (blue, bar from baseline up to about 72% of slide height); U/S = +1,025 (green, floating); D/S = (289) (red, floating, a thin bar, about 1.3% of slide height); Chem = 63 (green, very thin, about 0.3% of slide height); C&F = (882) (red, floating, about 4.3% of slide height); U.S. Tax Reform & Impairments = 6,783 (green, floating, tallest of the middle bars, about 32.6% of slide height); 4Q17 = 8,380 (blue, total bar from baseline to about 40% of slide height). Values for U/S, D/S, Chem and C&F bars are printed above or below them as shown. No legend. Colour encodes sign: blue for totals, green for increases, red for decreases. Callout text block placed upper-right over the chart area lists: U.S. tax reform +5,942; 4Q17 impairments -1,294; Abs. of 4Q16 impairments +2,135. Photograph: an offshore drillship named STENA CARRON (name visible in white lettering on the hull) at night, seen from the side at sea level, with a tall lattice derrick and drilling tower in the centre-left, rows of deck lights and floodlights in warm yellow-white, and a dark blue dusk sky with scattered dark clouds above. Orange-yellow light reflects on rippling dark water in the foreground. Composition: full-height vertical crop of the photo, ship spanning the middle horizontal band, subject lit from its own deck lights. Lighting: night, artificial warm lights against cool blue ambient. Dominant colours: deep navy #1B2F4F for sky and water, warm yellow #F2C14E and orange #E08A2E for lights and reflections. Photo is not full-bleed; it is cropped to the left column with a hard edge. Footer band: blue gradient image with fine diagonal hatch texture, no text other than the footer text. Two embedded logo images sit at the top of the slide (3.4% and 35.5% from left, at the top margin) and are not legible in the rendering.
Slide 8
Upstream earnings – 4Q17 vs. 4Q16
Earnings up $9.0 billion due to U.S. tax reform and higher realizations
Millions of Dollars
7,969
8,352
U.S. tax reform: +7,122
4Q17 impairments: -1,288
Abs. of 4Q16 impairments: +2,135
1,200
(110)
(60)
(642)
4Q16
Realization
Vol/Mix
Other
U.S. Tax
4Q17
Reform
& Impairments
8
ExxonMobil fourth quarter 2017 earnings call
Visuals: Waterfall bar chart titled Millions of Dollars, in the right panel. Axis: horizontal baseline with small tick marks under each bar, no numeric y-axis shown; values are printed above or below each bar. Categories left to right: 4Q16 (642) shown as a small blue bar below the baseline; Realization 1,200 as a green bar rising from the baseline; Vol/Mix (110) as a thin red bar; Other (60) as a thin red bar; U.S. Tax Reform & Impairments 7,969 as a tall green bar; 4Q17 8,352 as a tall blue bar at the right. Callout text right-aligned beside the U.S. Tax bar lists U.S. tax reform +7,122, 4Q17 impairments -1,288, and Abs. of 4Q16 impairments +2,135. Legend: none. Highlighted points: none beyond colour coding (blue for totals, green for increases, red for decreases). Photograph at left: a tall white-and-gold drilling rig derrick stands at centre-right against a dusk sky of blue, grey and pale pink clouds, with a low cluster of beige and white site trailers, a dark blue pump unit at the derrick base, a fenced gravel road in the foreground, and three white pickup trucks parked at right. Shot from ground level at eye height, full-height crop filling the left column, warm low sunlight on the trailers and grey-blue shadows elsewhere; dominant colours are dusky blue, lavender grey, beige and white.
Slide 9
Upstream volumes – 4Q17 vs. 4Q16 / Volumes down 3%: Liquids -133 kbd, natural gas +17 mcfd / koebd / 4,121 / (44) / (43) / (43) / 3,991 / Price, Spend, / & Other: -44 / Liquids: -16 / Gas: -27 / 4Q16 / Entitlements Divestments / Growth/ / 4Q17 / Other / 9 / ExxonMobil fourth quarter 2017 earnings call
Visuals: One photograph and one waterfall chart. Photograph: aerial view of an LNG carrier moored alongside a terminal; the red-hulled ship with white superstructure and the letters 'LNG' painted on its red hull runs diagonally from lower left to upper right; behind it a long breakwater of grey rock and a jetty with pipelines, walkways and loading arms extends across the top; dark teal sea surrounds them. Lighting is warm low sun on the ship and terminal; dominant colours are red, cream, gold-lit grey and dark teal. The image is full-height, boxed to the left half and cropped at the slide's top and bottom edges. Chart: vertical waterfall titled koebd, with no axis scale or gridlines; a thin dark grey horizontal baseline at about y 83.6%. Series: 4Q16 total bar in blue #00B0F0 at height about 4,121 (top at y 30.7%); Entitlements step (44) shown as a red #C00000 floating connector bar at about y 30.6% with a red line; Divestments step (43) red line at about y 31.7%; Growth/Other step (43) red line at about y 32.6%; 4Q17 total bar in blue #00B0F0 labelled 3,991 (top at y 32.4%). Printed sub-values: Price, Spend, and Other -44 under Entitlements; Liquids -16 and Gas -27 under Growth/Other. No legend; no highlighted points beyond the red step lines.
Slide 10
Downstream earnings – 4Q17 vs. 4Q16 / Earnings up $323 million due to U.S. tax reform and higher margins, partly offset by lower asset management gains / Millions of Dollars / 612 / 1,564 / 250 / (190) / (350) / 1,241 / 4Q16 / Margin / Vol/Mix / Other / U.S. Tax / Reform / & Impairments / 4Q17 / 10 / ExxonMobil fourth quarter 2017 earnings call
Visuals: Photograph (left column, x 0–41.2%, y 18.6–95.4%): a close, slightly low-angle view of Mobil 1 5W-30 motor oil plastic jugs. Foreground bottles, slightly out of focus at the bottom and left edge, are grey-silver with white/grey labels reading 'Mobil 1', 'Keeps Your Engine Running Like New', '5W-30' and 'Advanced Full Synthetic Motor Oil'. Behind them, rows of bottles sit on a conveyor/rail and further back, stacked cartons show black Mobil 1 packaging. Lighting is bright and even, dominant colours are silver-grey, black, Mobil red and blue. The photo is cropped by the chart panel on its right and by the footer strip on its bottom edge; it is boxed, not full-bleed. Bar chart (right panel): title 'Millions of Dollars' centred at top of the panel. Waterfall (floating bar) chart with six columns, no visible value axis or gridlines, a single horizontal baseline. Columns left to right with printed values: 4Q16 = 1,241 (blue #00B0F0 solid bar, full height from baseline); Margin = 250 (green #009900 floating increase); Vol/Mix = (190) (red #C00000 floating decrease); Other = (350) (red #C00000 floating decrease); U.S. Tax Reform & Impairments = 612 (green #009900 floating increase); 4Q17 = 1,564 (blue #00B0F0 solid bar, full height). Value labels sit above each bar in dark grey #595959 semibold. Category labels sit below the baseline in dark grey #595959 semibold; 'U.S. Tax / Reform / & Impairments' wraps onto three lines. No legend and no highlighted points beyond the colour coding of increases (green), decreases (red) and totals (blue). Bars are flat with no shadows or outlines.
Slide 11
Chemical earnings – 4Q17 vs. 4Q16
Earnings increased $398 million due to U.S. tax reform and higher volumes
Millions of Dollars
335
1,270
100
(10)
872
(30)
4Q16
Margin
Vol/Mix
Other
U.S. Tax
Reform
4Q17
11
ExxonMobil fourth quarter 2017 earnings call
Visuals: Photograph of an industrial chemical plant at left, cropped to the left column. Subject: dense steel process towers, columns, pipe racks, stairways and walkways, with a paved yard in the foreground. Composition: wide-angle, elevated viewpoint, the main tall tower placed centre-left, pipes running diagonally across the lower half. Lighting: bright clear daylight, hard shadows on the ground. Dominant colours: clear blue sky (#3E7FC9 approx.), silver-grey steel, dark grey asphalt, light blue-grey pipes. Not boxed; cropped at the column edges with no overlay or tint. Waterfall chart titled Millions of Dollars, with no value axis drawn and no gridlines; the values are printed on the bars. Categories left to right with values: 4Q16 872 (total bar, cyan); Margin (30) (decrease, red); Vol/Mix 100 (increase, green); Other (10) (decrease, red); U.S. Tax Reform 335 (increase, green); 4Q17 1,270 (total bar, cyan). Each bar floats on a shared baseline at about 83.4% of slide height; a thin dark grey horizontal baseline runs under all bars. Totals are drawn from the baseline; increases and decreases are drawn as floating blocks. Bar heights are approximately to scale with the totals (about 872 and 1,270 at roughly 24% and 35% of slide height). No legend and no highlighted points beyond the colour coding of increases (green) and decreases (red). Values for the margin and other bars are about the same magnitude as their labels suggest; no axis range is printed. Footer band: a full-width blue gradient image (#0060B0 to #00A0E8) with faint diagonal white hatch strokes.
Slide 12
2017 financial results / Earnings / 19.7 / Earnings Per Share – Diluted (dollars) / 4.63 / Shareholder Distributions / 13.0 / CAPEX / 23.1 / Cash Flow from Operations and Asset Sales 1 / 33.2 / Cash / 3.2 / Debt / 42.3 / Billions of dollars unless specified otherwise / 1 Includes Proceeds associated with Asset Sales of $3.1B / 12 / ExxonMobil fourth quarter 2017 earnings call
Visuals: Table with 7 rows and 2 columns, no header row. Column 1 holds the labels, left-aligned in grey #595959 on alternating white (#FFFFFF) and pale blue (#CCECFF) fills: Earnings; Earnings Per Share – Diluted (dollars) with '(dollars)' in italic; Shareholder Distributions; CAPEX; Cash Flow from Operations and Asset Sales with superscript 1; Cash; Debt. Column 2 holds the values, centred in white semibold on a blue gradient fill (about #0070C0 to #00A6EB): 19.7 (Earnings); 4.63 (Earnings Per Share – Diluted, dollars); 13.0 (Shareholder Distributions); 23.1 (CAPEX); 33.2 (Cash Flow from Operations and Asset Sales); 3.2 (Cash); 42.3 (Debt). Values are in billions of dollars unless specified otherwise, as stated in the note below the table. Photograph of an illuminated oil refinery or petrochemical plant at dusk: dense steel pipework, towers, catwalks, stairs and structural lattice, with rows of white and warm amber lights; a deep blue twilight sky at top; full-bleed within its box, cropped at the edges; warm amber and orange highlights against a dark blue sky; no overlay. No charts, logos or icons.
Slide 13
2017 sources and uses of cash
Beginning Cash
3.7
Earnings
19.7
Depreciation
19.9
33.2
Working Capital / Other
(9.5)
Proceeds Associated with Asset Sales
3.1
Shareholder Distributions
(13.0)
PP&E Adds / Investments and Advances1
(18.9)
Debt / Other Financing2
(1.8)
Ending Cash
3.2
Billions of dollars
1 Includes PP&E Adds of ($15.4B) and net investments/advances of ($3.5B)
2 Includes anti-dilutive purchases of ($0.5B)
13
ExxonMobil fourth quarter 2017 earnings call
Visuals: Table with 9 rows and 2 columns plus a side bracket. Column 1 holds row labels, column 2 holds values in white bold text on blue cells. Rows top to bottom: Beginning Cash 3.7 (bold, light blue row); Earnings 19.7; Depreciation 19.9; Working Capital / Other (9.5); Proceeds Associated with Asset Sales 3.1; Shareholder Distributions (13.0); PP&E Adds / Investments and Advances1 (18.9); Debt / Other Financing2 (1.8); Ending Cash 3.2 (bold, light blue row). Units: billions of dollars, printed in italic below the table. A curly brace to the right of the Earnings through Proceeds rows (about 51 to 53.5 percent of width, about 30.7 to 52.4 percent of height) points to the bold figure 33.2, which is the sum of those four rows. No chart. Photograph at right: an illuminated oil refinery or petrochemical plant at dusk, with dense steel towers, vertical columns, pipes, stairs and catwalks, many lit with warm yellow-orange lights; a calm water canal in the foreground with light reflections; blue twilight sky at top. Full-height rectangle, not rounded, cropped at the top and bottom of the content area and bleeding to the right edge. Dominant colours: deep blue #2A4A8A sky, warm amber #F2A93B lights, steel grey #6B7480. Low-key evening lighting. Footer band behind the bottom strip: a blue gradient from #0A5FB4 at left to #0FA3E0 at right, with faint diagonal hatch lines.
Slide 14
2017 sources and uses of cash
Cash flow fully covers dividends and investments
2017 Sources and Uses of Cash
Debt & Other
Financing1
$1.8B
Cash Draw
$0.5B
Asset Sales
$3.1B
PP&E Adds /
Investments &
Advances2
$18.9B
Cash Flow
From
Operations
$30.1B
Shareholder
Distributions
$13.0B
Sources of Cash
Uses of Cash
1 Includes anti-dilutive purchases of $0.5B
2 Includes PP&E Adds of $15.4B and net investments/advances of $3.5B
■ Financial flexibility to invest in attractive
opportunities
■ Generated free cash flow of $14.3 billion3
■ Anticipate 2018 CAPEX of about $24B
3 Calculated as Cash Flow from Operations and Asset Sales $33.2B less
PP&E Adds / Investments and Advances ($18.9B)
14
ExxonMobil fourth quarter 2017 earnings call
Visuals: Stacked bar chart titled '2017 Sources and Uses of Cash', two columns with no numeric axis or gridlines, only data labels. Left column 'Sources of Cash' (total not printed): bottom segment 'Cash Flow From Operations' $30.1B in blue #287FE8; middle segment 'Asset Sales' $3.1B in light blue #8DBBF3; thin top segment 'Cash Draw' $0.5B in dark grey about #404040. Right column 'Uses of Cash' (total not printed): bottom segment 'Shareholder Distributions' $13.0B in dark green #007500; middle segment 'PP&E Adds / Investments & Advances2' $18.9B in bright green #33CC33; thin top segment 'Debt & Other Financing1' $1.8B in pale green about #8FE68F. Segment heights are proportional to values. Baseline is a thin dark grey horizontal line (about #404040, roughly 0.2% of height) under both columns, from about x 1.6% to 35.2% at y about 82.4%. No legend; labels sit beside or inside segments; no highlighted points. Photograph: a offshore drillship named 'Stena MAX' (lettering on the dark blue hull) on calm dark blue ocean, seen from a high aerial-to-side angle, with a tall white drilling derrick in the centre, yellow cranes and booms, white superstructure and small figures on deck. Above the horizon is pale hazy sky with white cumulus clouds. Lighting is bright, even daylight; dominant colours are deep blue #1F4E8C for the sea, pale blue-grey sky, white and yellow. The photo is full-bleed to the right slide edge and not boxed, with no visible tint, and the sky area carries the white bullet text.
Slide 15
Total earnings – 2017 vs. 2016
Earnings increased $11.9 billion due to U.S. tax reform, and higher Upstream realizations and Downstream margins
Millions of Dollars
U.S. tax reform: +5,942
2017 impairments: -1,521
Abs. of 2016 impairments: +2,226
6,647
19,710
732
(432)
5,378
(455)
7,840
2016
U/S
D/S
Chem
C&F
U.S. Tax
2017
Reform
& Impairments
Note: changes in segment earnings adjusted for tax reform and impairments; see back-up for reconciliation
15
ExxonMobil fourth quarter 2017 earnings call
Visuals: Photograph on the left (x 0 to 41.2%, y 19 to 95.4%): an offshore drillship named STENA CARRON at night, seen from the side and slightly low, with a tall lattice drilling derrick at centre-left, illuminated cranes, deck machinery and rig lights in warm white and amber, a dark blue sky with scattered dark clouds, and calm water reflecting orange light at the bottom. The image is a rectangular crop, not full-bleed, with its right edge meeting the chart panel. Lighting is night artificial light; dominant colours are navy blue, black and warm amber. Waterfall chart on the right, titled 'Millions of Dollars', in millions of US dollars; no y-axis is drawn and there are no gridlines. Categories left to right: 2016 (7,840), U/S (+5,378), D/S (+732), Chem (-432), C&F (-455), U.S. Tax Reform & Impairments (+6,647), 2017 (19,710). Blue (#00B0F0) bars are totals, green (#009900) bars are increases and red (#C00000) bars are decreases, all floating on a shared horizontal baseline. The 2016 and 2017 total bars are full height from the baseline; the increase and decrease bars float. Values of the floating bars are printed above or below them as labelled. Boxed annotation at upper left of the bars lists the components of the last bar: U.S. tax reform +5,942; 2017 impairments -1,521; Abs. of 2016 impairments +2,226. No legend. No highlighted points beyond the colour coding.
Slide 16
Upstream earnings – 2017 vs. 2016 / Earnings up $13.2 billion due to U.S. tax reform and higher realizations / Millions of Dollars / 7,781 / 13,355 / U.S. tax reform: +7,122 / 2017 impairments: -1,504 / Abs. of 2016 impairments: +2,163 / 5,310 / (440) / 510 / 196 / 2016 / Realization / Vol/Mix / Other / U.S. Tax / 2017 / Reform / & Impairments / 16 / ExxonMobil fourth quarter 2017 earnings call
Visuals: Photograph (left panel): a drilling derrick, a tall white and blue lattice steel mast with a blue and yellow-white drilling substructure at its base, standing in a flat oil field at dusk. Behind it are a stormy blue-grey sky with scattered cumulus clouds lit pink-orange near the horizon, low beige modular trailers and a tan building line at its base, a wire fence with wooden posts running along an asphalt road in the foreground, and two white pickup trucks parked at right, with snowy dirt at the bottom left. Lighting is low warm sun from the side, giving golden highlights on the rig and buildings. Dominant colours: slate blue #6E8FB0, lavender grey #8A8FA8, warm orange #D9913F, white #FFFFFF. The photo is cropped to a rectangle, full-bleed to the left and bottom edges with no border or overlay. Chart: waterfall chart titled Millions of Dollars, with no printed value axis or scale. Categories left to right: 2016 (cyan total bar, value 196), Realization (green increase, +5,310), Vol/Mix (red decrease, (440)), Other (green increase, 510), U.S. Tax Reform and Impairments (green increase, floating, 7,781), 2017 (cyan total bar, value 13,355). Bar heights are proportional to the printed values; the 2017 bar is tallest and the 2016 bar is a thin sliver. Breakdown annotation in the upper right of the chart, right-aligned: U.S. tax reform +7,122; 2017 impairments -1,504; Abs. of 2016 impairments +2,163. No legend, no highlighted points beyond the colour coding: green increases, red decrease, cyan totals. Horizontal baseline runs under all bars.
Slide 17
Upstream volumes – 2017 vs. 2016 / Volumes down 2%: Liquids -82 kbd, natural gas +84 mcfd / koebd / 4,053 / (62) / (15) / 9 / 3,985 / Price, Spend, / & Other: -62 / Liquids: +2 / Gas: +7 / 2016 / Entitlements Divestments / Growth/ / 2017 / Other / 17 / ExxonMobil fourth quarter 2017 earnings call
Visuals: Photograph: an aerial view of an LNG carrier moored at a harbour jetty, filmed from above and at an angle. The ship's hull is red, its superstructure is cream-white, and the deck is studded with pipes, cranes and loading arms. Along the top-left runs a long concrete quay with rock-armoured edges and white pipelines. The water is dark teal-navy. Warm late-afternoon sunlight lights the ship and quay in gold, and the photo is full-bleed to its panel with no border or overlay. The ship's hull shows the letters 'L', 'N' and 'G' in white. Waterfall chart: a bar chart titled 'koebd' (thousand oil-equivalent barrels per day). It has no printed axis scale. Bars, left to right: 2016 total 4,053 (solid bright blue #00B0F0 bar, tall); Entitlements (62) (red #C00000 floating bar, very thin, a decrease with annotation 'Price, Spend, & Other: -62'); Divestments (15) (thin red #C00000 floating line, a decrease); Growth/Other 9 (thin green floating line, an increase, annotated 'Liquids: +2' and 'Gas: +7'); 2017 total 3,985 (solid bright blue #00B0F0 bar, slightly shorter than the 2016 bar). The 2016 and 2017 bars are the only blue bars. A thin dark grey (#595959) horizontal baseline runs under the bars. No legend. No highlighted points beyond the colour coding of the deltas.
Slide 18
Downstream earnings – 2017 vs. 2016 / Earnings up $1.4 billion driven by higher margins / Millions of Dollars / 1,470 / (30) / (710) / 664 / 5,597 / 4,201 / 2016 / Margin / Vol/Mix / Other / U.S. Tax / Reform / & Impairments / 2017 / 18 / ExxonMobil fourth quarter 2017 earnings call
Visuals: Chart: waterfall (bridge) chart titled 'Millions of Dollars', shown in the right column. Units are millions of US dollars. No axis tick labels or value axis are printed; the baseline is a horizontal grey rule under the bars. Categories left to right: 2016 (value 4,201, blue #00B0F0 bar, full height from baseline), Margin (+1,470, green #009900 floating bar), Vol/Mix (-30, thin dark red #C00000 line at the top of the Margin bar level), Other (-710, red #C00000 floating bar), U.S. Tax Reform & Impairments (+664, green #009900 floating bar), 2017 (5,597, blue #00B0F0 bar, full height from baseline). Each value is printed above its bar. Bars are not drawn to a printed scale; the heights are proportional to the values. No legend. Highlighted points: none beyond the colour coding of increases (green), decreases (red) and totals (blue). Photograph: close-up of Mobil 1 motor oil plastic bottles in silver-grey and black, arranged in rows on a conveyor or packing line, with shelves of boxed Mobil 1 cartons in the upper background. The bottles display Mobil 1 red and blue logos and labels reading 'Keeps Your Engine Running Like New', '5W-30', 'Advanced Full Synthetic Motor Oil' and NASCAR logos. Framing is a tight, angled view with bottles cropped at the left and bottom edges. Lighting is even ambient warm light with soft shadows. Dominant colours are silver-grey, black and red. The photo is full-bleed to the left and top-to-bottom of its column, not boxed and with no overlay or tint. Footer band: a full-width blue gradient strip with faint diagonal hatching texture. Logos: Mobil 1 logos appear on the bottles only.
Slide 19
Chemical earnings – 2017 vs. 2016
Earnings decreased $97 million due to lower margins and new operations, partly offset by U.S. tax reform
Millions of Dollars
4,615
(260)
100
(270)
335
4,518
2016
Margin
Vol/Mix
Other
U.S. Tax
Reform
2017
19
ExxonMobil fourth quarter 2017 earnings call
Visuals: Waterfall chart titled 'Millions of Dollars' in the right panel, with no visible axis scale or gridlines. Six columns from left to right: 2016 (total bar, value 4,615, blue #00B0F0, from baseline up to about 4,615 scale), Margin (decrease, value (260), red #C00000, floating), Vol/Mix (increase, value 100, green #00A000, floating), Other (decrease, value (270), red #C00000, floating), U.S. Tax Reform (increase, value 335, green #00A000, floating), 2017 (total bar, value 4,518, blue #00B0F0, from baseline). Each floating bar starts where the previous bar ended, forming a stepped connection. Totals are drawn as full columns from a horizontal dark grey baseline; the values are printed above each bar in bold grey. No legend. No highlighted points beyond the colour coding of increases (green) and decreases (red). Photograph on the left: an industrial chemical plant with tall grey-white distillation columns, a lattice steel tower on the right, a dense network of silver pipes and walkways, and a paved yard with a small brick control building in the middle ground. Clear blue sky at top, midday sunlight with hard shadows on the ground, dominant colours steel grey, silver, blue sky and warm grey concrete. The photo is full-height of the content band, cropped at the left and right edges by the slide edge and at the bottom by the footer band, not boxed, with no overlay or tint. Blue #00B0F0 bars and blue footer band are the only saturated colours.
Slide 20
World-class resource growth offshore Guyana / Sixth discovery on Stabroek block; progressing multiple phases of development / Exploration: / Ranger-1 discovery proves third new play concept / 230 feet of oil-bearing carbonate reservoirs / 3.2 BOEB recoverable resources on Stabroek block / Excludes Ranger discovery / Rig moved to Pacora prospect, near Payara / Development: / Liza Phase I development drilling beginning 2018 / Liza Phase II lead concept 220 KBD FPSO / First oil March 2020 / Start-up 2022 / Progressing concept selection for Payara / Start-up planned 2023/2024 / Kaieteur / Stabroek / Ranger / Sorubim / Canje / Payara / Pacora / Liza / Snoek / Block 59 / Guyana / Suriname / 3000 m / N / US GOM OCS / Block Size / Kilometers / 0 / 15 / 30 / 60 / Discoveries / Potential 2018-2019 / opportunities / XOM operated / Turbot / 20 / ExxonMobil fourth quarter 2017 earnings call
Visuals: One map of the Stabroek block offshore Guyana, drawn as a flat vector chart. The sea is pale light blue, and the land at the lower left and far right is a beige/cream tone. Exploration blocks are outlined in thick black with yellow (#FFFF00) fill for XOM-operated acreage. Block names are printed on the map in dark blue bold: Kaieteur (north block, tall vertical lobe), Stabroek (large diagonal block), Canje, Block 59 (eastern block beyond the Essequibo-type river line). A thin blue river line with the label '3000 m' runs from the top of the map down through the blocks. Well markers: green circles with dark-green outlines mark discoveries (Ranger, Payara, Liza, Snoek, Turbot, one unlabelled circle beside Ranger); gold/orange triangles with dark outlines mark potential 2018-2019 opportunities (about 7 triangles, scattered around Ranger, Sorubim, Payara, Pacora, Snoek and the eastern edge of the block). A small inset locator map at top left shows northern South America in black outline on white with a small red square over Guyana. A scale bar in kilometres is labelled 0, 15, 30, 60 with ticks. A north arrow (black, pointing up) with an 'N' sits below the legend. The legend box lists: green circle = Discoveries; gold triangle = Potential 2018-2019 opportunities; yellow rectangle with black outline = XOM operated. A small hollow square with label 'US GOM OCS Block Size' sits left of the scale bar. No photographs, no logos.
Slide 21
Lowest-cost-of-supply developments
Progressing strategic natural gas investments to meet growing demand
Closed Mozambique Area 4 acquisition
ExxonMobil to lead onshore LNG developments
> 40 MTA scope
Funded participation in 3.4 MTA Coral FLNG project
Successful
P’nyang appraisal in Papua New Guinea
Assessing multi-train development
Will spud first offshore Cyprus well 4Q18
Signed PSCs for three blocks offshore Mauritania
8.4 million acres in water depths of 3,300 to 11,500 feet
21
ExxonMobil fourth quarter 2017 earnings call
Visuals: One photograph, full-bleed, occupying the right half of the content area (x 49.5%, y 19.1%, w 50.5%, h 76.2%). It shows an aerial view of an LNG processing plant on a coastline. In the foreground are white storage tanks (two large spherical-topped tanks at centre-left), grey process trains and pipe racks, sandy cleared ground, green vegetation, and roads and white-roofed buildings. A long pipeline or jetty runs from the plant out to sea, with a ship (LNG carrier) moored at its end on dark blue water. The sky at the top is a pale blue-grey with broken cumulus clouds. Lighting is soft daylight. Dominant colours are green, tan, dark blue sea and grey-white sky. The image is cropped to a rectangle and sits edge to edge, with no border or overlay. No logos or icons appear on the slide.
Slide 22
Successfully started up two major projects
Strong project execution in challenging operating environments
■
Hebron first oil November 2017
–
Produce 150 KBD at peak rates
–
700 MBO recoverable resources
–
On-schedule delivery
■
Odoptu Stage 2 started up December 2017
–
Increases field production capacity to 65 KBD
–
On-schedule delivery
■
Agreement to increase Upper Zakum to 1 MBD
by 2024
–
Modularly expand facilities to maximize capital
efficiency and reduce costs
22
ExxonMobil fourth quarter 2017 earnings call
Visuals: One photograph and no charts, tables, logos or icons. Photograph: an offshore oil production platform standing in open sea. Its subject is a large grey concrete gravity-base substructure, a tall cylindrical column that rises to a multi-deck topside covered in pipework, walkways, and modules. Above the topside stand a drilling derrick with stacked white and grey housing, a lattice flare boom at the upper right, and yellow crane arms at left and centre-right. In the foreground right, an orange-red offshore supply vessel with a white superstructure and a navigation mast sits on dark water, with a thin cable running from it to the platform base. What is happening: the platform is in calm, overcast conditions, apparently at or near operation. Composition and framing: a wide, slightly low, three-quarter view that places the platform near the centre-left of its frame with the vessel at lower right; the sky occupies the upper third. Lighting: flat, diffuse, overcast daylight with no hard shadows. Dominant colours: mid grey sky (about #A9AAAB), dark slate sea (about #3C4246), concrete grey (about #B5B6B3), yellow cranes (about #E8C41A), and orange-red vessel (about #D8482B). The photograph is cropped to a rectangle, not boxed or rounded, bleeds off the right edge of the slide, and has no overlay or tint. Behind the left column, a pale blue gradient panel and white background sit beneath the bullets.
Slide 23
Growing unconventional liquids
Continuing to maximize capital efficiency
▪ Ramping up drilling in Permian and Bakken
– 26 rigs growing to 36 by YE18
▪ Driving industry-leading capital efficiency
– Optimizing lateral length/completion designs
▪ Assessing potential in additional Permian stacked pay zones
▪ $2 billion planned infrastructure investments
Net production Delaware, Midland, and Bakken
KOEBD
800
Actual production
High-side flexibility
600
400
Delaware and Midland
200
Bakken
0
'15 '17 '19 '21 '23 '25
23
ExxonMobil fourth quarter 2017 earnings call
Visuals: Stacked area chart titled 'Net production Delaware, Midland, and Bakken', with unit label 'KOEBD' beneath the title. Y axis is labelled 0, 200, 400, 600, 800 (KOEBD), range 0 to about 850. X axis shows years labelled '15, '17, '19, '21, '23, '25 at two-year intervals. Three filled area series stacked from the bottom: Bakken (dark green, bottom band, about 80 at '15, about 90 at '17, about 80 at '19, rising to about 200 by '21 and staying near 200 to '23, about 170 at '25), Delaware and Midland (mid green, middle band, about 800 total top edge reached near '24 for the combined top), and High-side flexibility (pale mint, thin top band above Delaware and Midland, about 40 to 60 thick near '23 to '25). A red line labelled 'Actual production' in the legend (red line sample at the top left of the plot) runs from about 100 at '15 to about 200 near '18 with small fluctuations, ending around '18. No values are printed on the chart other than axis ticks; all series values are estimates marked 'about'. No highlighted points. Series direct labels: 'Delaware and Midland' in white semibold over the mid green band, 'Bakken' in white semibold over the dark green band, 'High-side flexibility' in dark navy text at the top right.
Slide 24
Summary
Focused on value growth
2017
Cash Flow from Operations and Asset Sales1
33.2
Earnings
19.7
Upstream production (MOEBD)
4.0
CAPEX
23.1
Free Cash Flow2
14.3
Shareholder Distributions
13.0
Billions of dollars unless specified otherwise
1 Includes Proceeds associated with Asset Sales of $3.1B
2 Calculated as Cash Flow from Operations and Asset Sales of $33.2B less PP&E Adds / Net Investments & Advances of ($18.9B)
24
ExxonMobil fourth quarter 2017 earnings call
■ Relentless focus on value
■ Advanced high-potential opportunities
■ Covered net investments and dividends
■ Increased shareholder distributions
Visuals: Photograph: full-bleed dusk seascape. Subject: an offshore drilling ship in silhouette on the right-hand side, its derrick tower and deck cranes rising against a sky with dark cumulus clouds; the sea horizon runs across the lower third. What is happening: the vessel is at anchor at sunset. Composition: horizontal, ship placed right of centre and cropped at the bottom edge of the image area. Lighting: low warm sun glow near the horizon fading into cool blue sky above. Dominant colours: deep navy #1B3A5C at top, blue-grey #3E6A8F in the clouds, orange-amber #E08A4A glow at the horizon. Overlay: a blue tint across the photograph (the same photo appears twice, a 960 by 437 pixel copy and a 2937 by 1260 pixel copy, stacked in the same position). Table: no gridlines; twelve semi-transparent blue #0070C0 rectangles form six rows, each with a label column (x 3.8 to 42.1 percent) and a value column (x 42.1 to 56.6 percent), alternating opacity 0.65 and 0.50 by row. Columns: label, 2017. Rows: Cash Flow from Operations and Asset Sales1 = 33.2; Earnings = 19.7; Upstream production (MOEBD) = 4.0; CAPEX = 23.1; Free Cash Flow2 = 14.3; Shareholder Distributions = 13.0. Footer strip: a 2000 by 52 pixel blue gradient band (darker blue #0050A0 at left to brighter #1E90D8 at right) with a fine diagonal hatch texture. Logo: a 178 by 42 pixel image at the top-left, which is not visibly rendered on the white band. Icons and charts: none.
Slide 25
Q&A
Visuals: Photograph (top, full-bleed, 0 to 80.9% of height): two industrial workers in orange coveralls, white hard hats and yellow-green ear defenders stand on a grey grated steel walkway on an offshore platform, photographed from above at a steep downward angle. The man on the left, in a white hard hat with a small green-and-white badge, stands with hands in dark gloves and looks toward the other worker. The man on the right, in a white hard hat with ear defenders, holds a handheld radio near his face with one gloved hand and gestures with the other. Yellow handrails run diagonally from upper right to lower left, with red and blue tubular railings and blue vertical posts in the foreground on the left; dark, rippling sea water fills the upper-left background. Grey and white pipework, flanges, valves with a black handwheel, and a red circular gauge housing surround the workers. Daylight, even and natural, with some specular highlights on the water. Dominant colours: orange #F26B1D, red #C8232C, blue #1E88D0, yellow #F2C200, dark sea navy #1B2A36, steel grey #9AA3AB. The photo is not cropped inside its frame and is not boxed; it runs edge to edge with no overlay or tint. Band (bottom, 80.7 to 100% of height): a blue graphic panel, deep blue #0B4DA2 at the left shifting to brighter cyan-blue #1A8FD6 at the right, with a faint pattern of fine concentric white arcs radiating across the right half. No logo appears in the band.
Slide 26
Supplemental material / 26
Visuals: Aerial photograph of an LNG (liquefied natural gas) processing plant on a coastal site, taken from above and slightly oblique. Subject: two large white domed LNG storage tanks in the upper centre, a central cluster of grey process trains with pipework and vessels, smaller white tanks and buildings at left, a pair of small white circular tanks in a bunded area at right, a dark rectangular pond at upper left, and a long pale elevated pipeline running from the plant to a jetty that reaches out into the sea at upper right, where a ship is moored. Beyond the plant is a dark blue ocean horizon, and above it a heavy grey cloud bank fills the top band. The foreground is green grassland with bare orange-brown earth patches and unpaved access roads. Composition: wide landscape framing, plant centred, horizon near the top third. Lighting: diffuse overcast daylight. Dominant colours: grey-white cloud, dark navy sea, green grass, brown earth, white and silver plant. The photo is not cropped at the top or sides and is not boxed; it runs full width and ends where the blue band begins, with no overlay or tint. The blue band carries a faint pattern of concentric curved lines on its right side, described under the band element.
Slide 27
Total earnings – 4Q17 vs. 3Q17
Earnings increased $4.4 billion due to U.S. tax reform and improved Upstream results
Millions of Dollars
U.S. tax reform: +5,942
4Q17 impairments: -1,294
Abs. of 3Q17 impairments: +108
4,756
8,380
854
(591)
(157)
(452)
3,970
3Q17
U/S
D/S
Chem
C&F
U.S. Tax
Reform
& Impairments
4Q17
Note: changes in segment earnings adjusted for tax reform and impairments; see back-up for reconciliation
27
ExxonMobil fourth quarter 2017 earnings call
Visuals: Chart: waterfall (bridge) chart titled 'Millions of Dollars', values in US$ millions, no axis lines or tick values printed, value labels printed above each bar. Categories left to right: 3Q17 = 3,970 (total bar, blue); U/S = 854 (increase, green, floating); D/S = (591) (decrease, red, floating); Chem = (157) (decrease, red, small); C&F = (452) (decrease, red); U.S. Tax & Impairments = 4,756 (increase, green, tallest floating bar); 4Q17 = 8,380 (total bar, blue). Bars bottom out on a thin grey horizontal baseline. Bar heights are proportional to values; bar tops for the floating bars are about: U/S top about 55.2% of slide height, D/S top about 55.2%, Chem top about 58.2%, C&F top about 59.0%, U.S. Tax top 36.4%; totals 3Q17 top 59.6% and 4Q17 top 36.5%. Annotation block (right-aligned, grey text, above the U.S. Tax bar) lists the components of the U.S. Tax & Impairments bar: U.S. tax reform +5,942; 4Q17 impairments -1,294; Abs. of 3Q17 impairments +108. No legend. No highlighted points beyond the colour coding. Photograph: offshore drilling vessel STENA CARRON at night, moored on dark water; the hull is seen in side profile with a tall lattice drilling derrick at centre-left and a cantilevered deck structure at right, all covered in white and yellow deck lights; cranes at far left; the name STENA CARRON is painted small on the hull near the centre-right. Sky is deep dusk blue with dark cumulus clouds; the sea reflects warm orange and yellow light from the vessel. Composition is a landscape view from the water at the vessel's side, subject filling the middle band of the frame; full colour, night lighting from the ship's floodlights, dominant colours deep navy, black and warm amber. Not cropped at the bottom or sides; it is boxed by the slide edges at the left and by the hard edge of the chart panel at right, with no overlay or tint.
Slide 28
Upstream earnings – 4Q17 vs. 3Q17
Earnings increased $6.8 billion due to U.S. tax reform and higher realizations
Millions of Dollars
1,567
930
70
(150)
5,931
8,352
U.S. tax reform: +7,122
4Q17 impairments: -1,288
Abs. of 3Q17 impairments: +97
3Q17
Realization
Vol/Mix
Other
U.S. Tax
4Q17
Reform
& Impairments
28
ExxonMobil fourth quarter 2017 earnings call
Visuals: Left: an aerial photograph of an LNG processing plant on a coastal site, with storage tanks, process trains and piping in the middle ground, a long pier or jetty running out into dark blue sea at the upper right, and a dark grey-white cloudy sky across the top. Dirt tracks and green scrub surround the site, with bare orange-brown earth in the foreground. Overcast daylight, muted greens, greys and browns; full-bleed to the left edge and the top of the panel, rectangular, not cropped to a shape. Right: a vertical waterfall chart titled 'Millions of Dollars' with no printed axis scale. Six columns read left to right: 3Q17 blue bar labelled 1,567; Realization green floating bar labelled 930 (about 930 above 3Q17 level); Vol/Mix thin green bar labelled 70; Other thin red bar labelled (150); U.S. Tax Reform & Impairments tall green bar labelled 5,931; 4Q17 tall blue bar labelled 8,352. Bars sit on a thin grey baseline. The start and end totals are blue (#00B0F0), increases green (#009900), the decrease red (#C00000). A three-line annotation right-aligned above the tax bar breaks down the tax bar: U.S. tax reform: +7,122; 4Q17 impairments: -1,288; Abs. of 3Q17 impairments: +97. No legend, no highlighted points beyond the colour coding.
Slide 29
Upstream volumes – 4Q17 vs. 3Q17 / Volumes increased 3%: Liquids -29 kbd, natural gas +856 mcfd / koebd / 107 / 3,991 / 3,878 / 36 / (30) / Price, Spend, / & Other: +36 / Liquids: +22 / Gas: +85 / 3Q17 / Entitlements Divestments / Growth/ / 4Q17 / Other / 29 / ExxonMobil fourth quarter 2017 earnings call
Visuals: Photograph (left column, x 0 to 48.4%, y 19 to 95.4%, full-bleed to the left, top and bottom edges): several orange-red pumpjack heads and black steel beams and frames of oil pumping units, shot from a low angle looking up against a deep blue sky with white cumulus clouds on the left and centre-right; a few pumpjacks recede to the right in smaller scale; a small red and white warning sign is visible at lower left and dense evergreen trees sit at the bottom right; dominant colours are orange-red, black, deep blue and white; daylight lighting; no overlay or tint; not boxed, cropped by the slide edges. Chart (right panel): a waterfall bar chart titled koebd (thousand oil-equivalent barrels per day), with no printed axis scale or numeric y-axis; category axis labels 3Q17, Entitlements, Divestments, Growth/Other, 4Q17 along a thin dark grey baseline at about 83.6% of slide height spanning about 51.7 to 96.3% of width. Series: 3Q17 total bar 3,878 (blue #00B0F0, from baseline up to about 33.8%); Entitlements increment bar 36 (green, short horizontal floating bar about 61.9 to 68.2% width at about 33.4% height, sub-labelled Price, Spend, and Other: +36); Divestments decrement bar (30) (red, floating bar about 70.8 to 77.2% width at about 33.5% height, no sub-label); Growth/Other increment bar 107 (green, about 79.8 to 86.1% width at about 32.4 to 33.8% height, sub-labelled Liquids: +22 and Gas: +85); 4Q17 total bar 3,991 (blue #00B0F0, about 88.7 to 95.0% width, from baseline up to about 32.4%). No legend. No highlighted points beyond the colour coding of increases (green) and decreases (red) against the blue totals. Value labels sit above each bar in dark grey semibold.
Slide 30
Downstream earnings – 4Q17 vs. 3Q17
Earnings up $32 million due to U.S. tax reform largely offset by weaker margins
Millions of Dollars
1,532
(540)
(10)
(40)
623
1,564
3Q17
Margin
Vol/Mix
Other
U.S. Tax
Reform
& Impairments
4Q17
30
ExxonMobil fourth quarter 2017 earnings call
Visuals: Waterfall chart titled 'Millions of Dollars' with six columns left to right: 3Q17 total 1,532 (blue column, about 1,532 by its label), Margin (540) (red floating column descending from about 1,532 to about 992), Vol/Mix (10) (very thin red floating bar, about 10 units), Other (40) (short red floating bar, about 40 units), U.S. Tax Reform & Impairments 623 (green floating column ascending, about 623 units), and 4Q17 total 1,564 (blue column). Values are printed above each column; no numeric axis, tick marks or gridlines are shown; the only axis is a thin grey horizontal baseline. No legend; no highlighted points beyond colour coding (blue totals, red decreases, green increase). Photograph: an industrial oil refinery under a clear blue sky with some thin white clouds; tall steel distillation columns and towers with platforms and ladders stand in the centre, cylindrical storage vessels at left, and a dense web of pipes and walkways in the foreground at bottom. Steel grey and dark brown tones with blue sky dominating; daylight, low-angle sun on the structures. Framing is a vertical crop of the full height of the picture area, boxed to the left panel with a hard edge, not full-bleed, no overlay or tint.
Slides 31 to 32 continue in the full text file.
Download this deck
The hosted PDF of every library deck is free for readers of the SlideDeck Co newsletter. Join with your email and the viewer and download appear here.
Preparing a results presentation or business update of your own? The SlideDeck Co Standard Deck is a slide library for business reviews, updates and plans.







