
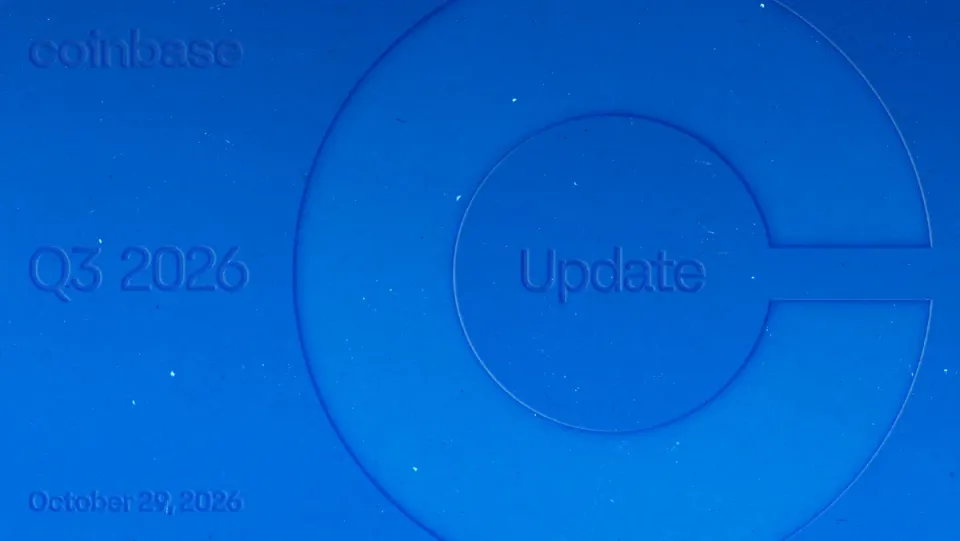
The deck opens with a cover reading Q3 2026 Update, followed by a disclaimers slide covering forward-looking statements and non-GAAP measures, then a mission statement reading that the company aims to increase economic freedom in the world. It moves to a market overview of crypto trading, stablecoins, tokenization and agentic finance, and then to Coinbase's competitive position across four pillars: trust, global liquidity, stablecoin platform and repeatable innovation. The middle sections cover the Q3 highlights, crypto trading volume market share, assets on platform, USDC balances, the 2026 priorities, derivatives, prediction markets, Coinbase One subscribers, developer payments and the Base network. Financial sections follow, covering the Q3 summary, report card, revenue, transaction and subscription revenue, expenses, adjusted EBITDA, the balance sheet, share count and the Q4 outlook. The appendix holds the reconciliations and full financial statements. The deck closes with a wide appendix of tables rather than a closing statement. Slides worth studying include the highlights grid, the market overview with its large figures and small line charts, and the 2026 priorities slide with three numbered cards.
Slides worth studying
- Slide 4: Three small line charts with large headline numbers sit above a single curve that carries the argument, a clean way to combine data and narrative.
- Slide 12: A single bar chart with one callout arrow and a short text column makes the growth point without clutter.
- Slide 6: A grid of six KPI cards with large figures and small comparison labels gives a quick scannable highlights page.
Details
- Company: Coinbase
- Year: 2026
- Type: Investor presentation
- Industry: Crypto exchange and fintech
- Pages: 42
Review score: 8 out of 10, Strong
Presentation quality, judged with the SlideDeck Co review heuristic. Ask, evidence and idea merit are not rated here.
The main body is disciplined and easy to follow: slides 5 to 28 use action titles, one chart or card set per page, and a consistent blue system with a chart panel on the left and a commentary panel on the right. The highlights grid (slide 6) and the market overview (slide 4) give the audience big figures with clear hierarchy, and the route runs from market to position to highlights to segments to financials to outlook. Weaknesses remain: slide 12 has bars with no values or axis, the cover (slide 1) is nearly illegible tone-on-tone text, and the chart and commentary panels on slides 7 to 24 carry very small labels and dense footnotes. The roughly 14 appendix pages (slides 29 to 42) are dense tables, but they are reference material in an investor-update setting, so this density is tolerable.
Worth keeping: Keep the action-title pattern, the highlights grid on slide 6, the large-figure and small-chart layout on slide 4, and the consistent chart-plus-commentary panel structure.
Most useful repair: Add value labels to the bars on slide 12 and lift the cover title contrast on slide 1 so the date and title can be read.
What would change the score: Enlarge the tiny axis, legend and data labels on the dense chart slides (9, 21, 22, 23), trim commentary bullets on slides 11 and 12, and end the main section with a closing summary slide before the appendix.
Confidence high. 42 of 42 pages inspected on contact sheets, 4 at readable size. Reviewed 2026-11-10. Model-assisted review (claude-sonnet-5-5).
Full text of the slides (42 slides)
Every slide's words and a description of its charts and images, so the deck can be searched and rebuilt. Also available as Markdown.
Slide 1
coinbase
Q3 2026
Update
October 29, 2026
Visuals: Full-bleed photograph of a blue textured paper-like or pressed-material surface with a large embossed/debossed geometric mark: an outer ring (roughly a C with a horizontal cut-in on the right at mid-height, forming a 'C' or 'G'-like shape) and an inner circle containing the word 'Update'. The embossing is tone-on-tone, rendered as darker blue edge lines and subtle highlights, with small light specks scattered across the surface. Lighting is soft and even, raking light from the upper left producing the emboss shading. Dominant colour is saturated royal blue, lighter at the lower centre and darker at the top left. Composition is landscape, full frame, not cropped in a way that hides the mark; the outer ring is partly cut off at the top and bottom edges.
Slide 2
Disclaimers
Cautionary Note Regarding Forward-Looking Statements
This presentation contains forward-looking statements within the meaning of the Private Securities Litigation Reform Act of 1995. All statements other than statements of historical fact are forward-looking statements. These statements include, but are not limited to, statements regarding our future operating results and financial position, including for the fourth quarter and the year ending December 31, 2026; anticipated future expenses and investments; expectations relating to certain of our key financial and operating metrics; our business strategy and plans; expectations relating to legal and regulatory proceedings; expectations relating to our industry, the regulatory environment, market conditions, trends and growth; expectations relating to customer behaviors and preferences; our market position; potential market opportunities; and our objectives for future operations. The words “believe,” “may,” “will,” “estimate,” “potential,” “continue,” “anticipate,” “intend,” “expect,” “could,” “would,” “project,” “plan,” “target,” and similar expressions are intended to identify forward-looking statements. Forward-looking statements are based on management’s expectations, assumptions, and projections based on information available at the time the statements were made. These forward-looking statements are subject to a number of risks, uncertainties, and assumptions, including, among others: our ability to successfully execute our business and growth strategy and generate future profitability; market acceptance of our products and services; our ability to further penetrate our existing customer base and expand our customer base; our ability to develop new products and services; our ability to expand internationally; failure to obtain applicable regulatory approvals and satisfy other closing conditions in a timely manner or otherwise for any acquisition we make; the success of any acquisitions or investments that we make; the effects of increased competition in our markets; our ability to stay in compliance with applicable laws and regulations; stock price fluctuations; market conditions across the onchain economy, including crypto asset price volatility; the growth and regulatory treatment of our derivatives trading and prediction markets offerings; and general market, political, and economic conditions, including interest rate fluctuations, inflation, changes in tariffs and trade restrictions, instability in the global banking system, economic downturns, and other global events, including regional wars and conflicts and government shutdowns. It is not possible for our management to predict all risks, nor can we assess the impact of all factors on our business or the extent to which any factor, or combination of factors, may cause actual results to differ materially from those contained in any forward-looking statements we may make. In light of these risks, uncertainties, and assumptions, our actual results could differ materially and adversely from those anticipated or implied in the forward-looking statements. Further information on risks that could cause actual results to differ materially from forecasted results is, or will be, included in our filings we make with the Securities and Exchange Commission (SEC) from time to time, including our Annual Report on Form 10-K for the year ended December 31, 2025 filed with the SEC on February 12, 2026 and our Quarterly Report on Form 10-Q for the quarter ended September 30, 2026 filed with the SEC on October 29, 2026. Except as required by law, we assume no obligation to update these forward-looking statements, or to update the reasons if actual results differ materially from those anticipated in the forward-looking statements.
Key Metrics and Other Information
This presentation includes certain of our key metrics that our management uses to help evaluate our business, measure our performance, identify trends affecting our business, and make strategic decisions. Our key metrics are Monthly Transacting Users, Assets on Platform, Net Revenue, Net Income (Loss) and Adjusted EBITDA. Definitions of our key metrics can be found in our Quarterly Report on Form 10-Q for the quarter ended September 30, 2026 filed with the SEC on October 29, 2026. See “Non-GAAP Financial Measures” below for more information on Adjusted EBITDA, a non-GAAP financial measure.
This presentation may contain metrics, data, estimates, and forecasts that are based on industry publications, third-party websites, or other publicly-available information, as well as other information based on our internal sources and calculations. This information involves many assumptions and limitations, including inherent challenges in measurement as our business and the markets in which we operate evolve. We have not independently verified the accuracy or completeness of the data contained in industry publications, third-party websites, and other publicly-available information. Accordingly, we make no representations as to the accuracy or completeness of that data nor do we undertake to update such data after the date of this presentation.
Non-GAAP Financial Measures
This presentation includes financial measures that were not prepared in accordance with U.S. generally accepted accounting principles (“GAAP”). Our non-GAAP financial measures include Adjusted EBITDA, Adjusted Net Income (Loss) and Adjusted Expenses. Definitions, explanations, and reconciliations to the most comparable GAAP financial measures can be found in the appendix to this presentation (“Appendix”).
2
Slide 3
Our mission is to increase
economic freedom in the world
Visuals: One full-bleed illustration of a world map built from a regular grid of uniform solid black dots on a bright blue field. The continents are shown as dot fields: North America, Greenland, South America, Europe, Africa, Asia, Australia, Japan and the British Isles are recognisable, with the Arctic and Antarctic edges visible at the top and bottom. Dot spacing is about 1 to 1.5% of the slide width and the dots are dense over land and absent over sea. No labels, arrows, tint or gradient overlay are present; the white text sits directly on top of the dots.
Slide 4
Crypto is updating all aspects of the financial
system; Agentic Finance is an accelerant
Q3'26 EARNINGS
Trading
Total Market Crypto Trading Volume¹
has grown 41x over the past ~7 years
$11T
Total Market
Crypto Trading
Volume
in Q3'26
Stablecoins
Stablecoin Market Cap² of $304B,
expected to 10x to $3T by 2030³
$304B
Stablecoin
Market Cap
as of Q3'26
Tokenization
Tokenized RWA Supply of $39B,
expected to reach $16T by 2030⁴
$39B
RWA Market
Cap as of Q3'26⁵
Agentic Finance
Agents forecasted to process
$3-5T of transactions by 2030⁶.
Crypto is the native execution
rail for the agent-led economy:
• Global
• Efficient
• Programmable
• Always on (24/7)
2019 2020 2021 2022 2023 2024 2025 2026
2019 2020 2021 2022 2023 2024 2025 2026
2019 2020 2021 2022 2023 2024 2025 2026
[1] Refer to Definitions in the appendix for Total Market Crypto Trading Volume. [2] Stablecoin Market Capitalization is the total U.S. dollar equivalent value market capitalization of substantially all stablecoins on the last day of the quarter based on data obtained from CoinDesk Data, CoinMarketCap, and CoinGecko. [3] Per remarks delivered by Treasury Secretary Scott Bessent on November 12, 2025. [4] Source: Boston Consulting Group and ADDX. [5] Source: rwa.xyz, reported as Distributed Asset Value which measures the total value of real-world assets tokenized onchain, excluding stablecoins. [6] Source: McKinsey.
4
Visuals: Three filled area charts with no printed axis titles or y-axis scale, each with a year axis from 2019 to 2026 beneath it. Trading (left): a dark blue #0052FF line with a pale blue #A6C4FF fill, roughly flat and low near 2019, rising to a volatile plateau with a peak near 2022, then fluctuating between about 45% and 60% of the chart height through 2026, ending about 60% of the way up the axis; headline figure $11T. Stablecoins (centre): line rises from near zero in 2019 to about 2021, bumps to a local peak around 2022, dips slightly around 2023, then climbs steeply from 2024 to a top right plateau near 2026 at about 90% of the axis height; headline figure $304B. Tokenization (right): line is flat at zero from 2019 to about 2022, begins rising in 2023, then climbs steeply from 2024 to about 2026 reaching the top right; headline figure $39B. Thin grey #5A5A5A elbow connectors (about 0.1% stroke) run from each headline figure horizontally to the right and then down to the end point of each chart line. Across the lower part of the slide a curving blue #0052FF line about 1% thick starts as a pale blue #A6C4FF horizontal line at the left, sweeps upward to the right, and ends at a solid blue #0052FF dot at the top right. It has three circular markers: pale blue #A6C4FF dots at about x 9.6% y 90% and about x 45% y 89% on the baseline, and a larger pale blue dot at about x 78.7% y 71% on the curve. The three charts and curve are drawn on one 2048 by 864 pixel image, full width of the content area with no border. No photographs or logos other than the small blue C mark.
Slide 5
Q3’26 EARNINGS
Coinbase is uniquely positioned to
capitalize on this transformation
Most
Trusted
1
#1
Platform for crypto
stored globally
80+
Licenses; global
regulatory foundation
Global
Liquidity
2
#1
U.S. Crypto Spot Trading
Volume Market Share¹
10.7%
Coinbase Crypto
Trading Volume
Market Share¹
Stablecoin
Platform
3
#1
Regulated stablecoin –
Average USDC Market
Cap of $73B in Q3¹
$22B
Average USDC Held in
Coinbase Products¹
Repeatable
Innovation
4
82%
Prediction markets revenue
quarterly compound growth
since launch
49%
Subscription &
Services as % of total
net revenue in Q3
[1] Refer to Definitions in the Appendix for U.S. Crypto Spot Trading Volume Market Share, Average USDC Market Capitalization, Coinbase Crypto Trading Volume Market Share, and Average USDC Held in Coinbase Products. Trading volume measurements represent the U.S. dollar equivalent value of the
product of the quantity of assets transacted and the trade price of the underlying asset at the time the transaction was executed.
5
Visuals: Four vertical rounded-rectangle panels: panel 1 light periwinkle #B0CAFF, panel 2 bright blue #0052FF, panel 3 deep navy #031F64, panel 4 pale grey #DADFE8. Each panel holds two inset rounded tiles filled white at 21% opacity on panels 1 and 2, 14% on panel 3 and 32% on panel 4. Each panel has an outlined circle at its top-right containing the numbers 1 to 4, stroked in blue on panels 1 and 4 and in white on panels 2 and 3. Top-right of the slide is a small blue Coinbase 'C' logo. No photographs, charts, tables or diagrams.
Slide 6
coinbase
Q3 2026 Highlights
Annualized prediction markets
revenue in Q3¹
↑ $200M+
Average USDC Held in
Coinbase Products²
↑ 49% Y/Y
Coinbase Crypto Trading Volume
Market Share²
↑ 10.7%
vs. 5.6% in Q3’25
Assets on Platform² % of Total
Crypto Market Capitalization²
↑ 12.5%
Flat Y/Y, maintaining peak level
Average Daily
Loan Book Balance²
↑ 74% Y/Y
Paid Coinbase One
Subscribers²
↑ 24% Y/Y
[1] Measured based on when the product generated $200 million in quarterly annualized net revenue for the most recent qualifying quarter. [2] Refer to Definitions in the Appendix for Average USDC Held in Coinbase Products, Average Daily Loan Book Balance, Coinbase Crypto Trading Volume Market Share, Assets / on Platform, Total Crypto Market Capitalization, AOP as a % of Total Crypto Market Capitalization, and Paid Coinbase One Subscribers. Trading volume measurements represent the U.S. dollar equivalent value of the product of the quantity of assets transacted and the trade price of the underlying asset at the time the / transaction was executed.
Visuals: Four dotted-sphere illustrations across the top right, all dot-matrix halftone spheres: (1) at x 41.6%, a small 32 by 32 pixel dark navy sphere with a white crescent highlight on its right edge; (2) at x 57.9%, a bright white-dotted sphere with a blue fringe on the left; (3) at x 73.4%, a blue-dotted sphere with a white crescent highlight on its right edge; (4) at x 89.7%, a partial bright white-dotted sphere cropped by the right slide edge, 134 by 250 pixels. All sit in a row at about y 0.5 to 35% and are unboxed on the navy background. The coinbase wordmark logo in white at top left (x 2.5%, y 5.4%, 128 by 23 pixels). Six KPI cards each with a green upward arrow (#00FF19) beside the figure: $200M+ (annualized prediction markets revenue in Q3, footnote 1); 49% Y/Y (Average USDC Held in Coinbase Products); 10.7% with italic caption vs. 5.6% in Q3’25 (Coinbase Crypto Trading Volume Market Share); 12.5% with italic caption Flat Y/Y, maintaining peak level (Assets on Platform % of Total Crypto Market Capitalization); 74% Y/Y (Average Daily Loan Book Balance); 24% Y/Y (Paid Coinbase One Subscribers). No charts, tables or photographs.
Slide 7
Continued to grow Crypto Trading Volume
Market Share
Q3’26 EARNINGS
Coinbase Crypto Trading Volume Market Share¹
1.8%
2.0%
2.8%
2.2%
2.6%
4.9%
6.3%
7.1%
5.6%
8.4%
9.1%
10.3%
10.7%
Q3'23
Q4'23
Q1'24
Q2'24
Q3'24
Q4'24
Q1'25
Q2'25
Q3'25
Q4'25
Q1'26
Q2'26
Q3’26
Note: This definition and the figures above have been adjusted to capture the impact of Stablecoin Conversion activity on our platform during the period of measurement.
• Fourth consecutive quarter
of growth in Crypto Trading
Volume Market Share,
driven by gains in both spot
& derivatives
• Spot share gains driven by
stablecoin demand globally
• Derivatives share growth
driven by momentum
across our products
• INTX/Deribit integration
completed in October;
some near-term volatility in
volumes expected as
participants adjust to
combined platform
[1] Refer to Definitions in the Appendix for Coinbase Crypto Trading Volume Market Share. Trading volume measurements represent the U.S. dollar equivalent value of the product of the quantity of assets transacted and the trade price of the underlying asset at the time the transaction was executed. Coinbase
Crypto Trading Volume Market Share relies in part on third-party data and a proprietary competitor set, which may be refined over time. Figures are presented rounded; trend commentary may reflect unrounded data. Previously reported figures may not be revised if the change is immaterial, in accordance with
applicable policies.
7
Visuals: Vertical bar chart titled 'Coinbase Crypto Trading Volume Market Share' with superscript 1 (footnote reference). X-axis: 13 quarters from Q3'23 to Q3'26, labelled under each bar; no axis title or units printed. Y-axis: no axis line, tick labels or units printed; bars start from a common baseline at about 81% of slide height. Series (one series, all bars #0152FF, value labels printed above each bar in grey): Q3'23 1.8%, Q4'23 2.0%, Q1'24 2.8%, Q2'24 2.2%, Q3'24 2.6%, Q4'24 4.9%, Q1'25 6.3%, Q2'25 7.1%, Q3'25 5.6%, Q4'25 8.4%, Q1'26 9.1%, Q2'26 10.3%, Q3'26 10.7%. Bar heights for Q3'23, Q4'23 and Q2'24 are estimates (about). No legend. Highlighted point: the final bar Q3'26 at 10.7% is the tallest and is not styled differently from the others. Chart area has no gridlines. A note line sits below the bars in italic grey. Small blue Coinbase C logo at top right.
Slide 8
Coinbase stores the most crypto in the world;
return to peak AOP market share
Q3'26 EARNINGS
Assets on Platform1 and % of Total Crypto Market Capitalization1
Assets on Platform ($B)
% of Total Crypto Market Cap1
12.5%
12.3%
12.1%
12.0%
11.9%
12.5%
12.0%
12.0%
11.2%
11.2%
11.2%
11.0%
10.2%
$516
$425
$404
$376
$377
$328
$323
$294
$261
$264
$246
$191
$114
Q3'23
Q4'23
Q1'24
Q2'24
Q3'24
Q4'24
Q1'25
Q2'25
Q3'25
Q4'25
Q1'26
Q2'26
Q3'26
• Returned to peak levels of AOP market share & expanded lead as the largest platform for crypto stored globally
• Q3 inflows to ETFs we custody; offset nearly all outflows since last year
• Continued trend of strong native unit growth across customer base
• Benefits from asset mix as blue chips like BTC & ETH had stronger performance than market in Q3
[1] Refer to Definitions in the Appendix for Assets on Platform, Total Crypto Market Capitalization, and AOP as a % of Total Crypto Market Capitalization.
8
Visuals: Vertical column chart with overlaid line, in the left card. Title: 'Assets on Platform1 and % of Total Crypto Market Capitalization1' (superscript 1 marks refer to footnote [1]). Two series: (1) columns in #0152FF representing % of Total Crypto Market Cap, value printed above each column: Q3'23 10.2%, Q4'23 11.2%, Q1'24 12.1%, Q2'24 11.0%, Q3'24 11.2%, Q4'24 12.0%, Q1'25 11.9%, Q2'25 12.3%, Q3'25 12.5%, Q4'25 12.0%, Q1'26 12.0%, Q2'26 11.2%, Q3'26 12.5%. No y-axis, no gridlines, no numeric axis scale; column heights are proportional and about 40% to 60% of plot height. (2) light blue line (about #B8CCFF) of Assets on Platform ($B), with value printed inside the column at each point: Q3'23 $114, Q4'23 $191, Q1'24 $323, Q2'24 $261, Q3'24 $264, Q4'24 $404, Q1'25 $328, Q2'25 $425, Q3'25 $516, Q4'25 $376, Q1'26 $294, Q2'26 $246, Q3'26 $377. X-axis categories are quarters Q3'23 to Q3'26 in grey #595959 text, no axis line. Legend top-left of chart: light blue dot 'Assets on Platform ($B)', dark blue dot '% of Total Crypto Market Cap1'. No points are highlighted with a special marker. No photograph, logo other than the header mark.
Slide 9
Q3'26 EARNINGS
Leading stablecoin platform, with ~30% of Average
USDC Held in Coinbase Products
Average USDC Held in Coinbase Products¹ and Average USDC Market Capitalization¹
~3x USDC Circulation
~9x USDC Held in Coinbase Products
$26 $25 $28 $33 $35 $38 $54 $61 $68 $76 $75 $77 $73
$3 $3 $4 $6 $7 $8 $12 $14 $15 $18 $19 $20 $22
Q3'23 Q4'23 Q1'24 Q2'24 Q3'24 Q4'24 Q1'25 Q2'25 Q3'25 Q4'25 Q1'26 Q2'26 Q3’26
Average USDC Held in Coinbase Products ($B)
Average Off-Platform USDC Balances ($B)
• New ATH of $22B Average
USDC Held in Coinbase
Products in Q3, or ~30% of
average USDC Market Cap
• Reflects full quarter impact of
Hyperliquid USDC balance,
which arrived in June
• Over the past year, we have
captured ~50% of all USDC
economics; onchain
partnerships and deeper
product integration driving
greater USDC adoption
Note: Figures presented may not calculate precisely due to rounding.
[1] Refer to Definitions in the Appendix for Average USDC Held in Coinbase Products and Average USDC Market Capitalization.
9
Visuals: Stacked column chart, titled 'Average USDC Held in Coinbase Products¹ and Average USDC Market Capitalization¹' (heading, not an axis title). 13 quarterly columns from Q3'23 to Q3'26, left to right, no visible y-axis, no gridlines, no axis ticks. Each column has a dark blue bottom segment #0052FF (series 'Average USDC Held in Coinbase Products ($B)', values printed inside the segment in white: Q3'23 $3, Q4'23 $3, Q1'24 $4, Q2'24 $6, Q3'24 $7, Q4'24 $8, Q1'25 $12, Q2'25 $14, Q3'25 $15, Q4'25 $18, Q1'26 $19, Q2'26 $20, Q3'26 $22) and a light blue top segment #A4C2F4 (series 'Average Off-Platform USDC Balances ($B)', segment values not printed; about 23, 22, 24, 27, 28, 30, 42, 47, 53, 58, 56, 57, 51 $B by subtraction from the printed totals). Printed totals above each column: $26, $25, $28, $33, $35, $38, $54, $61, $68, $76, $75, $77, $73. Dark segments all sit on a common baseline at about y 76.9 percent of slide height; scale about 1.95 $B per 1 percent of slide height, so dark segment heights are about 1.5, 1.5, 2.1, 3.1, 3.6, 4.1, 6.2, 7.2, 7.7, 9.2, 9.7, 10.3, 11.3 percent. Columns about 4.1 percent wide on a pitch of about 5.1 percent. Annotation: a dark grey #404040 bracket arrow above the columns: a vertical line down at x about 6.8 percent from y 33.8 to 56.4 percent, a horizontal line at y 33.8 percent running right from x 6.8 to about 25.8 percent (interrupted by the label), and continuing from about 49.4 to 68.4 percent ending in a filled arrowhead pointing right. Blue labels '~3x USDC Circulation' and '~9x USDC Held in Coinbase Products' sit centred above the horizontal line. Legend below the chart: dark blue square #0052FF then 'Average USDC Held in Coinbase Products ($B)', light blue square #A4C2F4 then 'Average Off-Platform USDC Balances ($B)'. No highlighted points. Flat vector style, no photographs or logos other than the header mark.
Slide 10
2026 Priorities
Q3’26 EARNINGS
1
Everything
Exchange
Trade every asset class in one place:
crypto, equities, prediction markets,
commodities, and FX with deep liquidity
and capital efficiency.
2
Stablecoins
& Payments
Enable money to move globally at the
speed of the internet.
3
Onchain
Update the financial system by bringing
trading, payments, and agents onchain.
10
Visuals: Three rounded rectangular cards, no photographs. Left card: light blue #D0E2FF fill with blue #0052FF heading and body text, circled numeral 1 outlined in #0052FF. Middle card: bright blue #0052FF fill with white heading and body text, circled numeral 2 outlined in white. Right card: deep navy #001F64 fill with white heading and body text, circled numeral 3 outlined in white. Small blue logo mark at top-right of the slide, a stylised C-shaped circle in #0052FF.
Slide 11
1
Derivatives outpaced the market, continued
volume market share gains
Q3’26 EARNINGS
Crypto Derivatives Trading Volume¹ TTM ($B)
Crypto Derivatives Trading Volume (TTM)
Crypto Derivatives Trading Volume Market Share¹ (TTM)
$4,341
$4,224
$4,221
$3,996
$3,241
$2,520
$1,570
$851
$311
Q3'24
Q4'24
Q1'25
Q2'25
Q3'25
Q4'25
Q1'26
Q2'26
Q3’26
• Building broadest suite of regulated derivatives globally
◦ Derivatives volume continues to outpace the market
▪ 179% compound annual growth last 2 years
◦ Leading open interest in global options; ATH open interest
in the U.S.
◦ 4th consecutive quarter of derivatives trading volume
market share gains
• What’s Next:
◦ INTX/Deribit integration completed in October, creating the
only unified, regulated, global exchange for U.S. and ex-
U.S. customers
◦ Some near-term volatility expected as participants adjust
◦ Coinbase Pro relaunch in Q4 - spot, futures, perpetuals,
options, and equities in a unified portfolio for more buying
power and a modular, advanced trading platform
[1] Refer to Definitions in the Appendix for Crypto Derivatives Trading Volume and Crypto Derivatives Trading Volume Market Share.
11
Visuals: Chart: vertical bar chart with a line series overlaid, titled Crypto Derivatives Trading Volume¹ TTM ($B). Bars are solid blue #0052FF with no gaps issues and no visible axis lines, gridlines, or y-axis tick labels; the y-axis unit is $B, range not printed. Category axis labels from left to right: Q3'24, Q4'24, Q1'25, Q2'25, Q3'25, Q4'25, Q1'26, Q2'26, Q3’26. Printed bar values in $B: Q3'24 $311; Q4'24 $851; Q1'25 $1,570; Q2'25 $2,520; Q3'25 $3,241; Q4'25 $3,996; Q1'26 $4,224; Q2'26 $4,221; Q3’26 $4,341. Bar heights are proportional to these values with the baseline at about y 85.5%. Value labels sit centred above each bar in grey #595959 semibold. Second series: a light periwinkle line (about #B3C7F5, about 0.5% of slide height stroke) with no markers and no printed values; about it starts near the Q3'24 bar centre at a low point and rises steadily, crossing above the bars' tops in the middle years and ending at the top right near the Q3’26 bar. Legend above the plot, centred horizontally in the chart panel: a blue square swatch #0052FF followed by 'Crypto Derivatives Trading Volume (TTM)', then a light blue line swatch followed by 'Crypto Derivatives Trading Volume Market Share (TTM)'. No highlighted points. Only the nine bars and the line are present; no other graphics. Footnote superscript 1 refers to the appendix. Circle badge: a solid blue #0052FF filled circle with a white numeral 1, about 3.3% wide, centred at the title's first line. Corner logo: small blue Coinbase C mark #0052FF at the top right.
Slide 12
Q3’26 EARNINGS
Prediction markets grew to over $200M in
annualized revenue1
1
Prediction Markets Revenue
82% Quarterly
Compound Growth
Q1'26
Q2'26
Q3'26
• One of our fastest growing products by revenue in history
◦ Diversified contract mix with non-sports categories
showing strong growth through seasonally slower sports
months
◦ Recurring contracts (e.g., crypto volatility) driving durable
engagement between major events
• Expanding user base and growing platform engagement
◦ Daily traders up 60%+ Q/Q2
◦ Incrementality: users who trade predictions are driving
incremental spot volume
• What’s Next:
◦ Broaden Engagement: event hubs (e.g., midterms), CB1
integration, and a new prosumer product
◦ Improving Economics: building toward USDC-native, in-
house clearing and end-to-end infrastructure
[1] Measured based on when the product generated $200 million in quarterly annualized net revenue for the most recent qualifying quarter. [2] Measured as daily users that executed a predictions markets trade, averaged over the period of measurement.
12
Visuals: Bar chart titled Prediction Markets Revenue with three solid blue (#0152FF) vertical bars for Q1'26, Q2'26 and Q3'26, sitting on a common baseline at about y 85.8 and ordered left to right by increasing height; the bars have no axes, gridlines, y-axis scale, legend or printed data values. Bar heights are proportional: Q1'26 bar about 13.5% of slide height, Q2'26 bar about 28.0%, Q3'26 bar about 45.1%. A dark grey (#404040) bracket line starts as a vertical line at x 13.1 from y 35.6 down to y 69.3 above the Q1'26 bar, runs horizontally at y 35.6 to the label '82% Quarterly Compound Growth' and continues right to an arrowhead pointing right at x 40.0, indicating growth from Q1'26 to Q3'26 across the bars. Quarter labels are grey (#595959) centred under each bar. Small blue superscript 1 in the title and superscript 2 after Q/Q in the bullets refer to footnotes. Blue circular badge with white numeral 1 at top left. Small blue C-shaped logo at top right, no photographs.
Slide 13
CB1 Subscribers are our most valuable users...
and reached a new all-time high in Q3
Q3’26 EARNINGS
Paid Coinbase One Subscribers¹ have:
3.5x
Higher ARPU²
4.2x
Higher Balances per User³
50%+
Higher LT Trading Retention⁴
Membership benefits
Basic
$4.99/mo • $49.99/yr
Preferred
$29.99/mo • $299.99/yr
Premium
$299.99/mo • $2,999.99/yr
Zero trading fees⁵
$500/mo
$10K/mo
Unlimited
Staking rewards boost
5% more
10% more
15% more
Account protection⁶
$1K coverage
$10K coverage
$250K coverage
USDC benefits
3.75% APY rewards on USDC and up to 7%+ when lending USDC⁷
Coinbase One Card
Up to 4% BTC back, 5% back on travel⁸
Additional benefits
1% back on mortgages, free wire transfers, priority support/concierge, and more
[1] Refer to Definitions in the Appendix for Paid Coinbase One Subscribers. [2] Measured as revenue generated across trading, staking, instant transfer, Borrow/Lend products, and subscriptions on a per user basis for Paid Coinbase One Subscribers relative to non-subscriber retail users during the period of measurement. Non-subscriber retail users are consumers that generated revenue during the period of measurement. [3] Measured as the value of the balance in a consumer account at the end of the period on a per user basis for Paid Coinbase One Subscribers relative to non-subscriber consumers. Non-subscriber consumers are consumers that have non-zero account balances as of the date of measurement. [4] Measured as long-term trading retention of Paid Coinbase One Subscribers relative to non-subscriber retail trading users. Non-subscriber retail trading users are consumers that are not subscribed to Coinbase One and completed a trade during the period of measurement. Long-term trading retention is measured as the average quarterly trading retention of users over a two-year lookback period. Trading retention is measured as the percent of users completing at least one trade during the period of measurement. [5] Spot crypto trades only. Coinbase Advanced and DEX fees excluded. A spread applies. [6] Limited warranty against unauthorized crypto transfers. [7] Rewards rates and lending rates are subject to change. [8] Rewards rates are tiered at 2%, 3%, and 4%, based on your assets on Coinbase. Note: Some membership benefits are not available in all regions and are not available to all users.
13
Visuals: Left panel: a light grey (#ECEDF1) rounded panel containing three stacked square-cornered metric cards. Card 1 (light blue #B0CAFF) shows 3.5x in blue with label Higher ARPU², card 2 (bright blue #0052FF) shows 4.2x in white with label Higher Balances per User³, card 3 (navy #031F64) shows 50%+ in white with label Higher LT Trading Retention⁴. No chart. Right: a comparison table with a header row and six body rows. Columns: row label column (white, no fill), Basic column (#F0F4FF), Preferred column (#B0C9FF), Premium column (#031F64). Header row: Membership benefits with a blue (#0052FF) rounded Coinbase One icon at left, then Basic $4.99/mo • $49.99/yr, Preferred $29.99/mo • $299.99/yr, Premium $299.99/mo • $2,999.99/yr. Row 1 Zero trading fees⁵: $500/mo, $10K/mo, Unlimited. Row 2 Staking rewards boost: 5% more, 10% more, 15% more. Row 3 Account protection⁶: $1K coverage, $10K coverage, $250K coverage. Row 4 USDC benefits: merged across the three tier columns, 3.75% APY rewards on USDC and up to 7%+ when lending USDC⁷. Row 5 Coinbase One Card: merged, Up to 4% BTC back, 5% back on travel⁸. Row 6 Additional benefits: merged, 1% back on mortgages, free wire transfers, priority support/concierge, and more. Coinbase logo: a small blue C at top right. Numbered marker: a solid blue circle with white 1 at title left.
Slide 14
2
Scaling stablecoin payments on Coinbase
infrastructure
Q3’26 EARNINGS
Powering businesses with full stack stablecoin solutions
Coinbase Developer Platform TPV1
160% Quarterly
Compound Growth
Q4’25
Q1’26
Q2’26
Q3’26
[1] Coinbase Developer Platform Total Payments Volume refers to the U.S. dollar equivalent value of completed payment transactions processed through Coinbase Developer Platform payment products during the period of measurement. Coinbase Developer Platform TPV includes volume from payment
acceptance, payments APIs, manual custody transfers, payment orchestration, consumer-facing payment flows, third-party activity via authorized OAuth integrations, and fiat-crypto or fiat-stablecoin funding transactions. x402 micropayment protocol volume is not included in this figure.
14
Visuals: Chart (right panel): vertical bar chart, column chart with four blue bars; no y-axis, no gridlines, no numeric value labels. Categories on the x-axis left to right: Q4’25, Q1’26, Q2’26, Q3’26 (grey labels beneath each bar). Bars are solid #0152FF. Bar heights: Q4’25 about 2.2% of slide height, Q1’26 about 4.1%, Q2’26 9.1%, Q3’26 39.1% (values are estimates marked 'about' where not printed; the slide prints no numeric values). Bar baseline shared at y about 82.6%. The growth annotation is a dark grey (#3D3D3D) elbow arrow: a vertical line from about (58.1%, 77.3%) up to (58.1%, 35.7%), then a horizontal line to the right, interrupted by the blue label '160% Quarterly Compound Growth' centred near x 75, then continuing to a solid arrowhead at about x 90.7, y 35.7. No legend. No highlighted points beyond the blue colour of the Q3’26 bar. Logos (left panel, on a white translucent inner box): Citi (black wordmark with arc above the letters), Shopify (black bag icon with italic black wordmark 'shopify'), PNC (black circular triangle-play mark with serif 'PNC' wordmark and ® symbol), checkout.com (black diamond-like X mark with 'checkout.com' wordmark, bold 'checkout' and regular '.com'), Cloudflare (black cloud icon above spaced uppercase 'CLOUDFLARE' with ® mark), Nium (black spaced uppercase 'NIUM' wordmark). Logos are arranged in a 2 by 3 grid, two columns and three rows, all black on the light box. Logo boxes: Citi x11.6 y42.0 w9.8 h11.2; Shopify x27.9 y43.1 w16.1 h9.0; PNC x8.9 y59.0 w15.2 h8.2; checkout.com x25.5 y57.4 w21.0 h11.6; Cloudflare x9.5 y72.3 w14.0 h8.2; Nium x29.0 y73.2 w13.9 h6.3. None are cropped. Small icon: Coinbase blue C mark top-right.
Slide 15
Q3’26 EARNINGS
3
Base is a leading infrastructure for onchain
trading, payments, and financing
Base is a leader across trading and
onchain capital markets
#1
L2 for spot crypto
trading in Q3¹
#1
L2 in DeFi Total Value
Locked as of Q3²
Coinbase Average Borrow/Lend
Balances³ ($M)
$1B+ Y/Y growth
$1,866
$1,491
$1,330
$1,230
$610
Q3'25 Q4'25 Q1'26 Q2’26 Q3’26
Coinbase Tokenized Stock Volume⁴
$1B+ volume on
Base since launch
08/19 08/26 09/02 09/09 09/16 09/23 09/30
[1] Spot crypto trading refers to the total U.S. dollar equivalent value of crypto and stablecoin pair spot trading settled on decentralized exchanges on major L2 blockchain networks. This figure excludes tokenized equities volume. Source: DefiLlama and Allium. [2] DeFi total value locked ("TVL") refers to the total U.S. dollar equivalent value of assets held in smart contracts of all protocols on major L2 blockchain networks as of the date of measurement. Source: DefiLlama. [3] Refer to Definitions in the Appendix for Average Borrow/Lend Balances. [4] Coinbase Tokenized Stock Volume refers to the total U.S. dollar equivalent value of trading volume in tokenized equities for which Coinbase is the tokenizer, settled on the Base blockchain network. Source: Token Terminal.
15
Visuals: Three elements. (1) Left panel: two stacked stat boxes, the upper light blue box reading #1 and L2 for spot crypto trading in Q3 with footnote 1, the lower solid blue box reading #1 and L2 in DeFi Total Value Locked as of Q3 with footnote 2; no chart. (2) Middle panel: vertical bar chart titled Coinbase Average Borrow/Lend Balances ($M) with footnote 3; five solid blue (#0152FF) bars with printed values in grey #595959 above each bar: Q3'25 $610, Q4'25 $1,230, Q1'26 $1,330, Q2'26 $1,491, Q3'26 $1,866; x-axis categories Q3'25, Q4'25, Q1'26, Q2'26, Q3'26; no y-axis shown, no legend; a dark grey (#444444) bracket line starts at the top of the Q3'25 bar area, rises vertically, runs horizontally and ends in a right-pointing arrowhead, with the blue label $1B+ Y/Y growth sitting on the horizontal segment. (3) Right panel: vertical bar chart titled Coinbase Tokenized Stock Volume with footnote 4; seven solid blue bars with no printed values, values about: 08/19 about 1% of plot height, 08/26 about 22%, 09/02 about 34%, 09/09 about 47%, 09/16 about 83%, 09/23 about 75%, 09/30 about 100%; x-axis labels 08/19, 08/26, 09/02, 09/09, 09/16, 09/23, 09/30; no y-axis, no legend; a dark grey bracket line starts at the bottom of the 08/19 bar, rises vertically to a horizontal segment and ends in a right-pointing arrowhead, with the blue label $1B+ volume on Base since launch sitting on the horizontal segment. No photographs, icons or other images.
Slide 16
Q3’26 EARNINGS
The future of finance is onchain, and / Coinbase is best positioned to power it
1
2
3
The onchain / economy has / reached escape / velocity
Coinbase's full / stack platform / is powering it
The next frontier / is agentic and on / Coinbase
16
Visuals: Three filled rounded rectangles, each containing a numbered outlined circle and a large statement at the bottom. Card 1 is light blue #D0E2FF with a blue outlined circle containing '1' and blue text. Card 2 is bright blue #0052FF with a white outlined circle containing '2' and white text. Card 3 is dark navy #001F64 with a white outlined circle containing '3' and white text. Circles are thin outlines about 0.2% of slide width in stroke weight, about 4.7% of slide width in diameter, positioned top-left in each card. A small Coinbase blue circular 'C' logo mark sits top-right next to 'Q3’26 EARNINGS'.
Slide 17
Q3 Summary / Financial Results
Q3’26 EARNINGS
Total revenue
$1.2B
Transaction revenue
$590M
Subscription & services revenue
$570M
Net income
$719M
Adjusted EBITDA1
$333M
Cash & cash equivalents
$8.6B
[1] Adjusted EBITDA is a non-GAAP financial measure. See Appendix for definition and reconciliation.
Visuals: Dot-matrix candlestick illustration: about six to seven stacked-dot candlestick bars in white, of varying heights and body lengths, with wicks extending upward to the top edge of the slide. The bars span roughly x 42% to 89% and run from the top edge down to about y 35%, where they meet the top edges of the cards. The bars are built from small round white dots on the blue background, with no outline or shadow. Header tag: the text Q3’26 EARNINGS with a small logo at its right. Logo: a small white circular mark with a blue C-like inner shape, at about x 96.5% y 4.5%, roughly 1.5% by 2% in size. Six rounded filled rectangles act as cards for the metrics; they contain no charts or icons.
Slide 18
Q3 Report Card
Q3’26 EARNINGS
The business is healthy
Macro headwinds have
begun to shift
Continued Gains in Crypto Market Share
Grew Coinbase Crypto Trading Volume Market Share⁴ for 4th
consecutive quarter, gaining share in both Spot and Derivatives
Prediction Markets are Scaling Rapidly
$200M+ annualized revenue¹; 82% quarterly compound growth²
Diversification through Subscription & Services
S&S grew +3% Q/Q to 49% of net revenue
Managing Expenses
Adjusted Expenses³ lower than Q3 outlook
Q3 Showed Soft Crypto Market Conditions...
Total Market Crypto Spot Trading Volume⁴ and Total Market
Crypto Derivatives Trading Volume⁴ declined 6% and 11% Q/Q,
respectively
...and Low Average Volatility...
Crypto Asset Volatility⁴ declined 15% Q/Q and reached new multi-
year lows suppressing trading activity
...but Prices Rebounded in September
Total Crypto Market Capitalization⁴ was up 37% Q/Q
[1] Measured based on when the product generated $200 million in quarterly annualized net revenue for the most recent qualifying quarter. [2] Since launch. [3] Adjusted Expenses is a non-GAAP financial measure. See Appendix for definition and reconciliation. [4] Refer to Definitions in the Appendix for Coinbase
Crypto Trading Volume Market Share, Total Market Crypto Spot Trading Volume, Total Market Crypto Derivatives Trading Volume, Crypto Asset Volatility, and Total Crypto Market Capitalization.
18
Visuals: A Coinbase-style blue circular C logo mark sits at the top right corner beside the header Q3’26 EARNINGS. Superscript footnote markers (1, 2, 3, 4) appear inline in the text. No charts, photographs or illustrations.
Slide 19
Q3 results reflect continued expense
discipline in the face of macro headwinds
Q3’26 EARNINGS
Metric
Q3 Outlook
(July 2026)
Q3 Actuals
Subscription & Services Revenue
$500-$580 million
$570 million
Transaction Expenses
Mid-teens
as a % of net revenue
16.8%
Adjusted Expenses1
$980-$1,080 million
$975 million
Stock-based Compensation
~$245 million
$233 million
[1] Adjusted Expenses is a non-GAAP financial measure. See Appendix for definition and reconciliation.
19
Visuals: Table with three columns and four data rows, plus header cells. Columns: Metric | Q3 Outlook (July 2026) | Q3 Actuals. Row 1: Subscription & Services Revenue | $500-$580 million | $570 million. Row 2: Transaction Expenses | Mid-teens, as a % of net revenue | 16.8%. Row 3: Adjusted Expenses (superscript 1) | $980-$1,080 million | $975 million. Row 4: Stock-based Compensation | ~$245 million | $233 million. Header 'Metric' and 'Q3 Outlook' are outlined rounded rectangles with a 1 px blue stroke (#0052FF) and no fill, roughly 2.5%-33% and 34.5%-65% of width, y 22.5%-33%. Header 'Q3 Actuals' is a solid blue rounded rectangle (#0052FF, fill, no stroke) spanning about 66.6%-97.4% of width, y 22.5%-33%. Data rows are separated by four light grey hairline rules (about #D9DEE7, 1 px) spanning about 3.2%-97.8% of width at y about 48.9%, 60.7%, 73.2% and 85.5%. Actuals values are blue. A small blue circular 'C'-style logo mark sits at the top right beside the running header. No photographs, charts or illustrations.
Slide 20
Total revenue of $1.2B stable Q/Q as market
sentiment began to shift
Q3’26 EARNINGS
Total Revenue
TTM Total Revenue
Total Revenue ($M)
$2,272
$2,034
$1,869
$1,781
$1,638
$1,497
$1,450
$1,413
$1,220
$1,216
$1,205
$954
$674
Q3'23
Q4'23
Q1'24
Q2'24
Q3'24
Q4'24
Q1'25
Q2'25
Q3'25
Q4'25
Q1'26
Q2’26
Q3’26
• $1.2B total revenue was flat
Q/Q against a backdrop of a
decline in Total Market
Crypto Trading Volume1
(-10% Q/Q) and flat Average
Crypto Market Capitalization1
• Transaction revenue
declined 1% Q/Q as Crypto
Asset Volatility1 reached
multi-year lows
• Subscription & services
represented 49% of net
revenue, providing
diversification and support
independent of transaction
revenue
[1] Refer to Definitions in the Appendix for Total Market Crypto Trading Volume, Average Crypto Market Capitalization, and Crypto Asset Volatility.
20
Visuals: Vertical column chart titled Total Revenue with a light-blue TTM Total Revenue line overlaid on dark-blue bars for Total Revenue ($M). Thirteen quarters from Q3'23 to Q3'26 are shown left to right, each as a solid #0052FF bar with its value printed above it: Q3'23 $674, Q4'23 $954, Q1'24 $1,638, Q2'24 $1,450, Q3'24 $1,205, Q4'24 $2,272, Q1'25 $2,034, Q2'25 $1,497, Q3'25 $1,869, Q4'25 $1,781, Q1'26 $1,413, Q2'26 $1,220, Q3'26 $1,216. No y-axis, tick marks, gridlines or baseline are printed; bar heights are proportional to the values from a zero baseline at about 86.9% of slide height. The TTM line values are not printed; its points are about: Q3'23 near the top of the $674 bar, peaking near the Q3'25 bar (about $2,500 equivalent) and falling to about $2,000 equivalent at Q3'26. Legend at top left of chart: light-blue circle (#8AB4FF) labelled TTM Total Revenue and dark-blue circle (#0052FF) labelled Total Revenue ($M). No highlighted points; all bars share one colour. Chart is not cropped and sits inside the card.
Slide 21
Q3'26 EARNINGS
Prediction market growth cushioned transaction / revenue amid multi-period lows in crypto volatility
Transaction Revenue
Average Crypto Market Capitalization1
Other Transaction Revenue ($M)
Institutional Transaction Revenue ($M)
Consumer Transaction Revenue ($M)
$1,556 $1,262 $1,077 $1,046 $983 $781 $764 $756 $599 $590 $573 $529 $289
$1,347 $1,096 $935 $844 $734 $665 $650 $567 $483 $469 $452 $450 $247
$141 $136 $135 $185 $99 $100 $92 $85 $64 $64 $61 $55 $54 $53 $53 $47 $48 $68 $68 $68 $56 $34 $53 $64
Q3'23 Q4'23 Q1'24 Q2'24 Q3'24 Q4'24 Q1'25 Q2'25 Q3'25 Q4'25 Q1'26 Q2'26 Q3'26
• Consumer transaction / revenue of $450M (~flat Q/ / Q) driven by 9% and 6% / declines in Consumer Crypto / Spot Trading Volume1 and / Crypto Derivatives Trading / Volume1, respectively, / cushioned by continued / growth in prediction markets
• Institutional transaction / revenue of $92M (-8% Q/Q) / roughly in line with market / declines
• Other transaction revenue / was $48M (+2% Q/Q)
[1] Refer to Definitions in the Appendix for Average Crypto Market Capitalization, Crypto Spot Trading Volume, and Crypto Derivatives Trading Volume.
21
Visuals: Combined bar and line chart titled 'Transaction Revenue' in the left panel. Stacked vertical bars, one per quarter from Q3'23 to Q3'26 (13 bars), with the total printed above each bar in grey bold type. Stack segments from bottom: Consumer Transaction Revenue ($M) in dark navy #00184D, Institutional Transaction Revenue ($M) in bright blue #0052FF, Other Transaction Revenue ($M) in light periwinkle #B3C8FF, with a light grey segment area capped by the total. Segment values are printed inside the segments in white: Consumer values printed as Q3'23 $247, Q4'23 $469, Q1'24 $935, Q2'24 $665, Q3'24 $483, Q4'24 $1,347, Q1'25 $1,096, Q2'25 $650, Q3'25 $844, Q4'25 $734, Q1'26 $567, Q2'26 $452, Q3'26 $450. Institutional values printed as Q1'24 $85, Q2'24 $64, Q3'24 $55, Q4'24 $141, Q1'25 $99, Q2'25 $61, Q3'25 $135, Q4'25 $185, Q1'26 $136, Q2'26 $100, Q3'26 $92; Q3'23 and Q4'23 institutional segments are thin and unlabelled. Other values printed as Q1'24 $56, Q2'24 $53, Q3'24 $34, Q4'24 $68, Q1'25 $68, Q2'25 $54, Q3'25 $68, Q4'25 $64, Q1'26 $53, Q2'26 $47, Q3'26 $48; Q3'23 and Q4'23 other segments are thin and unlabelled. Totals above bars: Q3'23 $289, Q4'23 $529, Q1'24 $1,077, Q2'24 $781, Q3'24 $573, Q4'24 $1,556, Q1'25 $1,262, Q2'25 $764, Q3'25 $1,046, Q4'25 $983, Q1'26 $756, Q2'26 $599, Q3'26 $590. No y-axis or axis units are printed; the category axis is the quarter labels. A light grey line (about #D9DDE5, approximately 3 px wide, no markers) traces Average Crypto Market Capitalization1 with no printed values: it starts low at Q3'23, rises through Q1'24, dips around Q3'24, jumps sharply to the highest point at about Q3'25, then falls to about the Q2'26 level and holds flat into Q3'26. The line crosses over the Q4'24 and Q3'25 bars. Legend at top left of the chart panel with four circular swatches: light grey circle (#D9DDE5) for Average Crypto Market Capitalization1, light blue circle (#B3C8FF) for Other Transaction Revenue ($M), bright blue circle (#0052FF) for Institutional Transaction Revenue ($M), navy circle (#00184D) for Consumer Transaction Revenue ($M). No highlighted points. Right panel holds bullet text only, no image. Blue logo top right is a small stylised C-shaped mark in #0052FF.
Slide 22
Q3’26 EARNINGS
Subscription and services revenue reached 49%
of net revenue, demonstrating continued diversification
Subscription and Services Revenue
Blockchain Rewards ($M)
Other Subscription & Services ($M)
% of Net Revenue
Stablecoin Revenue ($M)
Interest and Finance Fee Income ($M)
53% 41% 32% 43% 49% 29% 35% 45% 41% 41% 44% 48% 49%
$327 $364 $499 $585 $542 $627 $675 $632 $717 $694 $584 $555 $570
$165 $161 $186 $227 $233 $212 $274 $309 $325 $331 $305 $292 $307
$74 $95 $151 $185 $155 $215 $197 $145 $185 $152 $101 $83 $86
$43 $49 $67 $69 $64 $66 $63 $59 $65 $60 $68 $66 $69
$45 $60 $96 $104 $90 $135 $141 $119 $143 $152 $109 $114 $109
Q3'23 Q4'23 Q1'24 Q2'24 Q3'24 Q4'24 Q1'25 Q2'25 Q3'25 Q4'25 Q1'26 Q2'26 Q3’26
• Stablecoin revenue of
$307M (+5% Q/Q) driven by new
ATH in Average USDC Held in
Coinbase Products¹ and higher
interest rates, partially offset by
off-platform balances
• Blockchain rewards of $86M (+3%
Q/Q) from price effects and
growth in native units staked
• Interest & finance fee income of
$69M (+4% Q/Q) reflecting ATH in
Average Daily Loan Book Balance¹
• Other S&S of $109M (-4% Q/Q) as
ATH Paid CB1 Subscribers¹
partially offset declines in
milestone-based partnership &
other revenue
[1] Refer to Definitions in the Appendix for Average Daily Loan Book Balance, Average USDC Held in Coinbase Products, and Paid Coinbase One Subscribers.
22
Visuals: Stacked column chart with a line overlay, inside a light-grey rounded card. Title above the plot: 'Subscription and Services Revenue' (bold). Legend in two rows above the plot: Blockchain Rewards ($M) bright blue dot; Other Subscription & Services ($M) light grey dot; % of Net Revenue grey line marker; Stablecoin Revenue ($M) navy dot; Interest and Finance Fee Income ($M) pale blue dot. Thirteen stacked columns, one per quarter Q3'23 to Q3'26, with no visible value axis; each column's total is printed in bold blue above it. Stack order bottom to top: Stablecoin Revenue (navy, values about 165, 161, 186, 227, 233, 212, 274, 309, 325, 331, 305, 292, 307 in $M), Blockchain Rewards (bright blue, 74, 95, 151, 185, 155, 215, 197, 145, 185, 152, 101, 83, 86), Interest and Finance Fee Income (pale blue, 43, 49, 67, 69, 64, 66, 63, 59, 65, 60, 68, 66, 69), Other Subscription & Services (light grey, 45, 60, 96, 104, 90, 135, 141, 119, 143, 152, 109, 114, 109). Column totals: $327, $364, $499, $585, $542, $627, $675, $632, $717, $694, $584, $555, $570. Above the columns a light grey line with markers, no axis, labelled % of Net Revenue: 53%, 41%, 32%, 43%, 49%, 29%, 35%, 45%, 41%, 41%, 44%, 48%, 49% (line values printed, not estimated). Highlighted: the totals are bold blue; the Q3'25 total $717 is the highest and the Q4'24 line point 29% the lowest. Category labels under the columns in grey. Columns are about 4.1% of slide width with equal gaps. Right card contains bulleted commentary, not a chart.
Slide 23
Q3’26 EARNINGS
Demonstrating cost discipline while investing
strategically and driving productivity with AI
Adjusted Expenses 1
Sales & Marketing ($M)
General & Administrative ($M)
Technology & Development ($M)
Intangible Amortization ($M)
$640 $735 $737 $841 $867 $952 $992 $972 $1,088 $1,229 $1,133 $1,035 $975
$78 $106 $99 $165 $165 $226 $247 $236 $260 $315 $267 $240 $243
$253 $314 $287 $320 $330 $363 $394 $354 $418 $453 $376 $357 $319
$323 $323 $358 $364 $377 $369 $355 $387 $431 $497 $526 $473 $447
$(13) $(9) $(7) $(9) $(6) $(5) $(5) $(5) $(21) $(36) $(36) $(35) $(34)
Q3'23 Q4'23 Q1'24 Q2'24 Q3'24 Q4'24 Q1'25 Q2'25 Q3'25 Q4'25 Q1'26 Q2’26 Q3’26
15% 14% 14% 14% 15% 15% 16% 18% 14% 13% 15% 16% 17%
Transaction Expense as % of Net Revenue
3,427 3,416 3,416 3,486 3,672 3,772 3,959 4,279 4,795 4,951 4,988 4,321 4,204
FTEs
• T&D of $447M (-5% Q/Q)
primarily driven by a full
quarter benefit of the May
2026 cost reductions
• G&A of $319M (-11% Q/Q)
primarily driven by lower
professional services spend
• S&M of $243M (+1% Q/Q)
due to higher USDC rewards,
partially offset by lower
media and event spend
• Transaction expense at 17%
of net revenue (+32 bps Q/Q)
driven by exchange fees
associated with prediction
markets growth
[1] Adjusted Expenses is a non-GAAP financial measure. See Appendix for definition and reconciliation.
23
Visuals: Stacked column chart titled Adjusted Expenses with superscript 1 referencing footnote 1. Thirteen quarterly columns from Q3'23 to Q3'26, each stacked from bottom: Technology & Development (dark navy) at the base, General & Administrative (bright blue) above, Sales & Marketing (light blue) at top, and a thin grey Intangible Amortization strip at the very base. Column total labels above each bar in grey: $640, $735, $737, $841, $867, $952, $992, $972, $1,088, $1,229, $1,133, $1,035, $975. Printed segment values: Technology & Development $323, $323, $358, $364, $377, $369, $355, $387, $431, $497, $526, $473, $447; General & Administrative $253, $314, $287, $320, $330, $363, $394, $354, $418, $453, $376, $357, $319; Sales & Marketing $78, $106, $99, $165, $165, $226, $247, $236, $260, $315, $267, $240, $243. Intangible Amortization printed below the axis as $(13), $(9), $(7), $(9), $(6), $(5), $(5), $(5), $(21), $(36), $(36), $(35), $(34). No y-axis, no value scale and no axis units printed; bar heights are proportional to totals, about $1,229 tallest and $640 shortest. Legend top-left in four rows with dot markers: Sales & Marketing ($M) light blue, General & Administrative ($M) bright blue, Technology & Development ($M) navy, Intangible Amortization ($M) grey. No highlighted points. Below the axis are two thin grey horizontal rules; the first band shows Transaction Expense as % of Net Revenue per quarter: 15%, 14%, 14%, 14%, 15%, 15%, 16%, 18%, 14%, 13%, 15%, 16%, 17%, with the row caption Transaction Expense as % of Net Revenue centred beneath. The second band shows FTEs per quarter: 3,427, 3,416, 3,416, 3,486, 3,672, 3,772, 3,959, 4,279, 4,795, 4,951, 4,988, 4,321, 4,204, with the caption FTEs beneath. Logo: a small blue C-shaped mark at top right. No photographs, icons or illustrations.
Slides 24 to 42 continue in the full text file.
Download this deck
The hosted PDF of every library deck is free for readers of the SlideDeck Co newsletter. Join with your email and the viewer and download appear here.
Preparing a results presentation or business update of your own? The SlideDeck Co Standard Deck is a slide library for business reviews, updates and plans.







