
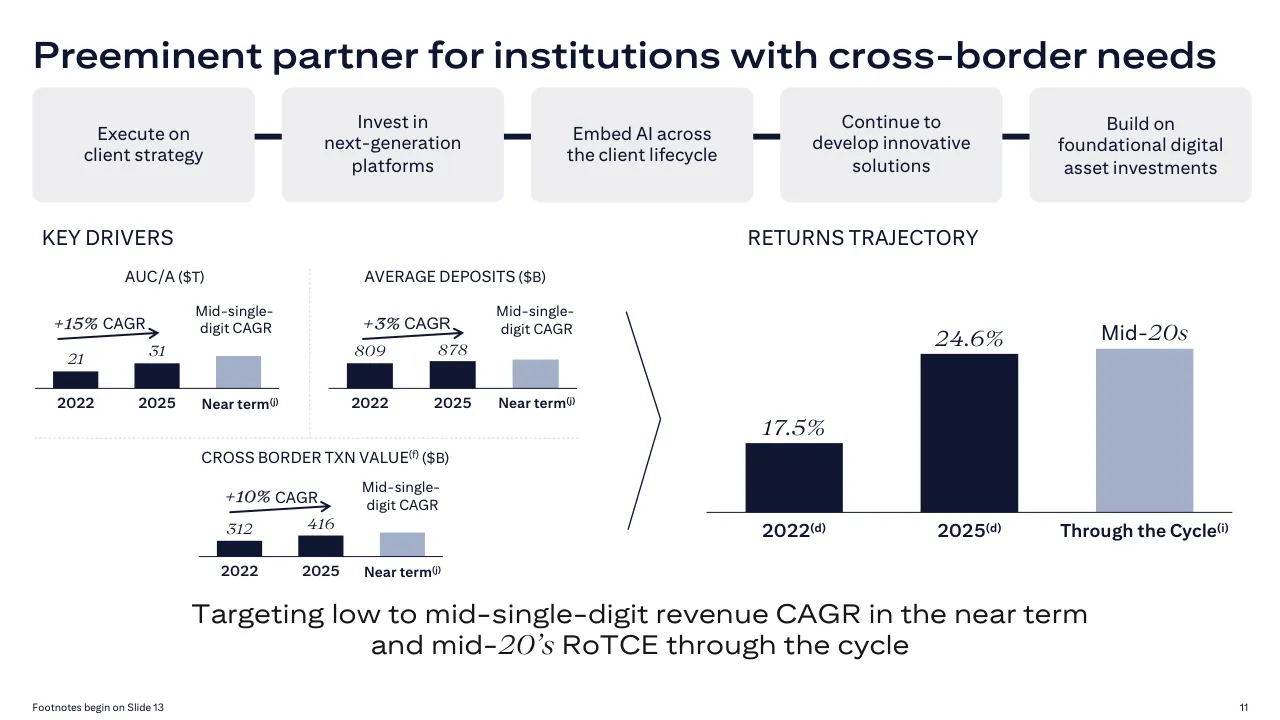
The deck opens with a title slide for Shahmir Khaliq, Head of Services, and a Services overview covering Investor Services, Treasury and Trade Solutions and Liquidity Management, with headline network and scale figures. It then shows performance against targets through market share and financial charts, followed by a page on how Services stays resilient through rate cycles, supported by client relationships and fee drivers. Next come industry trends and the strategy's key focus areas, a slide on growth by client segment and vertical, and sections on next-generation platforms, AI initiatives, innovative solutions and digital asset strategy. A slide sets out near-term and through-the-cycle return targets, a forward-looking statements disclaimer follows, and footnotes for each slide close the deck. Slides worth studying include slide 3, which pairs multi-year bar charts with market share callouts, slide 4, which links rate charts to fee and deposit drivers, slide 7, which uses large metric tiles for platform outcomes, and slide 11, which lays out returns trajectory against key drivers.
Slides worth studying
Questions about this deck
How many slides does the Citi '26 Investor Day deck have?
The Citi deck has 15 slides, and its footnotes begin on Slide 13. The footnotes for each slide close the deck.
What financial performance does Citi report for 2025 in its investor day deck?
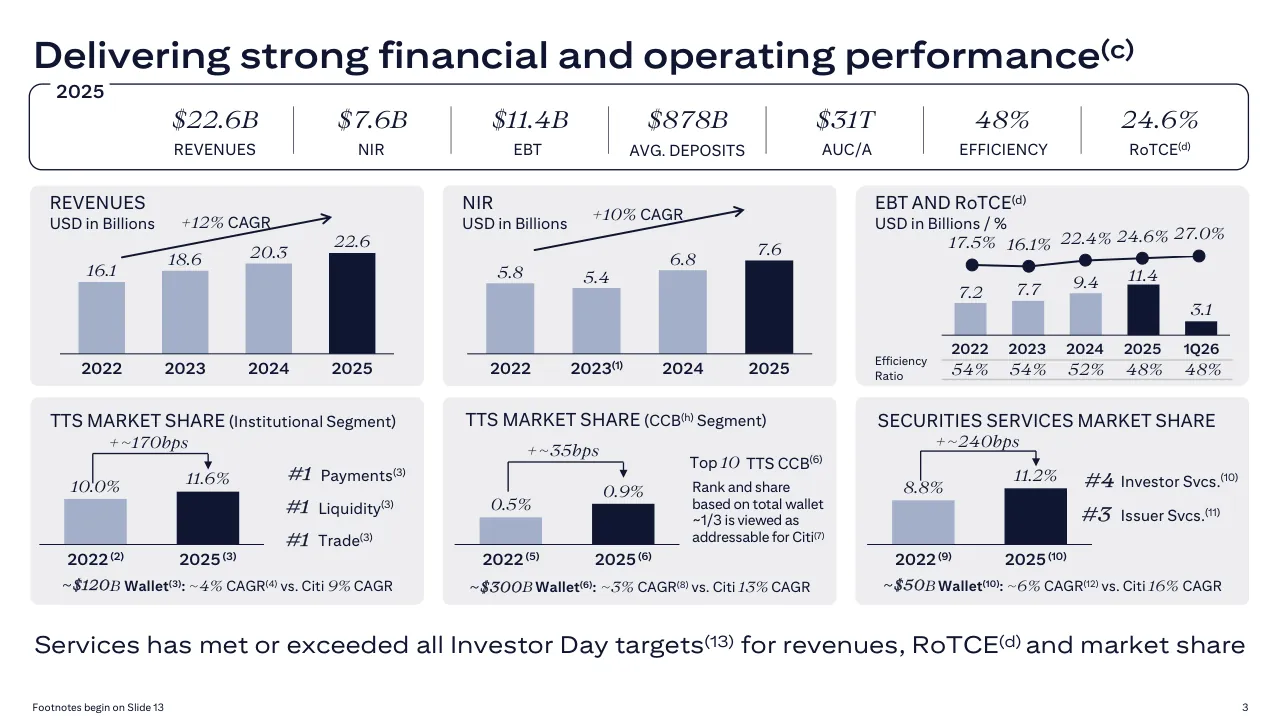
Slide 3 reports 2025 revenues of $22.6B, NIR of $7.6B, EBT of $11.4B, and RoTCE of 24.6%. The same slide also lists average deposits of $878B and an efficiency ratio of 48%.
What market share does Citi report for its Services business in its deck?
Slide 2 shows Services at #1 RANK with an 11.5% SHARE, citing Coalition Greenwich Global Competitor Benchmarking Analytics for FY25 in footnote 1. The slide describes this as Citi being the unmatched leader for institutions with cross-border needs.
What does Citi's deck say about its AI initiatives?
Slide 8 gives a target developer productivity gain of ~30-40% from developers using agentic AI tools. It also reports an 80% reduction in U.S. account opening deal document processing time from Intelligent Document Processing.
Details
Review score: 8 out of 10, Strong
Presentation quality, judged with the SlideDeck Co review heuristic. Ask, evidence and idea merit are not rated here.
The deck has a clear route: scale and position on slide 2, proof of results on slide 3, resilience on slide 4, then a strategy map on slide 5 that returns as numbered badges on slides 6 to 10 and pays off with the returns trajectory on slide 11. Slides 3, 4 and 7 are dense but well organised, with action titles, consistent navy and grey-blue bars that mark the latest year, bracketed change arrows, and a one-line takeaway at the foot of each page. The weaknesses are small type on the dense chart panels (slides 3 and 4 read as reference pages), unlabelled bars on slide 7 and the market share bars, and a plain text disclaimer and three pages of tiny footnotes at the end. It is disciplined and consistent but not a reference example.
Worth keeping: Keep the numbered strategy thread from slide 5 through slides 6 to 10, the navy highlight for the current year, the change arrows with CAGR callouts, and the closing takeaway line on each page.
Most useful repair: Raise the smallest type on slides 3, 4 and 7 and add values to the unlabelled bars on slide 7 and slide 11's driver mini-charts so the outcomes can be read without a spoken explanation.
What would change the score: Split slide 3 or trim its six chart panels so fewer numbers compete, and give slide 2's tree diagram and slide 9's table a stronger focal point.
Confidence high. 15 of 15 pages inspected on contact sheets, 4 at readable size. Reviewed 2026-11-08. Model-assisted review (claude-sonnet-5-5).
Full text of the slides (15 slides)
Every slide's words and a description of its charts and images, so the deck can be searched and rebuilt. Also available as Markdown.
Slide 1
citi / ’26 / INVESTOR / DAY / Shahmir Khaliq / Head of Services
Visuals: One photograph: a head-and-shoulders portrait of a middle-aged man with short greying dark hair, a light blue striped shirt, a navy tie and a dark navy suit jacket. He faces the camera with a neutral, serious expression. The background is a soft, out-of-focus warm beige and orange with bokeh circles. Lighting is soft and even, frontal. The framing is a vertical portrait crop, cropped at the chest and shoulders, boxed with rounded corners of about 2.5% of slide width, not full-bleed. No overlay or tint. Logo: the Citi wordmark in blue #1E5BFF with a red arc above the letters, top-left. Lockup: a large italic serif apostrophe and numerals '26 in navy #0F1632, followed by INVESTOR DAY in navy uppercase sans-serif. Shapes: a solid navy #0F1632 rounded rectangle behind the name, and a navy thin-stroke rounded-corner outline rectangle below it for the role.
Slide 2
Unmatched leader for institutions with cross-border needs / Services / #1 RANK 11.5% SHARE(1) / PAYMENTS / Make cross-border and / domestic payments and / collect from customers / LIQUIDITY / MANAGEMENT / SERVICES / Optimize liquidity / management globally / TRADE AND / WORKING CAPITAL / SOLUTIONS / Finance trade activities / and manage working / capital needs / INVESTOR / SERVICES / Connect investors and / intermediaries to markets / around the world / ISSUER / SERVICES / Support the capital market / issuance and transaction / execution needs of / global institutions / TREASURY AND TRADE SOLUTIONS / SECURITIES SERVICES / Citi is on / the ground in / 90+ countries(a) / ~17K clients(2), / including ~80% of / Fortune 500(3) / ~$6T(4) payments / processed daily / TO 180+ / COUNTRIES(a, b) / ~$1T / Average / deposits(5) / $31T AUC/A(b) / 100+ COUNTRY / CUSTODY / NETWORK(a, b, 6) / ~75% / of revenues from / Services + Markets / + Banking clients(7) / Services is the heart of Citi’s global network / Footnotes begin on Slide 13 / 2
Visuals: Organisational diagram, no photographs or logos. A dark navy rounded rectangle labelled Services with the line '#1 RANK' and '11.5% SHARE(1)' sits at top centre (x 38.8%, y 13.0%, 22.5% by 11.3%). A navy elbow connector runs from its bottom edge at x 50% down to a horizontal bus at about y 27.6% spanning from about x 11.4% to x 88.6%, with vertical drops of about 3 to 4 percent of slide height into the top of each of the five cards. Five light-grey cards labelled PAYMENTS, LIQUIDITY MANAGEMENT SERVICES, TRADE AND WORKING CAPITAL SOLUTIONS, INVESTOR SERVICES and ISSUER SERVICES each carry a short navy rule beneath the heading. Beneath the first three cards a navy bracket spans them, labelled TREASURY AND TRADE SOLUTIONS; beneath the last two a second bracket is labelled SECURITIES SERVICES. Six pale blue-grey boxes below hold statistics: Citi is on the ground in 90+ countries; ~17K clients including ~80% of Fortune 500; ~$6T payments processed daily to 180+ countries; ~$1T average deposits; $31T AUC/A with 100+ country custody network; ~75% of revenues from Services + Markets + Banking clients. No values are estimated; all figures are printed.
Slide 3
Delivering strong financial and operating performance(c)
2025
$22.6B
$7.6B
$11.4B
$878B
$31T
48%
24.6%
REVENUES
NIR
EBT
AVG. DEPOSITS
AUC/A
EFFICIENCY
RoTCE(d)
REVENUES
USD in Billions
+12% CAGR
22.6
20.3
18.6
16.1
2022 / 2023 / 2024 / 2025
NIR
USD in Billions
+10% CAGR
7.6
6.8
5.4
5.8
2022 / 2023(1) / 2024 / 2025
EBT AND RoTCE(d)
USD in Billions / %
27.0%
24.6%
22.4%
17.5%
16.1%
11.4
9.4
7.7
7.2
3.1
2022 / 2023 / 2024 / 2025 / 1Q26
Efficiency Ratio
54% / 54% / 52% / 48% / 48%
TTS MARKET SHARE (Institutional Segment)
+~170bps
10.0%
11.6%
#1 Payments(3)
#1 Liquidity(3)
#1 Trade(3)
2022(2) / 2025(3)
~$120B Wallet(3): ~4% CAGR(4) vs. Citi 9% CAGR
TTS MARKET SHARE (CCB(h) Segment)
+~35bps
0.5%
0.9%
Top 10 TTS CCB(6)
Rank and share / based on total wallet / ~1/3 is viewed as / addressable for Citi(7)
2022(5) / 2025(6)
~$300B Wallet(6): ~3% CAGR(8) vs. Citi 13% CAGR
SECURITIES SERVICES MARKET SHARE
+~240bps
8.8%
11.2%
#4 Investor Svcs.(10)
#3 Issuer Svcs.(11)
2022(9) / 2025(10)
~$50B Wallet(10): ~6% CAGR(12) vs. Citi 16% CAGR
Services has met or exceeded all Investor Day targets(13) for revenues, RoTCE(d) and market share
Footnotes begin on Slide 13
3
Visuals: Top row, panel 1 (Revenues): vertical bar chart, title REVENUES, subtitle USD in Billions, columns for 2022 to 2025 with values 16.1, 18.6, 20.3 and 22.6 (USD billions); 2022 to 2024 bars light slate blue, 2025 bar navy; an arrow line above the bars labelled +12% CAGR running upward left to right; baseline axis, no y-axis scale shown; category labels 2022, 2023, 2024, 2025 below the baseline. Top row, panel 2 (NIR): vertical bar chart, title NIR, subtitle USD in Billions, columns 2022 to 2025 with values 5.8, 5.4, 6.8 and 7.6 (USD billions); 2022, 2023 and 2024 light slate blue, 2025 navy; arrow labelled +10% CAGR rising left to right; labels 2022, 2023(1), 2024, 2025. Top row, panel 3 (EBT AND RoTCE): combined chart with bars for EBT in USD billions, 2022 7.2, 2023 7.7, 2024 9.4, 2025 11.4 (navy), 1Q26 3.1 (navy); a navy line with dot markers for RoTCE in percent, 2022 17.5%, 2023 16.1%, 2024 22.4%, 2025 24.6%, 1Q26 27.0%; below, a table row labelled Efficiency Ratio with values 54%, 54%, 52%, 48%, 48% under the same year labels 2022, 2023, 2024, 2025, 1Q26. Bottom row, panel 4 (TTS MARKET SHARE Institutional Segment): two bars, 2022 10.0% (light slate blue) and 2025 11.6% (navy); bracket arrow above labelled +~170bps; three ranking lines to the right: #1 Payments(3), #1 Liquidity(3), #1 Trade(3). Bottom row, panel 5 (TTS MARKET SHARE CCB Segment): two bars, 2022 0.5% (light slate blue) and 2025 0.9% (navy); bracket arrow labelled +~35bps; text block to the right: Top 10 TTS CCB(6) and a paragraph about rank and share. Bottom row, panel 6 (SECURITIES SERVICES MARKET SHARE): two bars, 2022 8.8% (light slate blue) and 2025 11.2% (navy); bracket arrow labelled +~240bps; rankings #4 Investor Svcs.(10) and #3 Issuer Svcs.(11) to the right. No highlighted points beyond the navy 2025 bars and the line markers. No legend.
Slide 4
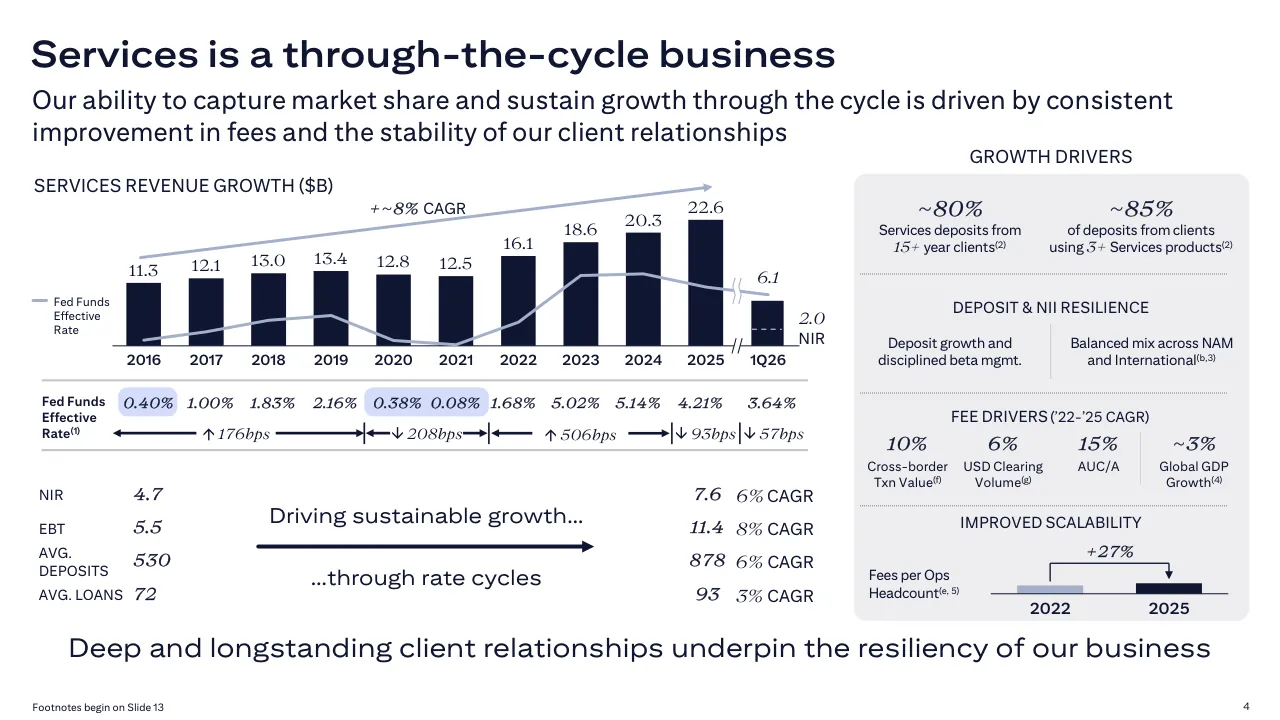
Services is a through-the-cycle business / Our ability to capture market share and sustain growth through the cycle is driven by consistent / improvement in fees and the stability of our client relationships / GROWTH DRIVERS / SERVICES REVENUE GROWTH ($B) / +~8% CAGR / 22.6 / 20.3 / 18.6 / 16.1 / 13.4 / 12.8 / 12.5 / 13.0 / 12.1 / 11.3 / 6.1 / 2.0 / NIR / 2016 / 2017 / 2018 / 2019 / 2020 / 2021 / 2022 / 2023 / 2024 / 2025 / 1Q26 / Fed Funds / Effective / Rate(1) / 0.40% 1.00% 1.83% 2.16% 0.38% 0.08% 1.68% 5.02% 5.14% 4.21% 3.64% / ↑176bps ↓208bps ↑506bps ↓93bps ↓57bps / NIR 4.7 / EBT 5.5 / AVG. DEPOSITS 530 / AVG. LOANS 72 / Driving sustainable growth… / …through rate cycles / 7.6 6% CAGR / 11.4 8% CAGR / 878 6% CAGR / 93 3% CAGR / ~80% / Services deposits from / 15+ year clients(2) / ~85% / of deposits from clients / using 3+ Services products(2) / DEPOSIT & NII RESILIENCE / Deposit growth and / disciplined beta mgmt. / Balanced mix across NAM / and International(b,3) / FEE DRIVERS (’22-’25 CAGR) / 10% / 6% / 15% / ~3% / Cross-border / Txn Value(f) / USD Clearing / Volume(g) / AUC/A / Global GDP / Growth(4) / IMPROVED SCALABILITY / Fees per Ops / Headcount(e, 5) / +27% / 2022 / 2025 / Deep and longstanding client relationships underpin the resiliency of our business / Footnotes begin on Slide 13 / 4
Visuals: Chart: vertical bar chart titled SERVICES REVENUE GROWTH ($B), with a Fed Funds Effective Rate line series and a 2.0 NIR marker. Bars and labelled values in order 2016 11.3, 2017 12.1, 2018 13.0, 2019 13.4, 2020 12.8, 2021 12.5, 2022 16.1, 2023 18.6, 2024 20.3, 2025 22.6, then 1Q26 6.1 (bar drawn after an axis break marked by two slanted strokes). No value axis or units scale is printed beyond the $B title; bars are unlabelled for range. A light blue-grey arrow above the bars runs from about 2016 upward to the right, labelled +~8% CAGR. The Fed Funds Effective Rate line is an unlabelled light blue-grey line (about 0.5 to 5 percent in the row below, values not drawn on the line); its legend sits at left as a short line segment with the text Fed Funds Effective Rate. The 1Q26 bar has a dashed light line inside it at the NIR 2.0 level. Highlight: the 2016 rate value 0.40% and the 2020 to 2021 values 0.38% and 0.08% are set on pale periwinkle rounded rectangles. Rate-change strip: a row of double-headed arrows between the rate values with labels ↑176bps, ↓208bps, ↑506bps, ↓93bps, ↓57bps, bracketed by vertical tick marks. Left table: rows NIR 4.7, EBT 5.5, AVG. DEPOSITS 530, AVG. LOANS 72. Right table: 7.6 at 6% CAGR, 11.4 at 8% CAGR, 878 at 6% CAGR, 93 at 3% CAGR. A navy horizontal arrow with a filled triangular head runs between the two tables, from about 20% to 46% of width at about 76% of height. Growth Drivers panel: contains only text figures and a small bar pair. Bar pair: two vertical bars labelled 2022 (light blue-grey, short) and 2025 (navy, taller, about 18% higher), with a bracket above labelled +27% and a downward arrow to the 2025 bar, all sitting on a thin baseline. No photographs, logos or icons.
Slide 5
Industry trends and our strategy / The industry faces disruption from innovative technology, creating a mix of risks and opportunities / INDUSTRY TRENDS / KEY FOCUS AREAS / 1 / Execute on client strategy / New technologies: AI and blockchain / Continued growth in digital commerce and / cross-border solutions / 2 / Next-generation platforms / Supply chain reconfiguration / AI initiatives / Ongoing expansion of ETF and private markets AUM / 3 / Innovative solutions / Digital Asset strategy / Demand for seamless client experience / Our clients require integrated 24/7, real-time solutions to navigate this landscape / 5
Visuals: Non-text elements: (1) A vertical dark navy brace line, drawn as a straight vertical bar at x about 49.5% spanning y 26% to 82.5%, with a right-pointing chevron in the middle (about y 50% to 58%, tip at x about 52%). Stroke colour #0F1632, stroke width about 0.3% of slide width, square joins. (2) Five light grey rounded rectangles (#EDEEEF) in the left column holding trend text. (3) Three dark navy rounded rectangles (#0F1632) in the right column, each with an italic serif numeral at left, numbered 1, 2 and 3. (4) Two light blue-grey rounded rectangles (#C4CDDC) under bars 2 and 3, labelled AI initiatives and Digital Asset strategy. (5) Two elbow connector lines, dark navy, about 0.3% stroke, running down from the bottom edge of bar 2 and bar 3 at x about 56.6% and turning right into the sub-bars at x about 59.6% with small filled triangle arrowheads. (6) A banner with a dark navy horizontal arrow pointing left at x 2.4% to 9% and a dark navy arrow pointing right at x 91% to 97.6%, both at y about 91%, with a white rectangle masking the arrow shaft behind the statement text. No photographs, logos or icons.
Slide 6
1
Execute on client strategy
DEEPEN WITH
INSTITUTIONAL CLIENTS
SUPERCHARGE STRATEGIC
CLIENT SEGMENTS
CAPTURE SHARE IN
HIGH-GROWTH VERTICALS
Large
Corporates
Public
Sector
Financial
Institutions
• Facilitate cross-border business including FX
• Sell the OneCiti platform
• ~90% of Fortune 500 revenues from clients in >10 countries(a, 1)
• ~98% of top 100 banks are clients(2)
SERVICES CLUSTER MIX(3) (Revenues)
SERVICES CLIENT MIX(4) (Revenues)
Asia South
JANA
NAM
FI
MEA
LATAM
UK
Europe
Corporate
Commercial
Bank clients
Asset
Managers
Asset
Owners
• Be the go-to bank for commercial clients with international financial services needs
• Targeted client selection
• Digital offerings to support tokenization and improved efficiency for Asset Managers and Owners
SERVICES CCB REVENUE GROWTH(h)
+12% CAGR
2022
2025
ASSET MANAGER & OWNER AUC/A
+14% CAGR
2022
2025
eCommerce
and Fintech
Technology
ETF
• Enable end-to-end digital commerce
• Innovation guided by client co-creation
• Modernized technology stack supporting speed, scale and availability
AVERAGE DAILY INSTANT PAYMENT TRANSACTIONS(5)
~250%
2022
2025
NAM ETF AUC/A GROWTH(6)
250%+
2022
2025
Footnotes begin on Slide 13
6
Visuals: Column 1 'DEEPEN WITH INSTITUTIONAL CLIENTS' has two charts. (a) Pie chart 'SERVICES CLUSTER MIX (Revenues)' with footnote marker (3): seven slices labelled NAM (pale blue-grey, about 15%), LATAM (#A3B0CB, about 12%), Europe (mid grey, about 14%), UK (black, about 8%), MEA (white with thin outline, about 14%), JANA (light grey, about 12%), Asia South (dark navy, about 12%); no values printed, so shares are estimates marked about; no legend, labels sit outside the slices. (b) Pie chart 'SERVICES CLIENT MIX (Revenues)' with footnote marker (4): two slices, Corporate (navy #0F1632, about 60%) and FI (#A3B0CB, about 40%); no values printed. Column 2 'SUPERCHARGE STRATEGIC CLIENT SEGMENTS' has two bar charts. (c) 'SERVICES CCB REVENUE GROWTH(h)': two navy-and-blue-grey columns, 2022 in #A3B0CB at about 40% of plot height and 2025 in #0F1632 at about 60%, with a dark navy trend arrow rising from left to right above them and the label '+12% CAGR'; baseline axis rule under the bars; no axis values printed. (d) 'ASSET MANAGER & OWNER AUC/A': 2022 bar #A3B0CB at about 35% height, 2025 bar #0F1632 at about 65%, trend arrow with label '+14% CAGR'. Column 3 'CAPTURE SHARE IN HIGH-GROWTH VERTICALS' has two charts. (e) 'AVERAGE DAILY INSTANT PAYMENT TRANSACTIONS(5)': 2022 bar #A3B0CB at about 50% of 2025 height, 2025 bar #0F1632; a thin navy bracket with arrowhead pointing down from 2022 to 2025 labelled '~250%'. (f) 'NAM ETF AUC/A GROWTH(6)': 2022 bar #A3B0CB at about 15% height, 2025 bar #0F1632 at about 60%; thin navy bracket with arrowhead labelled '250%+'. No logos, photographs or icons.
Slide 7
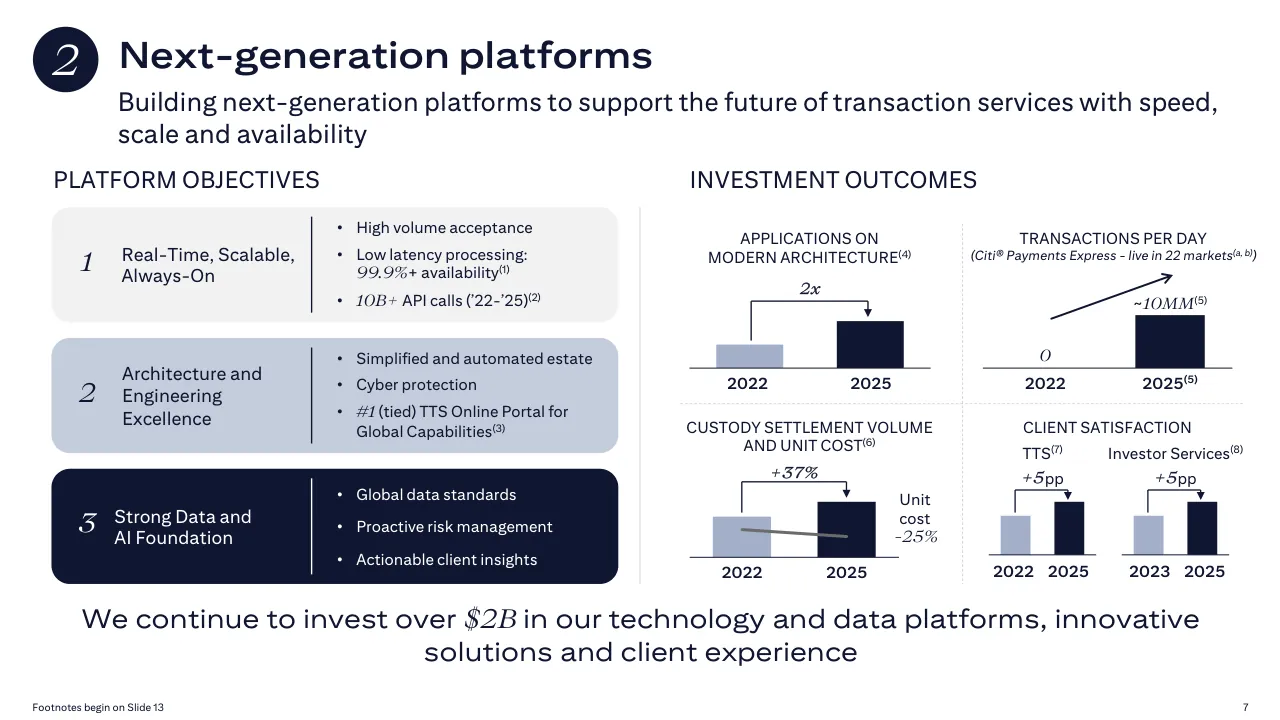
2 / Next-generation platforms / Building next-generation platforms to support the future of transaction services with speed, scale and availability / PLATFORM OBJECTIVES / INVESTMENT OUTCOMES / 1 / Real-Time, Scalable, Always-On / • High volume acceptance / • Low latency processing: 99.9%+ availability(1) / • 10B+ API calls ('22-'25)(2) / 2 / Architecture and Engineering Excellence / • Simplified and automated estate / • Cyber protection / • #1 (tied) TTS Online Portal for Global Capabilities(3) / 3 / Strong Data and AI Foundation / • Global data standards / • Proactive risk management / • Actionable client insights / APPLICATIONS ON MODERN ARCHITECTURE(4) / 2x / 2022 / 2025 / TRANSACTIONS PER DAY (Citi® Payments Express - live in 22 markets(a, b)) / 0 / ~10MM(5) / 2022 / 2025(5) / CUSTODY SETTLEMENT VOLUME AND UNIT COST(6) / +37% / Unit cost -25% / 2022 / 2025 / CLIENT SATISFACTION / TTS(7) / +5pp / Investor Services(8) / +5pp / 2022 2025 / 2023 2025 / We continue to invest over $2B in our technology and data platforms, innovative solutions and client experience / Footnotes begin on Slide 13 / 7
Visuals: Four small bar-chart panels in the right column, all in navy #0F1632 and light blue-grey #A3B1CB on a white field, with no gridlines and a horizontal baseline under each. (1) Applications on modern architecture: a 2022 bar about half the height of a 2025 bar; a bracket arrow above labelled 2x runs from the 2022 bar top to the 2025 bar top; x-axis labels 2022 and 2025; no value axis. (2) Transactions per day (Citi Payments Express, live in 22 markets): 2022 value shown as 0 with no bar; 2025 bar labelled ~10MM(5); a thin diagonal arrow rises from above the 2022 baseline to the upper right; x-axis labels 2022 and 2025(5). (3) Custody settlement volume and unit cost: 2022 bar in light blue-grey and 2025 bar in navy, the 2025 bar about 1.15 times the 2022 bar height (about); bracket arrow labelled +37%; a grey line segment crosses both bars sloping downward to the right; a side label reads Unit cost -25%; x-axis labels 2022 and 2025. (4) Client satisfaction: two mini charts, TTS(7) with 2022 light bar and 2025 navy bar, and Investor Services(8) with 2023 light bar and 2025 navy bar; each has a bracket arrow labelled +5pp; x-axis labels 2022 2025 and 2023 2025. No numeric value axes or legends. The three objective panels contain no graphics other than thin white vertical dividers.
Slide 8
2
AI initiatives
The Services AI strategy is focused on improving our clients’ operating platforms and empowering our teams to better serve their end-to-end needs
PLATFORM DESIGNED AROUND THE CLIENT RELATIONSHIP
ALIGNED TO THE FIRM’S PRIORITIES
SALES ASSIST
CLIENT ASSIST
OPS ASSIST
AGENT ASSIST
TECH ASSIST
Enable revenue growth
Personalize client experience
Drive Ops team effectiveness
Empower customer service agents
End-to-end AI support and orchestration
1 Business Strategy and Revenue Growth
2 Productivity and Process Transformation
3 Defensive Capabilities
4 Talent and Workforce Evolution
DEVELOPER PRODUCTIVITY
~30-40%
Target productivity gain from developers using agentic AI tools(1)
INTELLIGENT DOCUMENT PROCESSING
80%
Reduction in U.S. account opening deal document processing time(2)
AGENT ASSIST
~20-25%
Projected reduction in client servicing processing time annually(3)
CitiDirect® AI ASSISTANT
~50%
Improvement in containment rate(4)
Footnotes begin on Slide 13
8
Visuals: Five vertical rounded rectangles in graded fills, left to right: SALES ASSIST #D5DDE0, CLIENT ASSIST #C5CEDD, OPS ASSIST #A2B1CC, AGENT ASSIST #3D4560, TECH ASSIST #0F1632, each 8.7% wide and 40% tall, top at 30.6%, with white-to-navy text. A thin vertical light-grey hairline at x 51.2% runs from 30.6% to 71.3%. A solid navy circle at top left holds an italic serif numeral 2 in white. A numbered list of four priorities with italic serif numerals 1 to 4 and light grey horizontal dividers at about 40%, 50% and 60% height. Four white rounded outline boxes with navy strokes along the bottom, each with a title, a large italic serif figure and a description: DEVELOPER PRODUCTIVITY ~30-40%; INTELLIGENT DOCUMENT PROCESSING 80%; AGENT ASSIST ~20-25%; CitiDirect AI ASSISTANT ~50%. The box titles break the top stroke where they sit, masked by white fills. No photographs, charts, logos or icons.
Slide 9
3 / Innovative solutions / Our investments are focused on serving our clients’ evolving needs with best-in-class client experience / PAYMENTS / • 24/7 Clearing – now integrated with Citi® Token Services / • Cross-border and WorldLink® payments / 300+ / Banks live with 24/7 Clearing(b,1) / 135+ / Cross currency payment network(b) / LIQUIDITY / • Real-time liquidity management solutions / • Liquidity structures – facilitating $24T+ in sweeps annually / 80+ / Country liquidity pooling network(a,b) / ~50% / Of F500 clients using Citi liquidity structures(b,2) / TRADE / • Leading supply chain finance platform - ~440k buyer/supplier relationships(3) / • Global platform enables digital delivery connected to Investor/Funder / ~$1T / Throughput(4) / 27K / Buyer/Supplier relationships added YoY(5) / INVESTOR SERVICES / • Single event processing / • ETF platform / 95% reduction / In U.S. elective corporate action event notification time driven by SEP(6) / ~50% / NAM ETF AUC/A CAGR (’22-’25) / ISSUER SERVICES / • Digital issuance capabilities / • Leading provider of depositary receipts services / $1B / Digitally Native Note issuances(b) / 14 / Global Depositary Notes markets live(a,b) / Footnotes begin on Slide 13 / 9
Visuals: No photographs, charts or logos. Visual elements are a dark navy filled circle behind the section numeral 3, and five light grey rounded rectangles (one per row) holding the category labels and bullets, plus four thin horizontal divider lines between the rows. Metric figures are set in large italic serif numerals with small sans-serif captions beneath, and no chart or table is drawn.
Slide 10
3
Digital Asset strategy
We have been investing in the Digital Asset space for several years, building out production-
grade capabilities and a strong foundation for growth
SUPPORT CLIENT INNOVATION IN THE DIGITAL ASSET ECOSYSTEM
1
EXPAND CITI®
TOKEN SERVICES (CTS)
• Live in 5 markets(a) and
2 currencies(b)
• Externalize CTS capabilities to
public chains
• Developing Tokenized MMF(1)
purchase and
redemption capabilities
2
DRIVE
INTEROPERABILITY
• Act as bridge for fiat, stablecoins
and tokens
• Develop Blockchain Offerings (e.g.,
on-chain capabilities, transact
with tokenized deposits
and stablecoins)
3
EXPAND CUSTODY
AND TOKENIZATION
CAPABILITIES
• 24/7 payments a key enabler
• Bank-Grade Custody of crypto
assets and stablecoins
• Expand to tokenized securities and
real-world assets
4
PROVIDE SERVICES TO
VASP(2) CLIENTS
• Treasury Payments for VASP
clients like stablecoin issuers
• Operating Custody accounts
• On/Off ramps
Digital assets complement our existing capabilities and present an opportunity to grow
new revenue streams across the globe
Footnotes begin on Slide 13
10
Visuals: No photographs, charts or logos. Visual elements are: (1) a dark navy filled circle at top-left containing an italic serif numeral 3 in white; (2) four light grey rounded rectangle cards (#EDEEEF) of identical size, each about 22.8% of slide width and 47.1% of slide height, with generous corner radius and no outline or shadow; (3) four small dark navy rounded square badges (#0F1632) at each card's top-right corner containing white italic serif numerals 1, 2, 3 and 4; (4) two horizontal navy rules (#0F1632, about 0.2% of slide height thick) either side of the section header, running from about 3% to 20% and from about 80% to 97.5% of slide width. Card 1 has an additional #EDEEEF fill rectangle over its lower bullet area that is visually indistinguishable from the card.
Slide 11
Preeminent partner for institutions with cross-border needs / Execute on / client strategy / Invest in / next-generation / platforms / Embed AI across / the client lifecycle / Continue to / develop innovative / solutions / Build on / foundational digital / asset investments / KEY DRIVERS / RETURNS TRAJECTORY / AUC/A ($T) / +15% CAGR / Mid-single- / digit CAGR / 21 / 31 / 2022 / 2025 / Near term(j) / AVERAGE DEPOSITS ($B) / +3% CAGR / Mid-single- / digit CAGR / 809 / 878 / 2022 / 2025 / Near term(j) / CROSS BORDER TXN VALUE(f) ($B) / +10% CAGR / Mid-single- / digit CAGR / 312 / 416 / 2022 / 2025 / Near term(j) / 17.5% / 24.6% / Mid-20s / 2022(d) / 2025(d) / Through the Cycle(i) / Targeting low to mid-single-digit revenue CAGR in the near term / and mid-20’s RoTCE through the cycle / Footnotes begin on Slide 13 / 11
Visuals: Five-box process row: five light grey (#EDEEEF) rounded rectangles, each labelled, left to right: Execute on client strategy; Invest in next-generation platforms; Embed AI across the client lifecycle; Continue to develop innovative solutions; Build on foundational digital asset investments. A navy (#0F1632) horizontal line runs behind them, visible as short dark connectors between boxes. Chart 1 (KEY DRIVERS, top left) is a column chart titled AUC/A ($T); columns for 2022 = 21 and 2025 = 31 (navy #0F1632) and Near term shown as a light blue-grey (#A3B0CB) column with no printed value (about +15% CAGR arrow from 2022 to 2025 printed above, and label Mid-single-digit CAGR above the Near term column). The 2022 column is about 21 units high and the 2025 column about 31 units high, scaled to a common baseline; no axis values or ranges are printed. Chart 2 is a column chart titled AVERAGE DEPOSITS ($B): 2022 = 809 and 2025 = 878 in navy columns, Near term light blue-grey column with no value, +3% CAGR arrow, Mid-single-digit CAGR label. No axes or legend printed. Chart 3 is a column chart titled CROSS BORDER TXN VALUE(f) ($B): 2022 = 312 and 2025 = 416 navy columns, Near term light blue-grey column with no value, +10% CAGR arrow, Mid-single-digit CAGR label. Chart 4 (RETURNS TRAJECTORY, right) is a column chart with no axes or gridlines: 2022(d) column navy labelled 17.5%, about 9.6% of slide height tall; 2025(d) navy column labelled 24.6%, about 22% tall; Through the Cycle(i) light blue-grey column labelled Mid-20s (no numeric value), about 22.7% tall, all sitting on a thin navy baseline. Each sparkline arrow is a thin navy line with arrowhead rising slightly left to right. A thin navy chevron-shaped bracket (open to the left, angle pointing right) sits between the left charts and the returns chart, about 27% of slide height tall. Dashed grey vertical divider and horizontal dashed rule separate the three small charts. No photographs, logos or icons.
Slide 12
Investment capacity will come from driving out certain costs
as well as increased productivity, enabled by AI
Certain statements in this presentation are “forward-looking statements” within the meaning of the Private Securities
Litigation Reform Act of 1995, including statements made orally by Citi’s management. Such statements may be identified
by words such as believe, expect, anticipate, intend, estimate, may increase, may fluctuate, target, outlook, guidance and
illustrative, and similar expressions or future or conditional verbs such as will, should, would and could. These statements
are based on management's current expectations and are subject to uncertainty and changes in circumstances. These
statements are not guarantees of future results or occurrences. Actual results and capital and other financial condition
may differ materially from those included in these statements due to a variety of factors. These factors include, among
others: (i) macroeconomic, geopolitical and other challenges and uncertainties, including impacts related to the conflict in
the Middle East and resulting disruptions to energy and other commodities markets and supply chains; elevated inflation,
slowing economic growth and increases in unemployment rates; changes in U.S. laws or policies; and changes in interest
rates and monetary policies; (ii) the execution and efficacy of Citi’s initiatives to achieve its simplification, transformation
and enhanced firm and business performance priorities; and (iii) the precautionary statements included in this
presentation. These factors also consist of those contained in Citigroup's filings with the U.S. Securities and Exchange
Commission, including without limitation the “Risk Factors” section of Citigroup’s 2025 Form 10- K. Any forward-looking
statements made by or on behalf of Citigroup speak only as to the date they are made, and Citi does not undertake to
update forward-looking statements to reflect the impact of circumstances or events that arise after the date the forward-
looking statements were made.
12
Slide 13
Footnotes
Global
a. Represents both countries and jurisdictions.
b. As of December 31, 2025.
c. As previously disclosed, certain reporting changes were implemented in the first quarter of 2026. Prior period results for Citi's segments were recast to reflect these reporting changes, while Citi's consolidated results remained unchanged. For
additional information, please refer to Citi's Form 8-K furnished with the U.S. Securities and Exchange Commission on April 3, 2026.
d. Return on Tangible Common Equity (RoTCE) is a non-GAAP financial measure. RoTCE represents annualized net income available to common shareholders as a percentage of average TCE. For a reconciliation to reported results, please refer to
Citi’s Form 8-K furnished with the U.S. Securities and Exchange Commission on April 3, 2026 and the Citigroup Inc. Quarterly Financial Data Supplement for the quarter ended March 31, 2026, which is Exhibit 99.2 to Citigroup's Current Report
on Form 8-K furnished with the U.S. Securities and Exchange Commission on April 14, 2026.
e. Fee income is earned for assisting clients with transactional services and clearing. Revenue generated from these activities is recorded in Commissions and fees. Revenue is also generated from assets under custody and administration (AUC/A)
and is primarily recorded in Administration and other fiduciary fees.
f. Cross-border Transaction Value is defined as the total value of Cross-border FX Payments processed through Citi’s proprietary WorldLink and Cross-border Funds Transfer platforms, including payments from Consumer, Corporate, Financial
Institution and Public Sector clients.
g. U.S. Dollar Clearing Volume is defined as the number of USD Clearing Payment instructions processed by Citi on behalf of U.S. and foreign-domiciled entities (primarily Financial Institutions).
h. Represents portion of the Commercial Bank (CCB) revenue aligned with Services. CCB is defined as a sales coverage unit for Citi clients and is not an operating segment or reporting unit. The financial results for CCB are reflected across various
products within the Services, Markets, and Banking segments. The CCB client segmentation is principally determined by several factors, including product needs, client organizational complexity, origin of the client relationship, as well as size
(with CCB generally targeting companies with up to $3 billion in annual revenues). To ensure effective client service, these client segmentation criteria are periodically reviewed and updated, and the information presented reflects current criteria
across all comparative periods.
i. RoTCE through the cycle is a forward-looking non-GAAP financial measure. From time-to-time, management may discuss forward-looking non-GAAP financial measures, such as forward-looking estimates or targets for revenue, expenses, and
RoTCE. We are unable to provide a reconciliation of forward-looking non-GAAP financial measures to their most directly comparable GAAP financial measures because we are unable to provide, without unreasonable effort, a meaningful or
accurate calculation or estimation of amounts that would be necessary for the reconciliation due to the complexity and inherent difficulty in forecasting and quantifying future amounts or when they may occur. Such unavailable information could
be significant for future results. All through-the-cycle returns amounts are financial targets and subject to macro and market conditions.
j. Citi defines the near-term period as 2027-2028. Citi expects to be within the near-term RoTCE range for both 2027 and 2028. Near-term CAGR targets refer to the period from 2025-2028. Citi expects to reach near-term non-CAGR targets over
the near term. All near-term amounts are targets and subject to macro and market conditions.
13
Visuals: none. A placed raster image measuring 142 by 92 pixels sits at the bottom left corner (x 0.4%, y 94.9%, 3.6% by 4.1%), but it shows no visible content in the rendered slide.
Slide 14
Footnotes
Slide 2
1. Source: Coalition Greenwich Global Competitor Benchmarking Analytics for FY25. Results are based upon Citi’s internal product taxonomy, Citi’s internal revenues, and Large Corporate & FI Client Segment. Market share is calculated using Citi-internal revenues and Coalition Greenwich’s Industry Revenue Pools for Large Corporate & FI Client Segment. Peer Group in industry ranking includes BAC, BARC, BBH, BNPP, BNY, CACEIS, DB, HSBC, JPM, MUFG, NT, RBC, SCB, SG, STT, USB and WFC.
2. Services client count is based on Citigroup’s definition of active clients. Variance to client count disclosure at the 2024 Investor Day is driven by alignment to updated client definition, not a reduction in underlying clients.
3. Represents percentage of 2025 Global Fortune 500 served by Citi’s Services business. Sourced from Fortune.
4. Data reflects December 2025. Based on regulatory reporting guidelines prescribed by the Federal Reserve for U.S. Title 1 planning purposes; includes internal settlements, global payments to and through third-party processors and banks, and other internal transfers.
5. Represents $961B average Services deposits as of Q1 2026.
6. Global custody network includes third party agents and international central securities depositories.
7. Represents the percentage of total Services revenue from clients who are also Banking and Markets clients.
Slide 3
1. 2023 NIR impacted by ~$1.3B Translation losses from Argentine Peso (ARS) devaluation on Net Investment in Argentina.
2. Source: Coalition Greenwich Global Competitor Benchmarking Analytics for FY22. Results are based upon Citi’s internal product taxonomy, Citi’s internal revenues, and Large Corporate & FI Client Segment. Market share is calculated using Citi-internal revenues and Coalition Greenwich’s Industry Revenue Pools for Large Corporate & FI Client Segment. Peer Group in industry ranking includes BAC, BARC, BNPP, DB, HSBC, JPM, MUFG, SG, SCB, USB and WFC.
3. Source: Coalition Greenwich Global Competitor Benchmarking Analytics for FY25. Results are based upon Citi’s internal product taxonomy, Citi’s internal revenues, and Large Corporate & FI Client Segment. Market share is calculated using Citi-internal revenues and Coalition Greenwich’s Industry Revenue Pools for Large Corporate & FI Client Segment. Peer Group in industry ranking includes BAC, BARC, BNPP, DB, HSBC, JPM, MUFG, SG, SCB, USB and WFC.
4. Source: Coalition Greenwich Global Competitor Benchmarking Analytics for FY22 and FY25. Results are based upon Citi’s internal product taxonomy, Citi’s internal revenues, and Large Corporate & FI Client Segment.
5. Source: Coalition Greenwich Global Competitor Benchmarking Analytics for FY22. Results are based upon Citi’s internal product taxonomy and Citi’s internal revenues. Market share is calculated using Citi internal revenue and Coalition Greenwich’s Industry Revenue Pools for CCB Segment. For pools and peers, CCB includes revenues from all Corporates greater than $10MM and less than $3B.
6. Source: Coalition Greenwich Global Competitor Benchmarking Analytics for FY25. Results are based upon Citi’s internal product taxonomy and Citi’s internal revenues. Market share is calculated using Citi internal revenue and Coalition Greenwich’s Industry Revenue Pools for CCB Segment. For pools and peers, CCB includes revenues from all Corporates greater than $10MM and less than $3B.
7. Addressable CCB wallet is estimated to be ~$100B based on geographies and client segments we are focused on serving.
8. Source: Coalition Greenwich Global Competitor Benchmarking Analytics for FY22 and FY25. Results are based upon Citi’s internal product taxonomy and Citi’s internal revenues. For pools, CCB includes revenues from all Corporates greater than $10MM and less than $3B.
9. Source: Coalition Greenwich Global Competitor Benchmarking Analytics for FY22. Results are based upon Citi’s internal product taxonomy and Citi’s internal revenues. Market share is calculated using Citi-internal revenues and Coalition Greenwich’s Industry Revenue Pools. Peer Group in industry ranking includes BBH, BNPP, BNY, CACEIS, DB, HSBC, JPM, NT, RBC, SCB, SG, and STT.
10. Source: Coalition Greenwich Global Competitor Benchmarking Analytics for FY25. Results are based upon Citi’s internal product taxonomy and Citi’s internal revenues. Market share is calculated using Citi-internal revenues and Coalition Greenwich’s Industry Revenue Pools. Peer Group in industry ranking includes BBH, BNPP, BNY, CACEIS, DB, HSBC, JPM, NT, RBC, SCB, SG, and STT.
11. Source: Coalition Greenwich Global Competitor Benchmarking Analytics for FY25. Results are based upon Citi’s internal product taxonomy and Citi’s internal revenues. Market share is calculated using Citi-internal revenues and Coalition Greenwich’s Industry Revenue Pools. Peer Group in industry ranking includes BBH, BNPP, BNY, CACEIS, Computershare, DB, HSBC, JPM, NT, RBC, SCB, SG, STT, UMB Bank, USB, Wilmington Trust and WSFS.
12. Source: Coalition Greenwich Global Competitor Benchmarking Analytics for FY22 and FY25. Results are based upon Citi’s internal product taxonomy and Citi’s internal revenues.
13. Refers to Services targets established at ‘22 Investor Day and ’24 Services Investor Day.
Slide 4
1. Represents Federal Funds Effective Rate average annual values. Sourced from Federal Reserve Bank of St. Louis.
2. As of February 2026.
3. ~48% of total Services deposits are NAM as of FY25.
4. Average of 2022-2025 annual global GDP growth. Sourced from the World Bank: Global Economic Prospects - January 2026.
5. Operations headcount represents the aggregate count of all Full-Time Equivalent (FTE) personnel and indirectly managed workforce across the organization.
Slide 6
1. Based on 2025 global Fortune 500.
2. Top 100 banks based on assets, excluding Russian banks. Source S&P Global Market Intelligence.
3. Cluster mix based on FY25 Services revenue.
4. Client mix based on FY25 Services revenue by client segment.
5. Represents average daily instant payment transactions from 2022 to 2025, assuming 365 calendar days.
6. Represents assets under custody/administration growth from 2022 to 2025 in NAM Exchange Traded Funds.
14
Visuals: None apart from one small raster image (36 by 23 pixels) at the bottom left corner, about 3.6% of slide width and 4.1% of slide height; its content is not legible in the rendering and it appears to be a corner logo mark. No charts, tables, photographs or diagrams.
Slide 15
Footnotes
Slide 7
1. Represents Citi® Payments Express Instant Payment availability in December 2025, excluding Argentina.
2. API call is a request made by one software application to another through an Application Programming Interface (API).
3. Source: Crisil Coalition Greenwich 2025 Digital Transformation Benchmarking Program
4. Represents the increase in the number of production applications on modernized tech stack from 2022-2025. Modern architecture is defined as any application based on micro services that can be deployed on containers.
5. Data represents December 2025, where up to 10MM transactions were processed per day by Citi® Payments Express.
6. Custody unit cost represents the operational expense incurred to process and settle a single trade. It is determined by dividing the total US dollar cost of the operational staff dedicated to trade processing within a calendar month by the total number of trades processed and settled during that same month.
7. Source: Source: TTS Voice of the Client (VoC) annual survey programs in 2022 and 2025. Client satisfaction represents the sum of the percentages of respondents who rated “very satisfied” and “satisfied” on overall satisfaction with Citi TTS relationship. 2022 to 2025 growth is shown in percentage points.
8. Source: Investor Services Voice of the Client (VoC) Survey is administered by NMG Consulting on an annual basis. Client satisfaction represents the Overall Satisfaction with Citi by firms who responded with a Very Satisfied (5) or Satisfied (4) rating based on a scale of 1 to 5. 2023 to 2025 growth is shown in percentage points.
Slide 8
1. Target developer productivity is measured as the reduction in time it takes a developer to deliver a work effort with AI tools compared to their estimated delivery time.
2. Represents the reduction in deal document review processing time for U.S. resident account activities, since Intelligent Document Processing functionality was released in December 2025.
3. Represents the projected reduction in client servicing work effort time through the use of Agent Assist AI capabilities. Agent Assist was launched in March 2026.
4. In 2026 in the United States.
Slide 9
1. Source is Citi Payment Processor (CPP).
2. Liquidity structures include notional pooling, physical pooling, Citi Interest Optimization and Virtual Accounts.
3. Represents number of Buyer/Supplier relationships as of March 2026. Buyer/Supplier relationships are defined as unique combinations of buyer entities and seller entities in Citi Supplier Finance.
4. Reflects the total amount of FY25 trade flows through Citi’s systems.
5. Represents increase in Buyer/Supplier relationships from April 2025 to March 2026.
6. Represents the reduction in U.S. elective corporate action event notification time (measured in hours) post-migration to Single Event Processing (SEP) on Feb 28, 2026.
Slide 10
1. Tokenized money market fund. This is a prospective solution under evaluation.
2. Virtual Asset Service Provider.
15
Visuals: none. A small raster image of 18 by 12 pixels sits at bottom-left (x 0.4%, y 94.9%) and is not visibly rendered on the slide.
Download this deck
The hosted PDF of every library deck is free for readers of the SlideDeck Co newsletter. Join with your email and the viewer and download appear here.
Preparing a results presentation or business update of your own? The SlideDeck Co Standard Deck is a slide library for business reviews, updates and plans.







