
The deck opens with a title slide and an introduction of Rakesh Chopra, a Cisco Fellow, who is speaking at the Ethernet Alliance Technology Exploration Forum. It then surveys system architectures for fixed, centralized, and distributed switches, using simple block diagrams that show retimers, muxes, and optics. The middle sections track switch silicon bandwidth and SerDes speeds over twelve years and break down power consumption by component. A memorable line states that power is the main limit to what can be built and deployed. Later sections argue that co-packaged optics will become necessary as data rates and distances grow, and compare scale-out and scale-up designs using charts of server counts against switch radix and network layers. Further slides project radix and lane options for 800GE and 1.6TE generations and show how each system architecture would adopt 224G signaling. The deck closes with a summary of moral, business, and technology imperatives and a call to action to start 224G development now.
Slides worth studying
Questions about this deck
How many slides does the Cisco Systems Looking Beyond 400G deck have?
The deck has 19 pages. Its final slide, slide 19, gives on-demand content and contact details for the Ethernet Alliance.
What does the Cisco Systems deck say about power consumption by component?
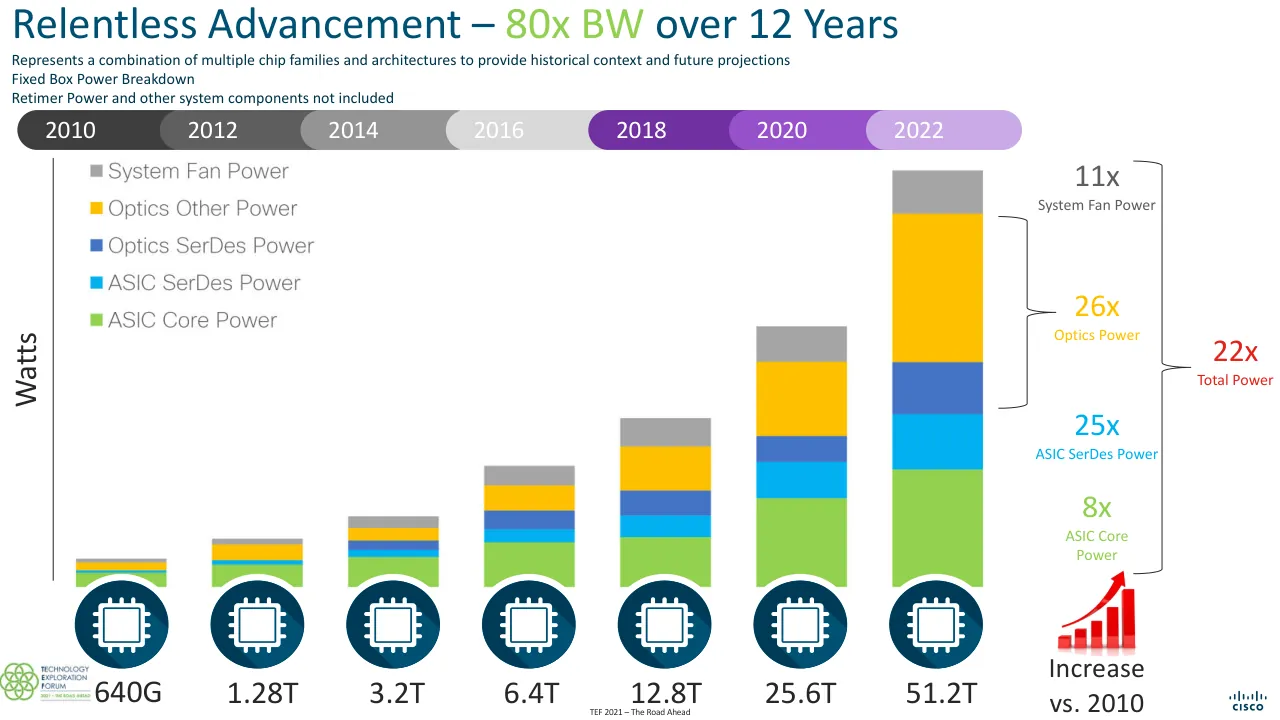
Slide 5 shows a fixed box power breakdown from 2010 to 2022, with increases versus 2010 of 11x for System Fan Power, 26x for Optics Power, 22x for Total Power, 25x for ASIC SerDes Power, and 8x for ASIC Core Power. Slide 7 repeats the 11x, 26x, 25x, and 8x figures alongside the title "Co-packaged Optics Is Inevitable."
What does the Cisco Systems deck say about co-packaged optics?
Slide 7 states that "Power savings drives requirement" and titles the section "Co-packaged Optics Is Inevitable." Slide 8 says that higher data rates and distance drive the move from copper to optics, and that future innovations will only be possible with silicon and optical integration.
How is the Cisco Systems deck structured?
The deck opens with a title slide and an introduction of Rakesh Chopra on slides 1 and 2, then covers system architectures on slide 3 and switch silicon bandwidth on slide 4. It closes with a call to action on slide 17 and a Cisco logo on slide 18.
Details
- Company: Cisco Systems
- Year: 2020
- Type: Conference talk
- Industry: Networking hardware
- Pages: 19
Review score: 6 out of 10, Needs substantial work
Presentation quality, judged with the SlideDeck Co review heuristic. Ask, evidence and idea merit are not rated here.
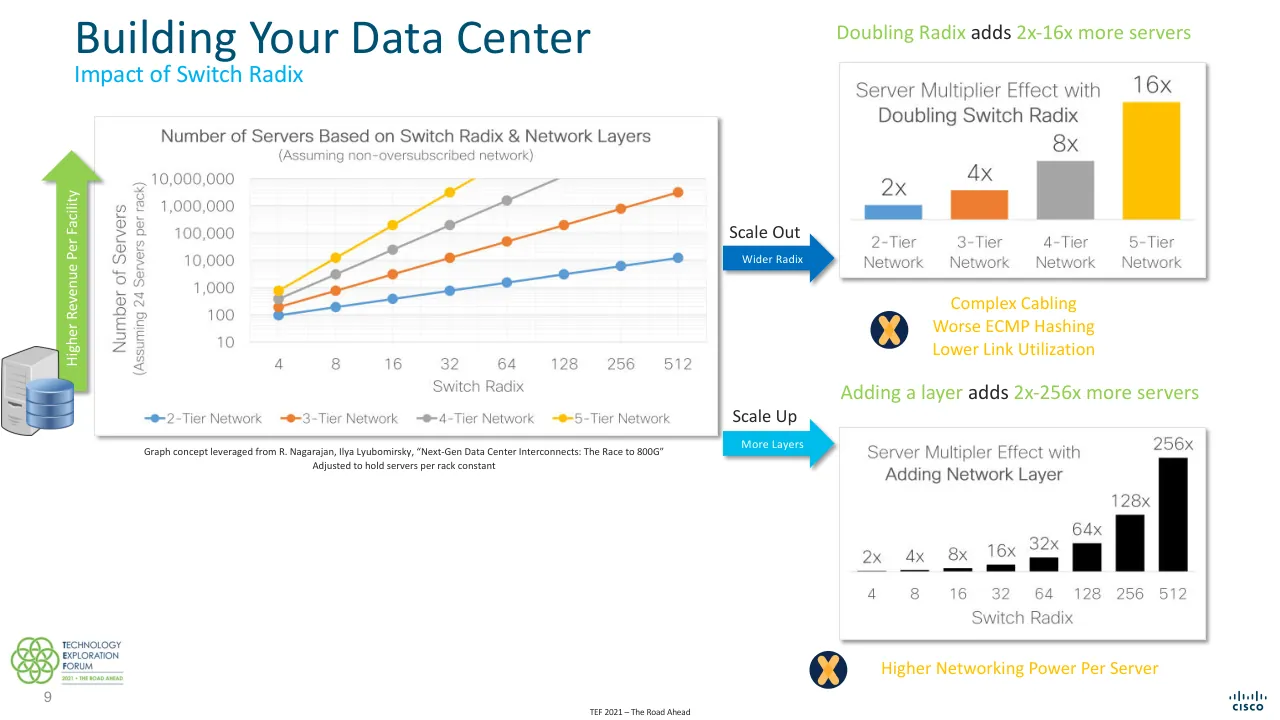
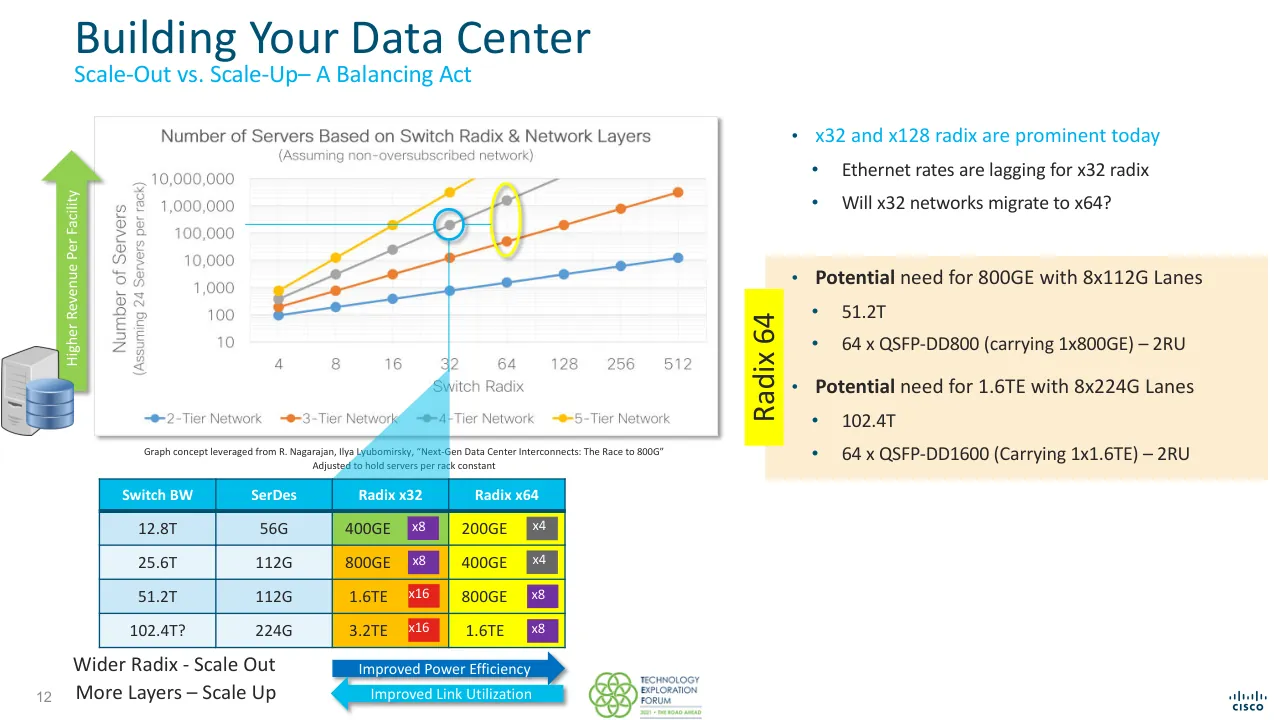
The deck has a clear technical route from architectures, to bandwidth and power growth, to co-packaged optics, to radix and 224G options, to a call to action, and slide 5 and slide 6 land the power message well. Execution is uneven: slides 10 to 13 repeat the same chart with small additions, slide 9 and slide 12 carry small chart text, a dense table and unexplained jargon, and slide 8 has text clipped at the left edge. The diagram slides 14 to 16 are tiny and cluttered, and slide 17 ends on a decorative graphic with small text, so the close is weaker than the middle. It is usable for a specialist live audience but needs substantial tightening.
Worth keeping: Keep the power-growth stacked bar on slide 5 with its multiplier callouts, the Apollo 13 power slide 6, and the consistent swim-lane layout across the architecture slides.
Most useful repair: Fix the clipped headline on slide 8, enlarge and declutter the diagrams on slides 3 and 14 to 16, and enlarge the table text and labels on slides 9 and 12.
What would change the score: Collapse the near-duplicate chart builds on slides 9 to 13 into fewer pages with one stated takeaway each, and rebuild the summary on slide 17 as a plainer, larger statement of the ask.
Confidence medium. 19 of 19 pages inspected on contact sheets, 4 at readable size. Reviewed 2026-11-08. Model-assisted review (claude-sonnet-5-5).
Full text of the slides (19 slides)
Every slide's words and a description of its charts and images, so the deck can be searched and rebuilt. Also available as Markdown.
Slide 1
KEYNOTE PRESENTATION
LOOKING BEYOND 400G -
A SYSTEM VENDOR PERSPECTIVE
Presenter: Rakesh Chopra, Cisco Systems
TECHNOLOGY
EXPLORATION
FORUM
ethernet alliance
www.ethernetalliance.org
Visuals: Photograph of a blurred data-centre rack: a row of server or switch modules with cable-filled blue light and green indicator LEDs in the background, a dark rack unit with a blue display and a connector in the foreground at the bottom. The photograph fills the whole slide, is not boxed, and is tinted blue with a dark vignette. A semi-transparent dark navy rectangle (#17375E at about 58% opacity) overlays the centre of the photo. A Technology Exploration Forum logo: green interlocking circles ring at left with the words TECHNOLOGY / EXPLORATION / FORUM in navy #1F4E79 sans-serif capitals, the first letter of each word emphasised, on a white rounded rectangle with a blue border. An Ethernet Alliance logo: a white-and-grey stylised 'ea' square mark above the word 'ethernet alliance' in white lowercase sans-serif. A thin green gradient bar (#6DB33F to #009A00) runs across the top edge.
Slide 2
Looking Beyond 400G
A System Vendor Perspective
Rakesh Chopra
Cisco Fellow
January 25, 2020
Many thanks to Cisco engineers, insightful customers, and amazing partners ...
www.linkedin.com/in/rakesh-chopra/
@Rakesh_Chopra1
Visuals: Four non-text elements. (1) Cisco logo: the stacked bar mark above the CISCO wordmark, solid dark teal #003C56, top-left at x 5.1%, y 7.6%, 8.7% by 8.2%. (2) Technology Exploration Forum logo: a 399 by 207 pixel image on a white rectangle at top-right, showing a cluster of six green interlocking rings on the left and the text TECHNOLOGY EXPLORATION FORUM in navy with 2021 THE ROAD AHEAD in green on the right with thin navy rules above and below the year line; not cropped, not tinted. (3) Email icon: glossy blue envelope icon, 64 by 64 pixels, at x 74.8%, y 85.2%, 2.2% by 3.9%. (4) LinkedIn icon: glossy blue rounded square with white 'in', 48 by 48 pixels, at x 74.8%, y 89.5%, 2.2% by 3.9%. (5) Twitter icon: glossy blue rounded square with white bird, 49 by 46 pixels, at x 74.8%, y 93.9%, 2.2% by 3.7%. No photographs and no charts.
Slide 3
System Architectures / Fixed* / Standalone Switch / Retimer / Port / Port / * - Can be interconnected to create a disaggregated chassis / Centralized / Standalone Switch / Optional Redundancy / Mux / Port / Mux / Port / Distributed / FE Switch / Retimer / LC Switch / Retimer / Port / Port / LR / VSR / 3 / TEF 2021 – The Road Ahead / CISCO
Visuals: Diagram with three rows. Row 1 (Fixed*): a photo of a fixed 1U switch; a blue chip labelled 'Standalone Switch' with two output lines, the upper line going to a dark navy chip labelled 'Retimer' and the lower line running directly to the second port; the Retimer output lines feed two dark charcoal rectangles labelled 'Port' (top and bottom); at far right a pale green board with a blue chip and a column of about 10 black connector tabs on its right edge. Footnote beneath: '* - Can be interconnected to create a disaggregated chassis'. Row 2 (Centralized): a photo of a modular chassis; a stack of two blue chips labelled 'Standalone Switch' (back chip lighter blue #1D9EFF offset up-left) with the caption 'Optional Redundancy' beneath; two black rectangular connector blocks lead to two bright blue chips labelled 'Mux' (upper and lower), each feeding a charcoal 'Port' rectangle; at far right two pale green line-card boards, one with a blue chip and small black tabs, the other with a light-blue chip and black tabs. Row 3 (Distributed): a photo of a tall multi-slot chassis; a large dark teal chip labelled 'FE Switch' with two output lines going to a navy 'Retimer' chip, then two black connector blocks, then a blue chip labelled 'LC Switch', whose output lines go to a navy 'Retimer' chip and then two charcoal 'Port' rectangles; at far right two pale green boards, the left one with two small dark teal chips, the right one with three blue chips and black tabs. Bottom: a yellow bar labelled 'LR' spanning most of the width and a smaller gold box labelled 'VSR'. Logos: TEF 2021 'Technology Exploration Forum, 2021 · The Road Ahead' logo bottom-left (green interlocking circles); Cisco wordmark bottom-right.
Slide 4
Relentless Advancement – Switch Silicon Bandwidth / Represents a combination of multiple chip families and architectures to provide historical context and future projections / 2010 / 2012 / 2014 / 2016 / 2018 / 2020 / 2022 / 202? / 102.4T? / 12 Years / 7 Switch Generations (80x) / 4 SerDes Speeds (10x) / 4 Switch Radix Increases (8x) / 51.2T / 25.6T / 12.8T / 6.4T / 3.2T / 640G / 1.28T / Switch Silicon BW / x64 / x128 x128 / x256 x256 x256 / x512 / # SerDes / 10G 10G / 28G 28G / 56G / 112G / SerDes Speed / Optics / QSFP+ / QSFP28 / QSFP-DD800 / QSFP-DD56 / QSFP-DD800 / TEF 2021 – The Road Ahead
Visuals: Diagram: a timeline bar and a staircase of eight chip icons. Each icon is a dark-teal circle with a white square microchip glyph (square die with pins on all four sides), drawn with a subtle darker drop shadow toward the lower right. Icons from left to right carry the labels 640G, 1.28T, 3.2T, 6.4T, 12.8T, 25.6T, 51.2T and 102.4T?. The last icon is highlighted with a bright yellow (#FFFF00) ring and a soft yellow glow. The timeline bar is a single rounded pill of segments from dark grey (#282828) at left through mid greys (#3E3E3E, #5E5E5E, #949494, #D9D9D9) to purple (#7030A0), violet and lilac, ending in pale pink (#F8D0CE) with year labels 2010, 2012, 2014, 2016, 2018, 2020, 2022 and 202? in white. Below the staircase, pills form a three-row matrix: row one '# SerDes' with pills x64 (light blue #61CFFF, left), x128 (blue-to-pink gradient), x256 (peach-to-olive gradient) and x512 (green-to-yellow-orange gradient); row two 'SerDes Speed' with pills 10G (#61CFFF), 28G (#F4A7A3), 56G (#92D050) and 112G (#FFC000); row three 'Optics' with pills QSFP+ (#61CFFF), QSFP28 (#F4A7A3), QSFP-DD56 (green) and QSFP-DD800 (#FFC000). Pills are rounded, fully rounded ends, roughly 4.4% of slide height tall. A black circle (#262626) with a white bold question mark sits at the right end of the bottom band. Logos: TEF (Technology Exploration Forum, 2021 + The Road Ahead) in green and dark-blue interlocking rings at bottom left; Cisco wordmark with bridge icon in dark blue at bottom right. Full-colour flat graphics, no photographs.
Slide 5
Relentless Advancement – 80x BW over 12 Years
Represents a combination of multiple chip families and architectures to provide historical context and future projections
Fixed Box Power Breakdown
Retimer Power and other system components not included
2010
2012
2014
2016
2018
2020
2022
System Fan Power
Optics Other Power
Optics SerDes Power
ASIC SerDes Power
ASIC Core Power
Watts
11x
System Fan Power
26x
Optics Power
22x
Total Power
25x
ASIC SerDes Power
8x
ASIC Core
Power
640G
1.28T
3.2T
6.4T
12.8T
25.6T
51.2T
51.2T
Increase
vs. 2010
TEF 2021 –The Road Ahead
5
Visuals: Stacked bar chart (placed raster image, 1350 by 725 px, at x 1.8 y 10.8 w 79.2 h 75.6 percent). Title in chart image: none; the chart's own legend is at upper left inside the image, listing System Fan Power (grey), Optics Other Power (yellow), Optics SerDes Power (blue), ASIC SerDes Power (light blue), ASIC Core Power (green), in that top-to-bottom order. Y axis labelled 'Watts' vertical at left, with a thin dark grey vertical axis line, no tick marks and no numeric scale. X categories left to right: 640G, 1.28T, 3.2T, 6.4T, 12.8T, 25.6T, 51.2T (labels printed below the chip icons). No values are printed on the bars; estimates: bar heights rise roughly in proportion to the printed multipliers, with the 51.2T bar about 3.2 times the 640G bar's total height. Series stacked bottom to top: ASIC Core Power green #92D050 (about 30 percent of 51.2T bar height), ASIC SerDes Power cyan #00B0F0 (about 15 percent), Optics SerDes Power blue #4472C4 (about 10 percent), Optics Other Power yellow #FFC000 (about 30 percent), System Fan Power grey #A5A5A5 (about 10 percent); all segments are flat with no outlines. Right-side multiplier annotations with brackets: 11x System Fan Power (grey), 26x Optics Power (yellow, bracket spanning the yellow and blue series), 25x ASIC SerDes Power (cyan), 8x ASIC Core Power (green), 22x Total Power (red, bracket spanning all series). Highlighted points: none. Chip icons: seven dark teal circles, one under each bar, each containing a white microchip glyph. Growth icon: red rising arrow over five red ascending bars with a light red base, placed bottom-right above 'Increase vs. 2010'. Logos: TEF (Technology Exploration Forum 2021 The Road Ahead) logo bottom-left in green and dark grey; Cisco logo bottom-right in dark teal.
Slide 6
Power is THE Problem to Solve / Limits what we can build / Limits what can be deployed / Limits what our planet can sustain / Apollo 13 – Universal Pictures / “Power is Everything”* / John Aaron- Apollo 13 Flight Controller / Adopt a power first design and deployment methodology / 6 / * - Thanks to Kraig Owen for the reference / TEF 2021 –The Road Ahead
Visuals: Photo: a still from the film Apollo 13 showing a young man in a light blue shirt and cream vest raising one arm to draw a curved line in white chalk on a dark chalkboard covered with chalk diagrams. On the right, an older man in a dark suit jacket stands with one hand on his chin, watching. Medium-wide framing, subject cut off at the bottom edge, soft and slightly low-resolution, dim cool lighting. Dominant colours: charcoal #2E3334, pale blue #A9C4DA, dark suit #1F1F24. Rectangular, boxed, no border or shadow, not full-bleed. Three icons: navy circles (#0B2A4F) each with a gold rounded X (#F4B63F), one beside each of the three Limits lines. Recycle logo: green (#7DC04B) recycling arrows around a light green globe outline, bottom right of the body. TEF logo: green and grey interlocking rings with the words TECHNOLOGY EXPLORATION FORUM and 2021 THE ROAD AHEAD in navy and green. Cisco logo: navy wordmark CISCO with bar-pattern mark above it, bottom right.
Slide 7
Co-packaged Optics Is Inevitable / Power savings drives requirement / 11x / System Fan Power / 26x / Optics Power / 25x / ASIC SerDes Power / 8x / ASIC Core Power / 51.2T / Increase vs. 2010 / Must minimize / SerDes power / SerDes power / increases with / distance / Trends plot from premier CMOS wireline 2018 conference / 1,000 / 100 / 10 / 1 / 0.1 / 0 / 20 / 40 / 60 / Channel Loss at Nyquist (dB) / Power Efficiency (mW/Gb/s) / Other / ISSCC 2018 / 10x/30 dB / FIGURE 15: Transceiver power efficiency versus channel loss. / Daly, Denis C., Laura C. Fujino, and Kenneth C. Smith. Through the Looking Glass-The 2018 Edition: Trends in Solid-State Circuits from the 65th ISSCC. IEEE Solid-State Circuits Magazine 10.1 (2018): 30-46. / Architectural Approach to / Power Optimization / Co-Package Optics / Switch Die / Optics / Switch Package / Optimal Power Efficiency / Chip to Nearby Optics / Switch Die / Optics / Switch Package / Chip to Module / Switch Die / Optics / Switch Package / No Retimers needed / Retimers maybe needed adding / additional power / Chip to Chip / Switch Die / Switch Package / Switch Die / Switch Package / Backplane or Passive Copper Cable / Switch Die / Switch Package / Switch Die / Switch Package / Increasing Distance, Insertion Loss / Improving Power Efficiency / TEF 2021 –The Road Ahead / cisco / 7
Visuals: 1) Stacked bar chart (left top), 232x439 px image, bar split into segments from top to bottom: grey (about 11x, System Fan Power), amber #FFC000 (26x, Optics Power, bracketed), blue #4472C4 (unlabelled segment), cyan #00B0F0 (25x, ASIC SerDes Power, bracketed), green #92D050 (8x, ASIC Core Power). Below the bar a dark navy circle icon with a chip glyph and the label 51.2T, and a red rising bar-chart icon labelled Increase vs. 2010. A thin black leader line runs from the 25x bracket to the statement Must minimize SerDes power. 2) Scatter plot (left lower), 477x481 px image, captioned Figure 15 from the 2018 ISSCC trends paper. X axis Channel Loss at Nyquist (dB) from 0 to 60 in steps of 20; Y axis Power Efficiency (mW/Gb/s) log scale 0.1, 1, 10, 100, 1,000. Blue diamonds labelled Other (about 60 points, mostly between 1 and 100 mW/Gb/s, channel loss about 0 to 52 dB). Orange squares labelled ISSCC 2018 (about 12 points, mostly 2 to 10 mW/Gb/s at about 8 to 40 dB). A black diagonal reference line labelled 10x/30 dB rising from about 0.3 at 13 dB to about 30 at 47 dB. Legend box top-right of plot area with white fill. Caption text above the chart in italic. Cropped to a light beige #EDE6DA background with black border-free edges. 3) Right architectural diagram, 1038x761 px image: vertical green arrow on left labelled Increasing Distance, Insertion Loss pointing down, vertical green arrow on right labelled Improving Power Efficiency pointing up. Five horizontal rows of rectangles on light green #E2EFD9 panels: Co-Package Optics (navy #1F3864 box Switch Die connected by short line to cyan #00B0F0 box Optics, label Switch Package, green check-mark icon with Optimal Power Efficiency); Chip to Nearby Optics (navy Switch Die with yellow #FFC000 arrows to cyan Optics, return arrow, Switch Package); Chip to Module (navy Switch Die with two amber arrows to a black vertical bar then cyan Optics); Chip to Chip (two navy Switch Die boxes in separate package panels joined by two amber arrows with a black bar between); Backplane or Passive Copper Cable (two navy Switch Die boxes at far ends joined by two amber lines passing two black bars). A small vertical double arrow between rows 2 and 3 in green and amber with a horizontal line, labelled No Retimers needed above and Retimers maybe needed adding additional power below. 4) Large cyan #00B0F0 right-pointing block arrow between the columns. 5) TEF logo, 243x102 px, green interlocking-ring emblem with wordmark TECHNOLOGY EXPLORATION FORUM in navy and 2021 - THE ROAD AHEAD in green. 6) Cisco wordmark bottom-right in dark grey, with bar glyph above.
Slide 8
Co-packaged Optics Is Inevitable / and viable in the 51.2T generation / Today / Higher data rates and distance drive the move from copper to optics / Future innovations will only / be possible with silicon and / optical integration / Si / Silicon / Op / Optics / 51.2T / Copper / Long Haul (1000km+) / Metro (80km) / Within Building (2km) / Within Big Floor (500m) / With Small Floor (100m) / Within Rack (2m-3m) / Within System (1m) / From Package (<1m) / Optics / Optics / Data Rate / TEF 2021 –The Road Ahead / 8
Visuals: Capsule range chart with no printed numeric values or axis ticks. Eight row bands run top to bottom: Long Haul (1000km+), Metro (80km), Within Building (2km), Within Big Floor (500m), With Small Floor (100m), Within Rack (2m-3m), Within System (1m), From Package (<1m). Alternate bands are light grey #BFBFBF at about 20% opacity; the top band sits on a faint grey strip. Nine vertical rounded capsules, each 3 percent wide, sit in columns from left to right at x about 54.8, 59.9, 65.1, 70.1, 75.1, 79.9, 84.7, 89.1 and 93.1 percent. The first column (labelled Copper, white vertical text) is light cyan #00BCEB and spans from the Long Haul band almost to the bottom of the Within Big Floor band, its lower end at about y 90%. Columns two to seven are light cyan #00BCEB in their lower sections and dark blue #0070C0 in their upper sections, with each column ending where its colour changes, so the blue upper section shows reach and the cyan lower section shows the copper-to-optics range. Columns eight and nine (labelled Optics, white vertical text) are dark blue #0070C0 and span almost the full height of the grid; the eighth column has a light cyan lower end near the bottom of the chart. A dotted black vertical line (about 1.5px dot pitch, #282828) runs from the Today tag down through the grid at about x 81.2%, from y 24.5% to y 90.5%, passing through the seventh column. The 'Data Rate' axis is a thin black horizontal arrow (#282828, about 0.1% stroke) from about x 55.2% to x 95.5% at y 95.8%, pointing right, with the label Data Rate centred above it. A Si + Op graphic sits in the left panel: a white rectangular frame (x 7.6%, y 63.9%, w 22.9%, h 12.8%) containing a green #92D050 square labelled Si with the word Silicon beneath it, a bold dark blue plus sign #0070C0 between, and a dark blue #0070C0 square labelled Op with the word Optics beneath. Below it, a white-ringed dark circular icon (#003C56 disc with #005073 shadow crescent) contains a white outlined microchip icon with pins on all four sides; a caption 51.2T sits beneath it. A small TEF logo (white box with green-and-blue interlocking circles, text TECHNOLOGY EXPLORATION FORUM and 2021 · THE ROAD AHEAD) sits bottom-left. A Cisco wordmark with the bars logo sits bottom-right in dark navy.
Slide 9
Building Your Data Center
Impact of Switch Radix
Doubling Radix adds 2x-16x more servers
Number of Servers Based on Switch Radix & Network Layers
(Assuming non-oversubscribed network)
10,000,000
1,000,000
100,000
10,000
1,000
100
10
Number of Servers
(Assuming 24 Servers per rack)
4 8 16 32 64 128 256 512
Switch Radix
2-Tier Network
3-Tier Network
4-Tier Network
5-Tier Network
Server Multiplier Effect with Doubling Switch Radix
2x 4x 8x 16x
2-Tier Network 3-Tier Network 4-Tier Network 5-Tier Network
Complex Cabling
Worse ECMP Hashing
Lower Link Utilization
Scale Out
Wider Radix
Adding a layer adds 2x-256x more servers
Server Multiplier Effect with Adding Network Layer
2x 4x 8x 16x 32x 64x 128x 256x
4 8 16 32 64 128 256 512
Switch Radix
Higher Networking Power Per Server
Scale Up
More Layers
Higher Revenue Per Facility
Graph concept leveraged from R. Nagarajan, Ilya Lyubomirsky, “Next-Gen Data Center Interconnects: The Race to 800G”
Adjusted to hold servers per rack constant
9
TEF 2021 – The Road Ahead
TECHNOLOGY EXPLORATION FORUM 2021 · THE ROAD AHEAD
Cisco
Visuals: Left: line chart titled “Number of Servers Based on Switch Radix & Network Layers”, subtitle “(Assuming non-oversubscribed network)”. Y axis is logarithmic, labelled “Number of Servers (Assuming 24 Servers per rack)”, range 10 to 10,000,000 with gridlines at 10, 100, 1,000, 10,000, 100,000, 1,000,000, 10,000,000. X axis is categorical, labelled “Switch Radix”, values 4, 8, 16, 32, 64, 128, 256, 512. Legend below the plot: 2-Tier Network (blue), 3-Tier Network (orange), 4-Tier Network (grey), 5-Tier Network (yellow). Series values are not printed, so estimates: 2-tier blue about 100, 200, 400, 800, 1,600, 3,200, 6,500, 13,000; 3-tier orange about 200, 800, 3,000, 12,000, 50,000, 200,000, 800,000, 3,000,000; 4-tier grey about 400, 3,000, 25,000, 200,000, 1,500,000 then runs off the top at radix 128; 5-tier yellow about 800, 12,000, 200,000, 3,000,000 then runs off the top at radix 64. Points are marked with filled circles and joined by straight lines. Top of the plot is clipped at 10,000,000. Right top: vertical bar chart with title “Server Multiplier Effect with Doubling Switch Radix”, no axes; bars labelled 2x (2-Tier Network, blue #5B9BD5), 4x (3-Tier Network, orange #ED7D31), 8x (4-Tier Network, grey #A5A5A5), 16x (5-Tier Network, yellow #FFC000); bars rise left to right with a shared baseline. Right bottom: vertical bar chart titled “Server Multiplier Effect with Adding Network Layer”, no axes, black bars labelled 2x, 4x, 8x, 16x, 32x, 64x, 128x, 256x above eight bars over switch radix 4, 8, 16, 32, 64, 128, 256, 512 respectively, bars rising left to right. Callouts are text only. Icons: two dark navy circles (#1F3864) with a yellow-orange crossed-X glyph, one beside Complex Cabling, one beside Higher Networking Power Per Server. Arrows: a blue (#0070C0) right-pointing block arrow labelled Scale Out / Wider Radix; a cyan (#00BCEB) right-pointing block arrow labelled Scale Up / More Layers. Left edge: a vertical green (#92D050) up-arrow labelled Higher Revenue Per Facility, sitting over a grey server tower and a stack of blue database cylinders. Logos: TEF logo bottom-left (green interlocking rings with dark text); Cisco wordmark bottom-right.
Slide 10
Building Your Data Center
Impact of Switch Radix
Doubling Radix adds 2x-16x more servers
Number of Servers Based on Switch Radix & Network Layers
(Assuming non-oversubscribed network)
10,000,000
1,000,000
100,000
10,000
1,000
100
10
Number of Servers
(Assuming 24 Servers per rack)
4
8
16
32
64
128
256
512
Switch Radix
2-Tier Network
3-Tier Network
4-Tier Network
5-Tier Network
Scale Out
Wider Radix
Higher Revenue Per Facility
Server Multiplier Effect with
Doubling Switch Radix
16x
8x
4x
2x
2-Tier Network
3-Tier Network
4-Tier Network
5-Tier Network
Power Efficiency
Adding a layer adds 2x-256x more servers
Scale Up
More Layers
Server Multipler Effect with
Adding Network Layer
256x
128x
64x
32x
16x
8x
4x
2x
4
8
16
32
64
128
256
512
Switch Radix
Link Efficiency
Graph concept leveraged from R. Nagarajan, Ilya Lyubomirsky, “Next-Gen Data Center Interconnects: The Race to 800G”
Adjusted to hold servers per rack constant
10
TEF 2021 – The Road Ahead
CISCO
Visuals: Left: a line chart titled 'Number of Servers Based on Switch Radix & Network Layers' with subtitle '(Assuming non-oversubscribed network)'. Y-axis 'Number of Servers (Assuming 24 Servers per rack)' logarithmic from 10 to 10,000,000 with gridlines at 10, 100, 1,000, 10,000, 100,000, 1,000,000, 10,000,000. X-axis 'Switch Radix' categories 4, 8, 16, 32, 64, 128, 256, 512. Series: 2-Tier Network (blue #5B9BD5) about 100, 200, 400, 800, 1,600, 3,200, 6,400, 12,000 at radix 4 to 512; 3-Tier Network (orange #ED7D31) about 200, 800, 3,000, 12,000, 50,000, 200,000, 900,000, 3,000,000; 4-Tier Network (grey #A5A5A5) about 400, 3,000, 25,000, 200,000, 1,500,000 at radix 4 to 64, rising off the top beyond 64; 5-Tier Network (yellow #FFC000) about 900, 12,000, 200,000, 3,000,000 at radix 4 to 32, rising off the top beyond 32. Legend along the bottom: 2-Tier Network, 3-Tier Network, 4-Tier Network, 5-Tier Network with matching markers. Attribution caption beneath the chart. Right top panel: bar chart titled 'Server Multiplier Effect with Doubling Switch Radix' with bars labelled 2x (blue #5B9BD5), 4x (orange #ED7D31), 8x (grey #A5A5A5), 16x (yellow #FFC000) over categories 2-Tier Network, 3-Tier Network, 4-Tier Network, 5-Tier Network. Right bottom panel: bar chart titled 'Server Multipler Effect with Adding Network Layer' with black bars labelled 2x, 4x, 8x, 16x, 32x, 64x, 128x, 256x, 512x-column bar labelled 256x, over Switch Radix categories 4, 8, 16, 32, 64, 128, 256, 512. Bars rise left to right, the first bars nearly flat. Green checkmark badges in dark navy circles accompany 'Power Efficiency' and 'Link Efficiency'. Left edge: a grey server tower icon with a blue database cylinder stack overlapping the bottom of a green upward arrow labelled 'Higher Revenue Per Facility'. Blue arrow labelled 'Wider Radix' (Scale Out) and light-blue arrow labelled 'More Layers' (Scale Up). Logos: TEF (Technology Exploration Forum) logo bottom-left in green; Cisco logo bottom-right in blue-black.
Slide 11
Building Your Data Center / Scale-Out vs. Scale-Up– A Balancing Act / Number of Servers Based on Switch Radix & Network Layers / (Assuming non-oversubscribed network) / 10,000,000 / 1,000,000 / 10,000 / 100,000 / 1,000 / 100 / 10 / Number of Servers (Assuming 24 Servers per rack) / 4 / 8 / 16 / 32 / 64 / 128 / 256 / 512 / Switch Radix / 2-Tier Network / 3-Tier Network / 4-Tier Network / 5-Tier Network / Higher Revenue Per Facility / Switch BW / SerDes / Radix x32 / 12.8T / 56G / 400GE / x8 / 25.6T / 112G / 800GE / x8 / 51.2T / 112G / 1.6TE / x16 / 102.4T? / 224G / 3.2TE / x16 / Graph concept leveraged from R. Nagarajan, Ilya Lyubomirsky, “Next-Gen Data Center Interconnects: The Race to 800G” / Adjusted to hold servers per rack constant / • x32 and x128 radix are prominent today / • Ethernet rates are lagging for x32 radix / • Will x32 networks migrate to x64? / 11 / TEF 2021 –The Road Ahead
Visuals: Chart (raster image of a line chart, not a native chart): line chart titled 'Number of Servers Based on Switch Radix & Network Layers', subtitle '(Assuming non-oversubscribed network)'. Y-axis: 'Number of Servers (Assuming 24 Servers per rack)', logarithmic, labelled 10, 100, 1,000, 10,000, 100,000, 1,000,000, 10,000,000. X-axis: 'Switch Radix', categories 4, 8, 16, 32, 64, 128, 256, 512 (evenly spaced). No values are printed; estimated values: 2-Tier Network (blue) about 100, 200, 400, 800, 1,600, 3,200, 6,400, 12,800; 3-Tier Network (orange) about 200, 800, 3,000, 13,000, 50,000, 200,000, 800,000, 3,000,000; 4-Tier Network (grey) about 400, 3,500, 25,000, 200,000, 1,500,000 (at 64, off-scale beyond 64 in the chart); 5-Tier Network (yellow) about 1,000, 12,000, 200,000, 3,000,000 at radix 4, 8, 16, 32, with the line leaving the plot top beyond 32. Legend along the bottom: 2-Tier Network blue, 3-Tier Network orange, 4-Tier Network light blue, 5-Tier Network yellow, each with a dot-and-line marker. Highlighted point: a blue ring (about 3.4% wide) circles the grey 4-Tier point at radix 32 (about 200,000); thin light-blue guide lines run horizontally to the y-axis at that value and vertically down to the x-axis at radix 32. A translucent light-blue wedge (#00BCEB at about 50% opacity) runs from the ring down to the table's top-right area. Table: 3 columns and 5 rows (one header). Header cells 'Switch BW', 'SerDes', 'Radix x32' in white bold Calibri on #00BCEB. Rows: 12.8T | 56G | 400GE with purple x8 badge; 25.6T | 112G | 800GE with purple x8 badge; 51.2T | 112G | 1.6TE with red x16 badge; 102.4T? | 224G | 3.2TE with red x16 badge. Column 3 cells are filled green #92D050 (row 1) and amber #FFC000 (rows 2 to 4). Left-hand icon: a grey server tower with a stack of three blue database cylinders, tilted slightly, placed at the base of the green arrow. Green up-pointing arrow on the left edge with the rotated white label 'Higher Revenue Per Facility'. Logos: TEF (Technology Exploration Forum) green-circle emblem with wordmark and '2021 • THE ROAD AHEAD' tagline, bottom-centre; Cisco logo (bridge-of-bars mark over CISCO wordmark), bottom-right.
Slide 12
Building Your Data Center
Scale-Out vs. Scale-Up– A Balancing Act
Number of Servers Based on Switch Radix & Network Layers
(Assuming non-oversubscribed network)
Number of Servers
(Assuming 24 Servers per rack)
10,000,000
1,000,000
100,000
10,000
1,000
100
10
4 8 16 32 64 128 256 512
Switch Radix
2-Tier Network 3-Tier Network 4-Tier Network 5-Tier Network
Graph concept leveraged from R. Nagarajan, Ilya Lyubomirsky, “Next-Gen Data Center Interconnects: The Race to 800G”
Adjusted to hold servers per rack constant
Switch BW / SerDes / Radix x32 / Radix x64
12.8T / 56G / 400GE x8 / 200GE x4
25.6T / 112G / 800GE x8 / 400GE x4
51.2T / 112G / 1.6TE x16 / 800GE x8
102.4T? / 224G / 3.2TE x16 / 1.6TE x8
Higher Revenue Per Facility
x32 and x128 radix are prominent today
Ethernet rates are lagging for x32 radix
Will x32 networks migrate to x64?
Radix 64
Potential need for 800GE with 8x112G Lanes
51.2T
64 x QSFP-DD800 (carrying 1x800GE) – 2RU
Potential need for 1.6TE with 8x224G Lanes
102.4T
64 x QSFP-DD1600 (Carrying 1x1.6TE) – 2RU
Wider Radix - Scale Out
More Layers – Scale Up
Improved Power Efficiency
Improved Link Utilization
TECHNOLOGY EXPLORATION FORUM 2021 · THE ROAD AHEAD
TEF 2021 –The Road Ahead
12
Visuals: 1) Line chart titled Number of Servers Based on Switch Radix & Network Layers, subtitle (Assuming non-oversubscribed network). Y axis: logarithmic, Number of Servers (Assuming 24 Servers per rack), range 10 to 10,000,000 with ticks at 10, 100, 1,000, 10,000, 100,000, 1,000,000, 10,000,000. X axis: Switch Radix, categorical ticks 4, 8, 16, 32, 64, 128, 256, 512. Four series with markers, no printed data labels; values are estimates. 2-Tier Network (blue): about 100 at 4, 200 at 8, 400 at 16, 800 at 32, 1,600 at 64, 3,200 at 128, 6,400 at 256, 12,800 at 512. 3-Tier Network (orange): about 200 at 4, 800 at 8, 3,000 at 16, 12,000 at 32, 50,000 at 64, 200,000 at 128, 1,000,000 at 256, 3,000,000 at 512. 4-Tier Network (grey): about 400 at 4, 3,000 at 8, 25,000 at 16, 200,000 at 32, 1,000,000 at 64; the line runs off the top of the plot after 64. 5-Tier Network (yellow): about 800 at 4, 12,000 at 8, 200,000 at 16, 3,000,000 at 32; the line runs off the top after 32. Legend along the bottom with line-and-dot keys in blue, orange, grey and yellow. Highlights: a blue circle around the grey 4-Tier point at radix 32 (about 200,000), with thin blue horizontal and vertical guide lines crossing at that point; a yellow ellipse around the grey point and the orange point at radix 64. 2) Table with 4 columns (Switch BW, SerDes, Radix x32, Radix x64) and 4 data rows, values as in text. The Radix x32 and Radix x64 cells carry coloured badges: purple x8, dark grey x4, red x16. 3) Green up arrow labelled Higher Revenue Per Facility. 4) Small grey server tower with blue database cylinders illustration at the left edge. 5) Light blue translucent triangular beam from the chart's radix-32 point down to the table. 6) Two arrow bars: dark blue arrow pointing right labelled Improved Power Efficiency, light blue arrow pointing left labelled Improved Link Utilization. 7) TEF logo, a green ring-of-circles mark with wordmark. 8) Cisco logo bottom right in dark blue. 9) Peach callout box with a yellow vertical bar labelled Radix 64.
Slide 13
Building Your Data Center / Scale-Out vs. Scale-Up– A Balancing Act / x32 and x128 radix are prominent today / Ethernet rates are lagging for x32 radix / Will x32 networks migrate to x64? / Radix 64 / Potential need for 800GE with 8x112G Lanes / 51.2T / 64 x QSFP-DD800 (carrying 1x800GE) – 2RU / Potential need for 1.6TE with 8x224G Lanes / 102.4T / 64 x QSFP-DD1600 (Carrying 1x1.6TE) – 2RU / Higher Revenue Per Facility / Switch BW / SerDes / Radix x32 / Radix x64 / Radix x128 / 12.8T / 56G / 400GE / x8 / 200GE / x4 / 100GE / x2 / 25.6T / 112G / 800GE / x8 / 400GE / x4 / 200GE / x2 / 51.2T / 112G / 1.6TE / x16 / 800GE / x8 / 400GE / x4 / 102.4T? / 224G / 3.2TE / x16 / 1.6TE / x8 / 800GE / x4 / Graph concept leveraged from R. Nagarajan, Ilya Lyubomirsky, “Next-Gen Data Center Interconnects: The Race to 800G” / Adjusted to hold servers per rack constant / Wider Radix - Scale Out / More Layers – Scale Up / Improved Power Efficiency / Improved Link Utilization / Radix 128 / Clear need for 800GE with 4x224G Lanes / 102.4T with 128-Radix / or / 128 x QSFP-800 (carrying 1x800GE) – 4RU / 64 x QSFP-DD1600 (carrying 2x800GE)-2RU / 13 / TEF 2021 – The Road Ahead
Visuals: Line chart titled Number of Servers Based on Switch Radix & Network Layers, subtitle (Assuming non-oversubscribed network). Y axis Number of Servers (Assuming 24 Servers per rack), logarithmic from 10 to 10,000,000 with gridlines at 10, 100, 1,000, 10,000, 100,000, 1,000,000, 10,000,000. X axis Switch Radix, categories 4, 8, 16, 32, 64, 128, 256, 512. Four series: 2-Tier Network (blue) about 100 at radix 4, about 200 at 8, about 500 at 16, about 900 at 32, about 1,800 at 64, about 3,300 at 128, about 7,000 at 256, about 14,000 at 512; 3-Tier Network (orange) about 200 at radix 4, about 800 at 8, about 3,000 at 16, about 12,000 at 32, about 60,000 at 64, about 200,000 at 128, about 1,000,000 at 256, about 3,000,000 at 512; 4-Tier Network (grey) about 400 at radix 4, about 3,000 at 8, about 25,000 at 16, about 200,000 at 32, about 1,000,000 at 64, beyond the top of the plot above 512; 5-Tier Network (yellow) about 1,000 at radix 4, about 12,000 at 8, about 200,000 at 16, about 3,000,000 at 32, off the top of the plot from radix 64. Legend below the x axis: 2-Tier Network, 3-Tier Network, 4-Tier Network, 5-Tier Network. Highlights: blue circles at the 4-Tier point at radix 32 and the 3-Tier point at radix 128; a yellow oval around the grey and orange points at radix 64; a thin cyan horizontal line at about 200,000 extending from the left axis to radix 128, and thin cyan vertical lines down from radix 32 and radix 128 to the table. Table: 5 columns Switch BW, SerDes, Radix x32, Radix x64, Radix x128; 4 data rows as listed in text, with port-count badges (x8, x4, x2, x16) in the Radix columns. Two bordered arrows below the table: a dark blue right arrow Improved Power Efficiency and a cyan left arrow Improved Link Utilization. Panels on the right contain bullet text, not graphics. Logos: Technology Exploration Forum (TEF) logo bottom left, a multi-circle green and grey emblem with small text; Cisco wordmark with bars bottom right. Icons: a grey server tower with a blue database cylinder stack at left.
Slide 14
224G Generation Traditional System Architectures / Viable with Traditional System Designs / VSR - Optimize for Optics / 112G last major passive copper generation è Active Copper / 8x224G VSR - No Re-timers / Fixed / Standalone Switch / Retimer / 2x800GE 1x1.6TE / 2x800GE 1x1.6TE / AEC / Optics / Optics / Optics / Centralized / 224G MR-LR Required / Standalone Switch / Mux / Mux / 2x800GE 1x1.6TE / 2x800GE 1x1.6TE / Optional Redundancy / 224G LR Required / Distributed / FE Switch / Retimer / LC Switch / Retimer / 2x800GE 1x1.6TE / 2x800GE 1x1.6TE / Optics / Optics / Optics / 14 / TEF 2021 –The Road Ahead
Visuals: Diagram with three horizontal rows, each row a sequence of blocks joined by thin light-blue (#00B0F0) horizontal lines and small ring-shaped port circles. Fixed row: a large blue (#0070C0) square chip-shaped block labelled 'Standalone / Switch' at x 41.1%, y 16.5%, w 11%, h 18.3%, with 4 pin stubs per side; its upper port (purple ring, #7030A0) connects by a purple angled leader line up to the VSR label; its lower port connects by a line to a second ring. A dark navy (#002060) block labelled 'Retimer' at x 58.1%, y 16.3% with an X drawn in gold (#FFC000) over the word; its output ring connects to a black (#282828) box '2x800GE / 1x1.6TE' at x 71.2%, y 19.1%, and a gold ring with a gold leader line labelled '8x224G VSR - No Re-timers' points to that box. A second black box '2x800GE / 1x1.6TE' at x 71.2%, y 26.9%, linked from the lower ring. A third black box 'AEC' at x 71.2%, y 32.9% with a gold ring. At far right, a pale green (#E2F2DB) rack card at x 90.9%, y 15.8%, w 5.8%, h 19.2%, containing one blue chip and a column of dark pin stubs. Centralized row: a blue (#1D9EFF over #0070C0) chip block 'Standalone / Switch' at x 41.2%, y 41.5% with a stacked duplicate behind it, green rings (#519234) feeding two light-blue (#00B0F0) blocks 'Mux' at x 58.1%, y 39.2% and y 50.9%, each with purple output rings linking to black boxes '2x800GE / 1x1.6TE' at x 71.2%, y 44.1% and y 51.9%. A green leader line from the label '224G MR-LR Required' points to the upper green ring. Two black rectangles (#282828) sit between the switch and the Mux blocks as connector modules. Two green rack cards at x 85–92% with blue and light-blue chips. Distributed row: a dark teal (#00344B) block 'FE / Switch' at x 11.2%, y 67.7%, w 11%, h 18.3%; a dark red-outlined ring (#7B1A14) leader from label '224G LR Required' points to its upper port; its upper port connects through a dark red ring to a navy (#002060) 'Retimer' block at x 28.1%, y 67.6%, then to a black connector module, then to a dark red ring to a blue 'LC Switch' block at x 41.2%, y 67.8%; the LC Switch outputs purple rings to a navy 'Retimer' block with gold X at x 58.2%, y 67.6%, which connects to a black box '2x800GE / 1x1.6TE' at x 71.3%, y 70.3%; a lower LC output runs straight to a second black box '2x800GE / 1x1.6TE' at x 71.3%, y 78.1%. Right side: two pale green rack cards with navy and blue chips and black stub columns. Photos: at top-left a grey, angled rack-mount 1RU network switch with ports on its front face, shown on white, boxed, sharp, unshaded; in the middle left a white-and-grey modular chassis with multiple line-card slots, boxed, neutral lighting; at lower left a tall grey and black modular chassis with dense vertical port rows, boxed, lit from the side. Overlays: none; the three bands carry a left-to-right colour fade.
Slide 15
224G Generation CPO System Architectures / Power Optimized ; Introduced first on Client-Side Optics / 224G/2x112G / Fixed / Optics / Standalone / Switch / Optics / Centralized / 224G MR-LR Required / Optics / Standalone / Switch / Mux / Optics / Mux / Optics / Distributed / 224G LR Required / FE / Switch / Retimer / LC / Switch / Optics / Optics / Optional Redundancy / 15 / TECHNOLOGY / EXPLORATION / FORUM / 2021 • THE ROAD AHEAD
Visuals: Technical architecture diagram in three horizontal rows, with blue, dark navy and black chip and box shapes, black optics modules, yellow, green and dark red connector circles and thin connecting lines, and small green-tinted board thumbnails at the right of each row. Row 1 (Fixed): a photo of a fixed-configuration switch at left; a large blue square chip labelled Standalone Switch with two black Optics blocks on its right side, each with a yellow-rimmed white circle port; a yellow leader line labelled 224G/2x112G points to the upper port; at the far right a pale green card containing a small blue chip with black pins. Row 2 (Centralized): a photo of a modular chassis switch at left; a bright blue chip labelled Standalone Switch with two green-rimmed circle ports on its right, each linking by a thin blue line through a black rectangle to a light-blue chip labelled Mux; a green leader line labelled 224G MR-LR Required points to the upper port; each Mux has a black Optics block with a yellow-rimmed port; the caption Optional Redundancy sits under the Standalone Switch; at right are two stacked pale green cards with small chips. Row 3 (Distributed): a photo of a tall modular chassis at left; a dark teal chip labelled FE Switch with two dark red-rimmed ports, one connected by a blue line to a dark navy chip labelled Retimer, then through a black rectangle to a blue chip labelled LC Switch with two Optics blocks, each with a yellow-rimmed port; a dark red leader line labelled 224G LR Required points to the upper FE port; at right are pale green stacked cards with dark and blue chips.
Slide 16
Future CPO Architectures
Eventually Optics replace high speed data interconnect
Fixed
Optics
Standalone
Switch
Optics
Centralized
Optics
Optics
Optics
X
Standalone
Switch
Mux
Optics
Optics
Optional Redundancy
Mux
Optics
Optics
Distributed
Optics
Optics
Optics
FE
Switch
Optics
Retimer
LC
Optics
Optics
Switch
Optics
Optics
16
TEF 2021 –The Road Ahead
Cisco logo (wordmark, no text)
Visuals: Diagram with three rows. Row 1 (Fixed): a photo of a fixed-configuration switch (dark grey rack-mount unit, angled, at left); a blue square chip labelled Standalone Switch with two black Optics boxes, each with a yellow-ringed circular port on its left edge, stacked at the right of the chip; at far right a green card with a small blue chip with black pins. Row 2 (Centralized): a photo of a modular chassis switch (grey, with cards visible); a light-blue-outlined blue chip labelled Standalone Switch with Optional Redundancy caption below, two Optics boxes with yellow ports; thin yellow fibre lines with paired small yellow loop symbols run horizontally to a short black bar (connector) and then to a second set of two Optics boxes feeding a pair of light blue chips labelled Mux (the top Mux and bottom Mux overlapping with the Optics boxes); at far right three stacked green cards with small blue and black pin chips. Row 3 (Distributed): a photo of a tall multi-slot chassis (grey, vertical); a dark navy chip labelled FE Switch with two Optics boxes and yellow ports; a faded grey-mauve chip labelled Retimer with an orange-yellow X; yellow fibre lines with paired loop symbols to a black connector bar; two Optics boxes feeding a blue chip labelled LC Switch with two Optics boxes at right; at far right stacked green cards with dark navy and blue chips. Composition is a left-to-right flow with fibre lines connecting the chips.
Slide 17
Call to Action / Power Driven Architecture / 3 Main System Architectures / Fixed, Centralized, Modular / BW Doubling every 2 Years / Not Slowing Down, Power Too High / Co-package Optics are Coming / 51.2T Generation / Must start on 224G … Yesterday / But let’s do it right / 800GE / 1.6TE Coming / 800GE vs 1.6TE is just timing / Importance is 224G development / Limits what our / Planet can / Sustain / Moral / Imperative / Business / Imperative / Technology / Imperative / Build / Limits what / we can / Deploy / Limits what / We can / Perfect Catalyst / to Innovate / 17 / TEF 2021 – The Road Ahead
Visuals: Diagram: a three-lobed overlapping circle graphic with a central round icon. Green circle (Moral Imperative, top) overlaps a grey circle (Business Imperative, lower left) and a cyan circle (Technology Imperative, lower right); a navy band wraps behind them. The green lobe is labelled 'Moral / Imperative' in white; the grey lobe 'Business / Imperative' in white; the cyan lobe 'Technology / Imperative' in white. Around the outside, curved green word 'Sustain' sits above the top lobe with 'Limits what our / Planet can' in small green text above it; grey rotated 'Build' sits at lower left with 'Limits what / we can' in small grey text below it; cyan rotated 'Deploy' sits at bottom with 'Limits what / We can' in small cyan text below it. A light grey (#E9E9E9) rounded pill extends to the right behind the words 'Perfect Catalyst / to Innovate'. The centre icon is a white-ringed navy circle containing green circular arrows around a white lightning bolt. Icons: five navy circular check-mark badges (navy #1F3F6E with green #6CBE45 tick) beside the five bullet items. Logos: the Technology Exploration Forum logo (green interlocking circles with 'TECHNOLOGY / EXPLORATION / FORUM / 2021 • THE ROAD AHEAD' in dark navy and green) at bottom-left, and the Cisco wordmark (navy bars over 'CISCO') at bottom-right. No photographs.
Slide 18
CISCO
Visuals: One Cisco logo, centred. The symbol is a row of nine vertical rounded bars, evenly spaced, with heights stepping short, medium, tall, medium, short, medium, tall, medium, short. The bars sit above the wordmark 'CISCO' in bold, wide-tracked, geometric sans capitals. The logo is a flat single-colour mark in dark teal #003C56 on the cyan background. No photograph, chart or other graphic is present.
Slide 19
For our TEF 2021 on-demand content go to
bit.ly/EATEF2021-OD
If you have any questions or comments, please email [email protected]
@ethernetalliance
@EthernetAllianc
Ethernet Alliance
Visuals: Three red social-media logo lockups stacked vertically and centred: a Facebook 'f' icon followed by the handle '@ethernetalliance' (about 52.8% from top); a Twitter bird icon followed by the handle '@EthernetAllianc' (cut off in the render, about 63.1% from top); and a LinkedIn 'in' rounded-square icon followed by 'Ethernet Alliance' (about 72.0% from top). Each icon and handle is a single flat raster image in bold red (about #E01E26) with a geometric bold sans-serif wordmark. The top green strip is a horizontal gradient bar with no picture content, running from deep green (about #009900) at the left to olive green (about #8DB04B) at the right edge. No photographs or charts.
Download this deck
The hosted PDF of every library deck is free for readers of the SlideDeck Co newsletter. Join with your email and the viewer and download appear here.
Building a deck of your own? The SlideDeck Co Standard Deck is a slide library for business presentations: reviews, updates and plans.







