
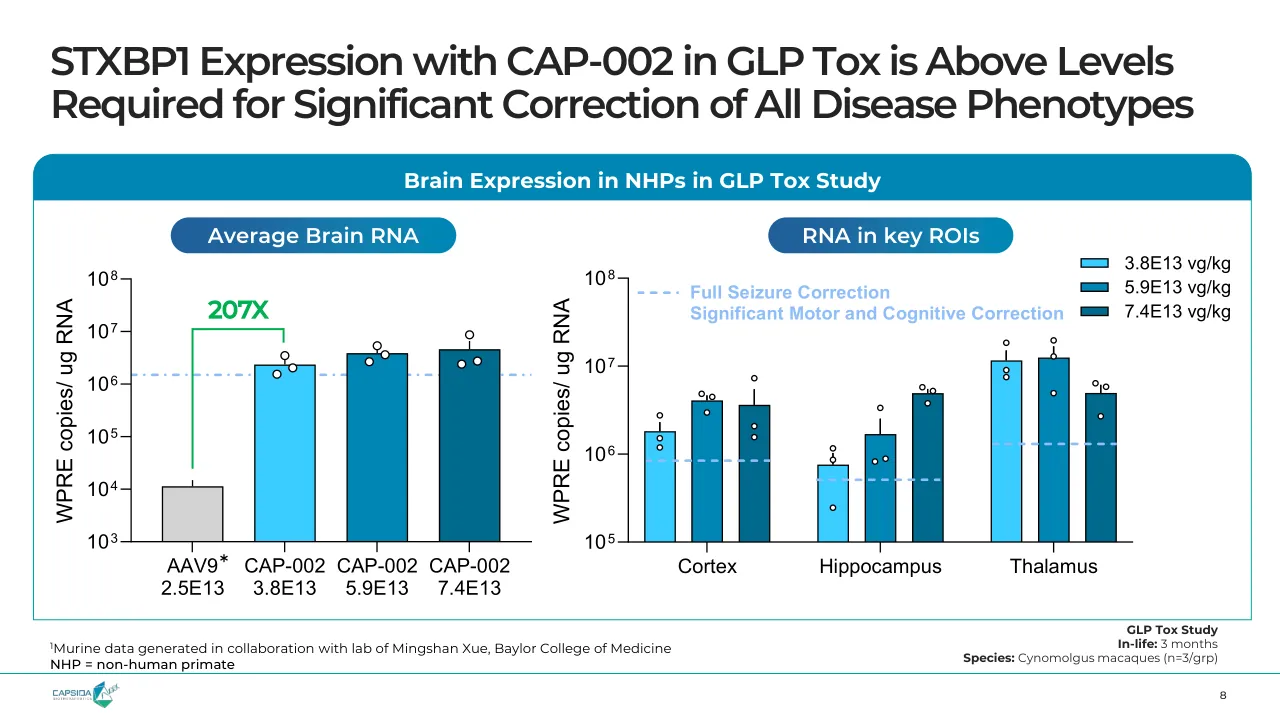
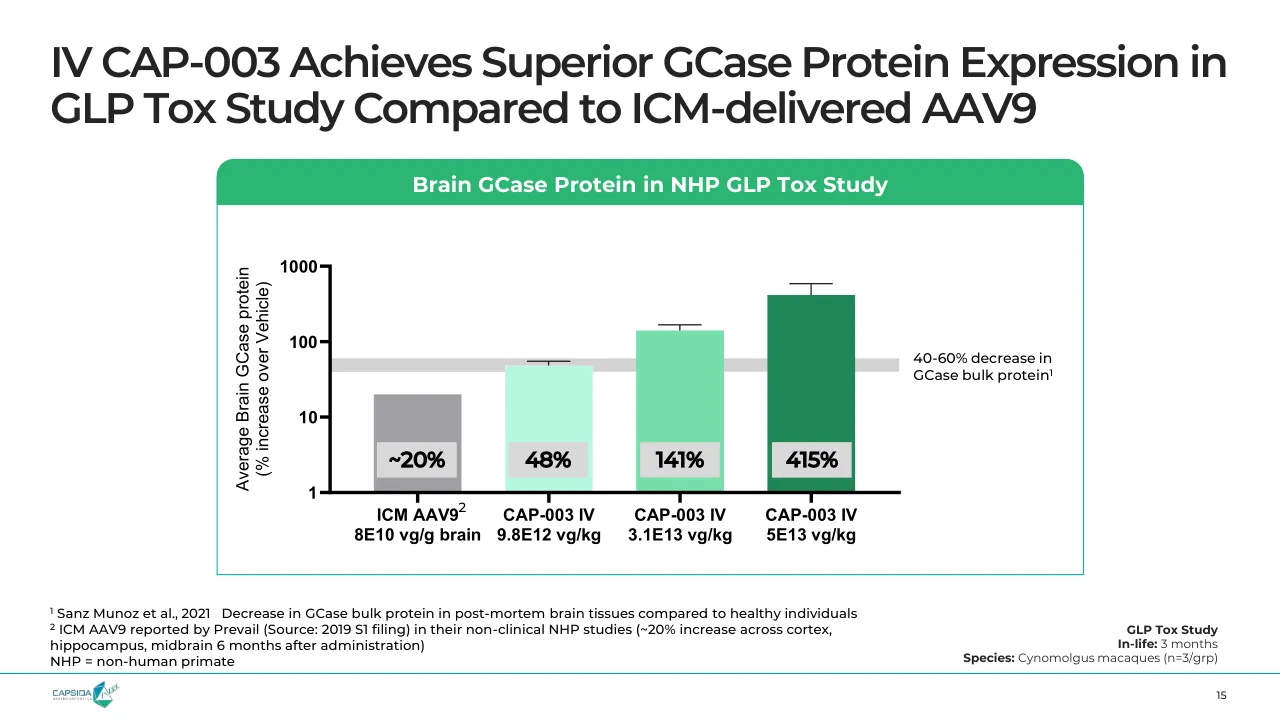
The deck opens with a title slide and a forward-looking statements disclaimer, then frames the problem with first-generation genetic medicines: poor blood-brain barrier crossing, liver and dorsal root ganglia toxicity, narrow therapeutic windows, and risky invasive routes of delivery. It presents Capsida as a next-generation genetic medicines company with three wholly-owned programs in CNS and ophthalmology, followed by a pipeline timeline. Each program gets its own section covering the disease opportunity, preclinical non-human primate data on brain expression and liver and DRG detargeting, and the planned clinical study design. A platform section covers capsid engineering, manufacturing capabilities, and a facility overview. The closing sections list leadership and board members, funding history, and contact details, and the deck ends by repeating the company summary from the opening. Slides 8, 9 and 15 are worth studying for how the company charts preclinical expression and detargeting results against a benchmark, and slide 4 for how the pipeline timeline is laid out across programs.
Slides worth studying
Questions about this deck
What does the Capsida Biotherapeutics deck say about the timeline for its CAP-002 STXBP1-DEE program?
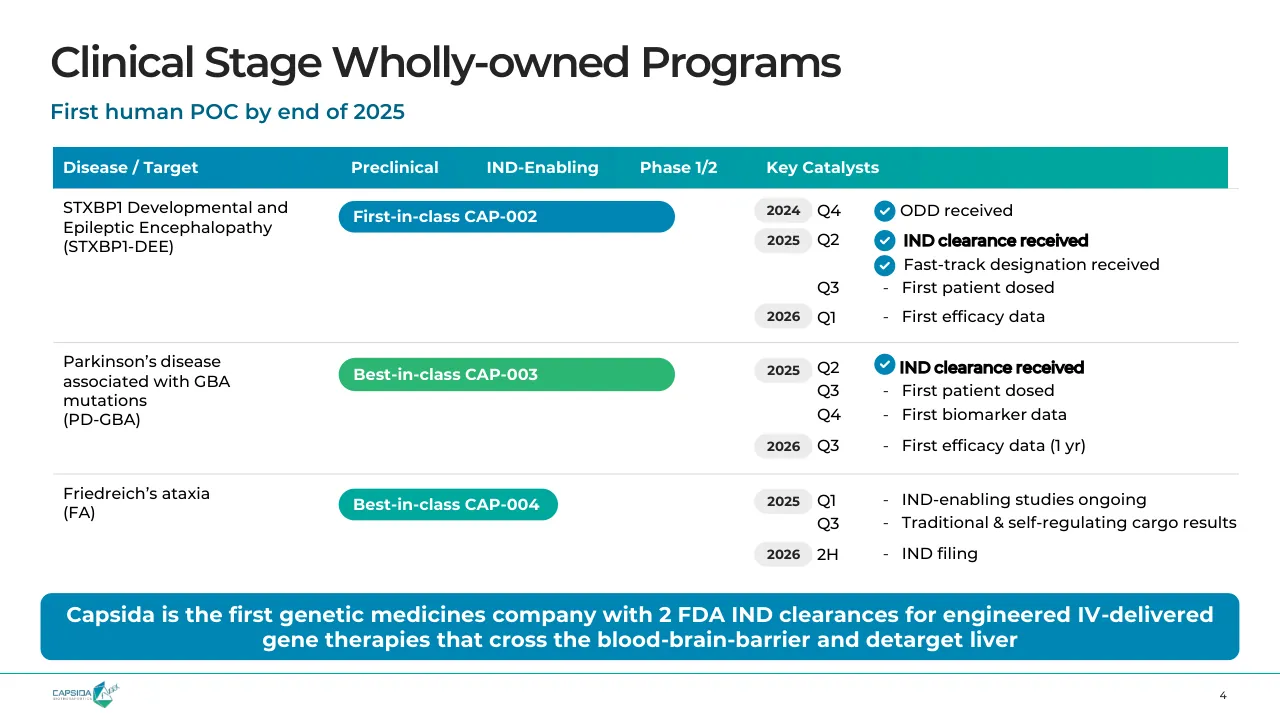
Slide 4 lists CAP-002 with an IND clearance received in 2025 Q2, Fast-track designation received, a first patient dosed in 2025 Q3, and first efficacy data in 2026 Q1. Slide 10 shows the same program with a projected first patient efficacy readout in the 2026 timeline.
How many slides does the Capsida Biotherapeutics corporate presentation have?
The deck has 33 slides. Slide 33 is the closing slide, titled 'Our Pipeline is Making the Impossible Possible,' and it lists the contact email and address.
What market opportunity does the Capsida Biotherapeutics deck give for CAP-003 in Parkinson's disease?
Slide 13 states that up to 15% of all PD cases equals about 330k patients in the US and Europe, that there are no approved GBA1 treatments and no PD disease modifying treatments, and that the opportunity has >$1B peak year sales. The slide also notes potential for expansion to idiopathic PD.
How much funding has Capsida Biotherapeutics raised according to its corporate presentation?
Slide 3 says the company has >$300M funding to date, including $50M Series A. Slide 31 shows the funding history, listing >$300M Funding to Date with rounds including $50M Series A, $90M CNS, $55M Ophthalmology, and $12M convertible note.
Details
- Company: Capsida Biotherapeutics
- Year: 2025
- Type: Investor presentation
- Industry: Biotechnology
- Pages: 33
Review score: 7 out of 10, Effective
Presentation quality, judged with the SlideDeck Co review heuristic. Ask, evidence and idea merit are not rated here.
The deck follows a clear route: problem and solution table (2), company summary (3), pipeline (4), then a repeated block per program of opportunity, preclinical data and clinical plan. Charts on 8, 9 and 15 are well built, with action titles that state the finding, a benchmark bar in grey, callouts such as 207X and 10X, and reference bands. Weaknesses are consequential: many slides have very small footnotes, axis labels and study-design text (11, 20, 21, 28), and slide 4 puts small catalyst lists in a wide table. Slide 32 repeats slide 3 almost exactly and the closing does not drive to a clear takeaway, while the decorative body-figure dividers (5, 12, 22, 26, 29) add little.
Worth keeping: Keep the action-title charts with grey AAV9 benchmark, bracketed fold-change callouts and threshold bands (8, 9, 15), plus the consistent color-coding per program (blue CAP-002, green CAP-003, teal CAP-004) and the repeated opportunity/profile layout (6, 13, 23).
Most useful repair: Enlarge the footnotes, axis labels and trial-design text on slides 11, 20, 21 and 28, and tighten slide 4 so the catalysts read at a glance.
What would change the score: Replace the duplicate slide 32 with a closing summary that states the key milestones to watch, and cut or shrink the divider slides that carry only a stock figure.
Confidence high. 33 of 33 pages inspected on contact sheets, 4 at readable size. Reviewed 2026-11-08. Model-assisted review (claude-sonnet-5-5).
Full text of the slides (33 slides)
Every slide's words and a description of its charts and images, so the deck can be searched and rebuilt. Also available as Markdown.
Slide 1
Capsida Biotherapeutics
Corporate Presentation
Aug 2025
This presentation is made solely for informational purposes and contains forward-looking statements based on current expectations and assumptions. These statements are not guarantees of future results.
The information contained herein is provided only as of the date on which this presentation is made and is subject to change.
This presentation does not constitute an offer or solicitation of any offer to sell or purchase any securities.
1
Visuals: Left: a 3D rendered translucent royal-blue human figure in profile, facing right, with a teal-green brain visible in the head and the heart, lungs and kidneys visible as lighter blue translucent organs. Clusters of dark grey-black glossy spheres (protein or capsid-like particles) form a column running down behind and beside the figure, with one smaller cluster of peach/orange-brown spheres floating in front of the face. The image bleeds off the left, top and bottom edges. Top right: the Capsida Biotherapeutics logo, with 'CAPSIDA' in teal capitals, 'BIOTHERAPEUTICS' in small spaced grey capitals below, and a faceted teal-to-green polygon/gem icon with a DNA helix strand across it. A thin light grey horizontal line runs from about x=43.7% to the right edge at y≈52.7%. A small image at the bottom left (about 4–9% x, 95–98% y) is a tiny footer mark.
Slide 2
Capsida: Working to Solve Challenges of Gen-1 Genetic Medicines
Starting in CNS and Ophthalmology with IP rights and applicability across all therapeutic areas
CNS Challenges
Capsida Solutions*
Crossing / the BBB
Limited ability to cross BBB; / < 1% neuronal transduction
>70% of neurons transduced in NHPs
Safety / Concerns
Liver and dorsal root ganglia (DRG) toxicity
>16x liver & >50x DRG detargeting; lower dosing
Patient / Populations
Narrow therapeutic index (TI) limits to / ultra-rare/rare diseases
Broader TI = more common diseases across ages
Route of / Administration
Direct injection to brain or CSF causes / significant risks and inconsistent expression
IV delivery avoids risks of invasive delivery and / allows for consistent expression
IV delivery increases risk of off-target effects / (esp. liver) and triggering immune response
Well-tolerated safety profile with no adverse / histopathological findings
*based on non-human primate (NHP) data
2
Visuals: Light grey (#F2F2F2) pill header with 'CNS Challenges' and a blue-to-cyan gradient pill header with 'Capsida Solutions*'. Below them a light grey rectangular panel and a blue gradient rectangular panel (dark blue #1F5F9E left to cyan #008CBA right), each split into five rows by thin light horizontal divider lines. Thin grey divider lines also run under the left row labels. A thin teal horizontal line spans the full width above the footer. The Capsida Therapeutics logo (small teal and blue geometric mark with wordmark) sits at bottom left.
Slide 3
Next-generation Genetic Medicines Company
Unlocking the full potential of gene therapy for all
Wholly-owned Pipeline
Fully-integrated Capabilities
External Validation
Two clinical programs in 2025
CAP-002: STXBP1-DEE
IND clearance
ODD granted
Fast Track granted
CAP-003: PD-GBA
IND clearance
Human POC in Q4
Third clinical program in 2026
CAP-004: Friedreich’s ataxia
» Capsid engineering
» Cargo optimization
» Clinical development
» In-house manufacturing
» Protected by expansive IP portfolio
Strategic partnerships
abbvie
1st AbbVie opt-in
($40M) achieved
Contract manufacturing
>$300M funding to date, including $50M Series A
VERSANT ventures
Westlake BioPartners
3
Visuals: Three outlined column panels with thin teal borders and blue-to-teal gradient header bands. Left column: three pill shapes (blue CAP-002 with three white check-circle icons, green CAP-003 with one check-circle and a white bullet dot, teal CAP-004). Centre column: » chevron bullets. Right column: abbvie wordmark logo in dark blue in a rounded outlined box with a » chevron and text, Eli Lilly red script logo in a rounded outlined box, CRISPR Therapeutics black-framed logo in a rounded box, KATE Therapeutics (A Novartis Company) logo in a rounded box with a green/black arrow mark, thin grey divider line above Contract manufacturing. Bottom: light grey rounded bar, Versant Ventures logo (teal V mark, grey text) and Westlake BioPartners logo (navy W mark, blue text) in white rounded boxes with light borders. Footer: thin teal horizontal line across the slide, Capsida Biotherapeutics logo with teal geometric mark at bottom-left.
Slide 4
Clinical Stage Wholly-owned Programs
First human POC by end of 2025
Disease / Target
Preclinical
IND-Enabling
Phase 1/2
Key Catalysts
STXBP1 Developmental and
Epileptic Encephalopathy
(STXBP1-DEE)
First-in-class CAP-002
2024 Q4 ODD received
2025 Q2 IND clearance received
Fast-track designation received
Q3 - First patient dosed
2026 Q1 - First efficacy data
Parkinson’s disease
associated with GBA
mutations
(PD-GBA)
Best-in-class CAP-003
2025 Q2 IND clearance received
Q3 - First patient dosed
Q4 - First biomarker data
2026 Q3 - First efficacy data (1 yr)
Friedreich’s ataxia
(FA)
Best-in-class CAP-004
2025 Q1 - IND-enabling studies ongoing
Q3 - Traditional & self-regulating cargo results
2026 2H - IND filing
Capsida is the first genetic medicines company with 2 FDA IND clearances for engineered IV-delivered
gene therapies that cross the blood-brain-barrier and detarget liver
4
Visuals: Table header bar: horizontal gradient from blue #0086B4 on the left to teal #00A79D on the right, with white bold column labels. Three rounded pill bars: a blue bar 'First-in-class CAP-002' (wide, spanning Preclinical to IND-Enabling), a green bar 'Best-in-class CAP-003' (same width), and a shorter teal bar 'Best-in-class CAP-004'. Grey rounded year chips (2024, 2025, 2026) sit beside the quarter labels. Blue circular check-mark icons mark ODD received, IND clearance received (twice) and Fast-track designation received. Thin grey horizontal divider lines separate the rows. A blue rounded rectangle banner holds white bold text. A thin teal horizontal line runs across the full width above the footer. The Capsida Therapeutics logo (blue wordmark with a teal geometric icon) sits at bottom-left.
Slide 5
CAP-002: STXBP1-DEE
STXBP1 Developmental and Epileptic
Encephalopathy
Visuals: Translucent 3D medical rendering of a human male figure in profile facing right, cropped at the waist and bleeding off the bottom and left edges. The body is a semi-transparent steel blue (#3A5A80) with visible internal organs (heart, lungs, kidneys, blood vessels) in lighter blue-grey. The brain is highlighted in muted teal-green (#5E8F85). Lighting is soft and even, with lighter translucent edges. Behind the figure's back and head, to the upper left, float clusters of dark grey glossy spheres (about #555555) forming protein or molecular structures. They sit against a white-to-pale-blue background and extend off the top edge. A thin light-blue horizontal line (#A9CCF0) crosses the right side at about y 80%.
Slide 6
STXBP1 Developmental and Epileptic Encephalopathy
Opportunity
DEE (like LGS and Dravet) with / no approved treatments
Seizures, developmental delays, / and motor impairment
~5,000 pediatric patients in US / and Europe
Genetic validation and potential / for FDA approval after Ph2
>$1B peak year sales
CAP-002
First and best in class IV-administered program
Industry-leading brain wide STXBP1 protein increases
Potential for correction of all phenotypes
Safety demonstrated in GLP-Toxicology study in NHPs, / including liver and DRGs
ODD and Fast Track granted
Successful IND clearance
SYNRGY Ph 1/2a clinical trial start up activities have initiated
6
Visuals: Left card: white rounded rectangle with a light grey outline and a light grey (#DCDDDE) header band; five light grey (#C4C5C8) circle bullets; thin grey divider lines between items (not after the last). Right card: pale blue (#E5F8FF) rounded rectangle with a blue outline and a blue (#0086B4) header band; six blue circular icons, each with a white check mark; thin pale grey-blue divider lines between items. Bottom banner: blue (#008EC0) rounded rectangle with a large corner radius. Thin teal horizontal line across the full width above the footer. Capsida Therapeutics logo at bottom left: small blue 'CAPSIDA' wordmark with a green and teal geometric shape and a script mark.
Slide 7
CAP-002 Restores Normal
STXBP1 Expression and
Neuronal Firing in Human
Knock Out Neurons*
Normal
#cell
0 20 40 60 80 100
Time (s)
CAP-002 restores neurons to normal firing
#cell
0 20 40 60 80 100
Time (s)
#cell
0 20 40 60 80 100
Time (s)
STXBP1 Knock Out*
STXBP1 Knock Out* with CAP-002
*in vitro data
Generated in collaboration with Neurospector, a CRO established by Matthijs Verhage’s laboratory at VUmc Research BV, part of Foundation Stichting Amsterdam UMC
7
Visuals: Three raster images of neuronal calcium-trace raster plots, each with grey line traces per cell and small red circle markers for detected firing peaks. Axes are #cell (vertical, unlabelled ticks) and Time (s) from 0 to 100 with ticks at 0, 20, 40, 60, 80, 100. Top-right 'Normal' plot: grey 4px border, synchronised vertical bands of peaks about every 8-10 s, about 13 bursts. Bottom-left STXBP1 Knock Out plot: red 4px border, dense irregular unsynchronised peaks scattered across all cells and times. Bottom-right Knock Out with CAP-002 plot: blue border with a rounded-top blue header tab, regular synchronised vertical bursts, about 14 bursts, closely resembling the Normal plot. A thin teal horizontal line spans the slide width above the footer. A Capsida Biotherapeutics logo (small teal and blue geometric cube/neuron icon with 'CAPSIDA' text) sits bottom-left.
Slide 8
STXBP1 Expression with CAP-002 in GLP Tox is Above Levels
Required for Significant Correction of All Disease Phenotypes
Brain Expression in NHPs in GLP Tox Study
Average Brain RNA
RNA in key ROIs
207X
WPRE copies/ ug RNA
10^8
10^7
10^6
10^5
10^4
10^3
AAV9*
CAP-002
CAP-002
CAP-002
2.5E13
3.8E13
5.9E13
7.4E13
WPRE copies/ ug RNA
10^8
10^7
10^6
10^5
Full Seizure Correction
Significant Motor and Cognitive Correction
3.8E13 vg/kg
5.9E13 vg/kg
7.4E13 vg/kg
Cortex
Hippocampus
Thalamus
1Murine data generated in collaboration with lab of Mingshan Xue, Baylor College of Medicine
NHP = non-human primate
GLP Tox Study
In-life: 3 months
Species: Cynomolgus macaques (n=3/grp)
8
Visuals: Left chart: bar chart titled by the pill 'Average Brain RNA'. The y axis is logarithmic, 10^3 to 10^8, labelled 'WPRE copies/ ug RNA'. Four bars: AAV9* 2.5E13 in light grey, about 1.1x10^4, with a small error bar; CAP-002 3.8E13 in light cyan, about 2.3x10^6; CAP-002 5.9E13 in mid blue, about 3.8x10^6; CAP-002 7.4E13 in dark teal-blue, about 4.5x10^6. Each CAP-002 bar has three white circle data points with black outlines and an upward error bar. A light blue dash-dot horizontal line sits at about 1.5x10^6 across the chart. A green bracket from the top of the AAV9 bar region up to the 3.8E13 bar is labelled '207X' in green bold. Right chart: grouped bar chart under the pill 'RNA in key ROIs'. The y axis is logarithmic, 10^5 to 10^8, labelled 'WPRE copies/ ug RNA'. Three groups, each with three bars for 3.8E13 (light cyan), 5.9E13 (mid blue) and 7.4E13 (dark teal) vg/kg. Cortex bars are about 1.8x10^6, 4x10^6 and 3.6x10^6. Hippocampus bars are about 7.5x10^5, 1.7x10^6 and 4.8x10^6. Thalamus bars are about 1.1x10^7, 1.2x10^7 and 5x10^6. Bars have black outlines, white dot points and error bars. Light blue dashed horizontal lines mark thresholds at about 8.5x10^5 over Cortex, 5x10^5 over Hippocampus and 1.3x10^6 over Thalamus. A legend at upper right has three small swatches for 3.8E13, 5.9E13 and 7.4E13 vg/kg. A light blue dashed legend line next to the labels 'Full Seizure Correction' and 'Significant Motor and Cognitive Correction'. A small Capsida Biotherapeutics logo with a teal geometric icon is at bottom left.
Slide 9
CAP-002 is Substantially Detargeted from Liver and DRGs / in NHPs in GLP Tox Compared to AAV9
Liver DNA in NHP GLP Tox Study
DRG RNA in NHP GLP Tox Study
10X
13X
WPRE copies/ ug DNA
WPRE copies/ ug RNA
10^9
10^8
10^7
10^6
10^5
10^8
10^7
10^6
10^5
10^4
AAV9 *
CAP-002
CAP-002
CAP-002
2.5E13
3.8E13
5.9E13
7.4E13
vg/kg
vg/kg
vg/kg
vg/kg
AAV9 *
CAP-002
CAP-002
CAP-002
2.5E13
3.8E13
5.9E13
7.4E13
vg/kg
vg/kg
vg/kg
vg/kg
Well-tolerated safety profile with no adverse histopathological findings
*Historical IV-delivered AAV9 2.5E13 vg/kg (non-STXBP1 cargo control)
NHP = non-human primate
GLP Tox Study
In-life: 3 months
Species: Cynomolgus macaques (n=3/grp)
9
Visuals: Two bar charts on a log scale, each with 4 bars and individual dots per animal (n=3). Left chart: Liver DNA, y-axis WPRE copies/ug DNA, 10^5 to 10^9. Bars: AAV9 2.5E13 vg/kg light grey, about 7E7, three filled black dots clustered at the top. CAP-002 3.8E13 bright cyan, about 7E6, open white dots at about 1.3E7, 5E6 and 2E6. CAP-002 5.9E13 mid blue, about 1.1E7, open dots about 1.4E7, 1.2E7 and 8E6. CAP-002 7.4E13 dark teal-blue, about 8E6, open dots about 1.7E7, 8E6 and 1.5E5. A green bracket from the AAV9 bar to the CAP-002 3.8E13 bar is labelled 10X. Right chart: DRG RNA, y-axis WPRE copies/ug RNA, 10^4 to 10^8. AAV9 grey bar about 3E6, black dots about 6E6, 1.7E6 and 9E5, with error bar. CAP-002 3.8E13 cyan bar about 2.4E5, open dots about 4.5E5, 2E5 and 8E4. CAP-002 5.9E13 blue bar about 4.5E5, open dots about 7E5, 4.5E5 and 2.2E5. CAP-002 7.4E13 dark blue bar about 6.8E5, open dots about 1E6, 7E5 and 4.5E5. A green bracket from the AAV9 bar to the CAP-002 3.8E13 bar is labelled 13X. The bars have thin black outlines and the axes are black, with tick marks. Asterisks follow AAV9 on both x-axes. The Capsida Biotherapeutics logo, a teal geometric gem with blue text, sits bottom left. A thin teal horizontal line spans the slide above the footer.
Slide 10
CAP-002 Phase 1/2a SYNRGY Study
Potential for approval after Phase 2 study
Clinical Ph1/2 / Planning
Population
» 18 months – 7 years
» Potential expansion / to broader ages
» Ph1: 6 patients
Key Measurements
» Safety
» Motor, language, neurocognitive, / seizure, and EEG
» Clinical scales consistent with / STARR natural history study
Plan to leverage / Fast Track, ODD, and / other designations to / accelerate approval
2025
2026
Q1
Q2
Q3
Q4
Q1
Q2
Q3
Q4
CAP-002 / (STXBP1-DEE) / Program / Overview
IND-Enabling
Clinical Ph1/2a
IND Clearance
Fast Track Granted
Projected 1st Patient Dosed
Projected 1st Patient Efficacy
Projected FDA Meeting
For more information about the SYNRGY trial, please visit www.clinicaltrials.gov and search for NCT06983158
EEG = electroencephalogram; STARR = STXBP1 Clinical Trial Ready
10
Visuals: Gantt-style timeline: teal header bar with years 2025 (Q1–Q4) and 2026 (Q1–Q4), a grey quarter row, vertical thin grey gridlines between quarters with a light-blue line at the 2025/2026 boundary. Row label 'CAP-002 (STXBP1-DEE) Program Overview' in a grey box. A light-blue pill 'IND-Enabling' spans 2025 Q1 and a longer light-blue pill 'Clinical Ph1/2a' spans 2025 Q2 to 2026 Q4. Milestones: teal six-point star plus black checkmark at 'IND Clearance' (2025 Q2); teal diamond plus checkmark at 'Fast Track Granted' (2025 Q2–Q3); star at end of 'Projected 1st Patient Dosed' (2025 Q3) with a thin teal arrow pointing right to about the start of 2026 Q1; star at end of 'Projected 1st Patient Efficacy' (start of 2026 Q1) with a teal arrow to about 2026 Q3; teal diamond before 'Projected FDA Meeting' (2026 Q3). The Capsida Biotherapeutics logo (teal text with a green and teal geometric mark) sits at bottom left.
Slide 11
CAP-002 Phase 1/2a SYNRGY Study (NCT06983158)
A Clinical Trial of CAP-002 Gene Therapy in Pediatric Patients With Syntaxin-Binding Protein 1 (STXBP1) Encephalopathy
ClinicalTrials.gov ID NCT06983158
Sponsor Capsida Biotherapeutics, Inc.
Ph1
Dose escalation
N=6
Ph2a (single dose)
N=6
Primary endpoints:
• Safety
Clinician reported secondary endpoints:
• Bayley Scales of Infant & Toddler Development
• Gross Motor Function
• STXBP1-Clinical Severity Assessment-Clinician
• Peabody Developmental Motor Scales
Caregiver reported secondary endpoints
“This is the first potentially disease-modifying treatment for STXBP1-DEE, and we are excited to be part of the SYNRGY clinical trial,”
- Ingo Helbig, M.D., Pediatric Neurologist and Director of Clinical Research at the Center for Epilepsy and Neurodevelopmental Disorders (ENDD) at Children’s Hospital of Philadelphia (CHOP), and paid consultant to Capsida¹
“STXBP1-related disorders present devastating challenges in communication, development, motor function and seizures. We are in dire need of targeted therapies that can improve the lives and functioning of our children and families,”
- Charlene Son Rigby, STXBP1 Foundation President & Founder¹
¹ Capsida May 12, 2025 press release
See clinicaltrials.gov for full list of clinician & caregiver secondary endpoints
11
Visuals: A screenshot image of the ClinicalTrials.gov header (grey-black condensed bold title in two lines, dark blue labels 'ClinicalTrials.gov ID' and 'Sponsor', each followed by a dark navy circular info icon, with the values in dark grey condensed text). Left: a white rounded rectangle with a teal (#0086B4) outline containing two teal rounded rectangles with dark navy outlines (upper taller 'Ph1 Dose escalation N=6', lower 'Ph2a (single dose) N=6'). Right: a teal rounded-corner rectangle with white text. Two pale blue (#DCEAF7) rectangles with soft drop shadows holding the quotes. A thin teal horizontal line across the slide above the footer. Small Capsida Biotherapeutics logo (blue wordmark 'CAPSIDA' with a teal/green geometric polyhedron icon and a faint script mark) at bottom left.
Slide 12
CAP-003: PD-GBA
Parkinson’s disease associated
with GBA mutations
Visuals: Semi-transparent 3D medical illustration of a male torso and head in profile facing right, rendered in translucent steel blue. The brain is tinted muted green. Internal organs are visible: heart, lungs, kidneys and blood vessels. The figure is cropped at the waist by the bottom edge, with lighting soft and even. Behind the shoulder and head at upper left, clusters of dark grey glossy spheres form protein or molecular aggregates, some in strands and some in clumps, partly cropped by the top and left edges. A thin pale blue horizontal line crosses the right side at about 80% height.
Slide 13
Parkinson’s Disease Associated with GBA Mutations
Opportunity
Up to 15% of all PD cases = ~330k
patients in US and Europe
No approved GBA1 treatments
and no PD disease modifying
treatments
>$1B peak year sales
Potential for expansion to
idiopathic PD
CAP-003
Best in class IV-administered program
Industry-leading brainwide GCase enzyme elevation
Potential for significant disease modification
Safety demonstrated in GLP-Toxicology study in NHPs,
including liver and DRGs
Successful IND clearance
NHP = non-human primate
13
Visuals: Left card: white body with light grey outline and rounded corners, grey header band, four light grey circular bullet markers, thin grey divider lines between items. Right card: mint green body with teal outline and rounded corners, green header band, five teal filled circles with white check marks, thin grey-green divider lines between items. A thin teal horizontal line runs across the full width above the footer. Bottom left: small Capsida Therapeutics logo (blue wordmark 'CAPSIDA' with teal and blue geometric polyhedron mark).
Slide 14
IV-delivered CAP-003 Achieves Superior RNA Expression
Compared to ICM-delivered AAV9 in NHPs
Brain RNA in NHP GLP Tox Study
AAV9 2E11 vg/g ICM¹
CAP-003 3.1E13 vg/kg IV
CAP-003 9.8E12 vg/kg IV
CAP-003 5.0E13 vg/kg IV
WPRE copies/µg RNA
10⁸
10⁷
10⁶
10⁵
10⁴
10³
10²
181X
5888X
Frontal Cortex
Putamen
¹AAV9 ICM data generated from past Capsida study with same expression cassette (promoter, regulatory elements, etc.) but / different therapeutic cargo; no protein or %neuron comparison possible
NHP = non-human primate
GLP Tox Study
In-life: 3 months
Species: Cynomolgus macaques (n=3/grp)
14
Visuals: Grouped bar chart on a log scale in a card with a green header band 'Brain RNA in NHP GLP Tox Study'. Y axis 'WPRE copies/µg RNA' from 10^2 to 10^8 with ticks at each decade; X axis has two groups, Frontal Cortex and Putamen, with a tick under each group. Legend (2x2) of square swatches: grey AAV9 2E11 vg/g ICM¹, pale mint CAP-003 9.8E12 vg/kg IV, medium green CAP-003 3.1E13 vg/kg IV, dark green CAP-003 5.0E13 vg/kg IV. Frontal Cortex bars: grey about 1.7x10^4 (error cap about 2.7x10^4), pale mint about 4.8x10^5 (cap about 5.5x10^5), medium green about 3x10^6 (cap about 4x10^6), dark green about 1.2x10^7 (cap about 1.8x10^7). Putamen bars: grey about 5.5x10^2 with no error bar, pale mint about 3x10^5 (cap about 3.8x10^5), medium green about 3.5x10^6 (cap about 4.5x10^6), dark green about 4x10^6 (cap about 6.5x10^6). Green bracket lines with green labels '181X' above Frontal Cortex and '5888X' above Putamen link the grey bar to the medium-green bar, ending in a downward arrow tick over the medium-green bar. Error bars are black T-caps. Capsida Biotherapeutics logo (blue text with teal geometric polyhedron icon) bottom left. Thin teal horizontal line across the slide above the footer.
Slide 15
IV CAP-003 Achieves Superior GCase Protein Expression in
GLP Tox Study Compared to ICM-delivered AAV9
Brain GCase Protein in NHP GLP Tox Study
Average Brain GCase protein
(% increase over Vehicle)
1000
100
10
1
~20%
48%
141%
415%
ICM AAV9²
8E10 vg/g brain
CAP-003 IV
9.8E12 vg/kg
CAP-003 IV
3.1E13 vg/kg
CAP-003 IV
5E13 vg/kg
40-60% decrease in
GCase bulk protein¹
¹ Sanz Munoz et al., 2021 Decrease in GCase bulk protein in post-mortem brain tissues compared to healthy individuals
² ICM AAV9 reported by Prevail (Source: 2019 S1 filing) in their non-clinical NHP studies (~20% increase across cortex,
hippocampus, midbrain 6 months after administration)
NHP = non-human primate
GLP Tox Study
In-life: 3 months
Species: Cynomolgus macaques (n=3/grp)
15
Visuals: Bar chart on a log scale inside a white card with a thin teal outline and a green rounded-top header bar reading 'Brain GCase Protein in NHP GLP Tox Study'. Y axis is a black line with ticks at 1, 10, 100 and 1000 (log scale), titled 'Average Brain GCase protein (% increase over Vehicle)' (rotated). X axis is a thick black line with four ticks. Four bars: grey (#A0A0A4) ICM AAV9 8E10 vg/g brain, no error bar, top about 20; very light mint (#B4F8DF) CAP-003 IV 9.8E12 vg/kg, top about 48 with a small error bar to about 55; medium mint green (#75DEAB) CAP-003 IV 3.1E13 vg/kg, top about 141 with error bar to about 170; dark green (#208856) CAP-003 IV 5E13 vg/kg, top about 415 with error bar to about 590. Each bar has a light grey (#DADADA) label box near its base with bold value: ~20%, 48%, 141%, 415%. A light grey horizontal band (#D4D4D4) spans the plot between about 40 and 60 on the axis, with the annotation '40-60% decrease in GCase bulk protein¹' to its right. A thin teal horizontal line runs across the full slide width above the footer. The Capsida Biotherapeutics logo (small blue text with a teal geometric icon) sits at bottom left. No legend.
Slide 16
CAP-003 Exceeds Efficacy Threshold for Normalizing GCase
Activity in Patients in NHP GLP Tox Study
Brain GCase Activity in NHP GLP Tox Study
1000
100
10
1
Average Brain GCase activity
(% increase over Vehicle)
10%
86%
206%
30% therapeutic threshold¹
(based on human post-mortem data)
CAP-003
9.8E12 vg/kg
CAP-003
3.1E13 vg/kg
CAP-003
5E13 vg/kg
¹Leyns et al., 2023. Post-mortem studies demonstrate an approximate 30% GCase activity deficit in patients compared to
healthy individuals
NHP = non-human primate
GLP Tox Study
In-life: 3 months
Species: Cynomolgus macaques (n=3/grp)
16
Visuals: Bar chart in a white panel with a thin teal outline and a green (#2BB673) rounded-top header band reading 'Brain GCase Activity in NHP GLP Tox Study'. Log-scale y-axis from 1 to 1000 with ticks at 1, 10, 100 and 1000, titled 'Average Brain GCase activity (% increase over Vehicle)' (rotated). Three vertical bars on a black x-axis with tick marks below each bar. Bar 1, CAP-003 9.8E12 vg/kg, is pale mint (#D1F4E3), height about 10, with a label box '10%' and a small error bar up to about 11. Bar 2, CAP-003 3.1E13 vg/kg, is medium mint green (#75DEAB), height about 86, labelled '86%', error bar up to about 115. Bar 3, CAP-003 5E13 vg/kg, is dark green (#208856), height about 206, labelled '206%', error bar up to about 290. Each percent label sits in a light grey (#D9D9D9) rectangle near the bar base. A black dashed horizontal line at about 30 crosses the chart and extends right of the bars to the label '30% therapeutic threshold¹ (based on human post-mortem data)'. A small Capsida Biotherapeutics logo with a teal/blue polyhedral mark sits at bottom-left. A thin teal horizontal line runs full width above the footer.
Slide 17
CAP-003 Significantly Increases GCase in CSF in GLP Tox
Study Validating Use as Clinical Biomarker
GCase Protein in CSF in NHP GLP Tox Study
Correlation of CSF GCase Protein
& Brain GCase Activity
GCase protein in CSF
(% increase over Vehicle)
10000
1000
100
10
1
72%
479%
984%
CAP-003
9.8E12 vg/kg
CAP-003
3.1E13 vg/kg
CAP-003
5E13 vg/kg
10
5
0
-5
r = 0.986
p < 0.0001
GCase protein
CSF (ng/mg)
0.2
0.4
0.6
0.8
1.0
Average Brain GCase activity
(mU/g protein)
NHP = non-human primate
GLP Tox Study
In-life: 3 months
Species: Cynomolgus macaques (n=3/grp)
17
Visuals: Left panel: log-scale bar chart with three bars and error bars, y-axis 1 to 10000 (ticks 1, 10, 100, 1000, 10000), black axis lines, y-axis title 'GCase protein in CSF (% increase over Vehicle)'. Bars: CAP-003 9.8E12 vg/kg pale mint (#D1F4E3) at about 72, labelled 72% in a light grey box; CAP-003 3.1E13 vg/kg medium mint green (#75DEAB) at about 479, labelled 479%; CAP-003 5E13 vg/kg dark green (#208856) at about 984, labelled 984%. Error bars extend to about 110, 580 and 1400 respectively. Tick marks under each bar. Right panel: scatter plot with regression line and dotted confidence band, x-axis Average Brain GCase activity (mU/g protein) 0.2 to 1.0 with ticks at 0.2, 0.4, 0.6, 0.8, 1.0; y-axis GCase protein CSF (ng/mg) from -5 to 10 with ticks -5, 0, 5, 10. About 12 black dots, clustered near (0.2–0.35, 0–2) and others at about (0.34, 2.1), (0.41, 3.8), (0.56, 3.8), (0.82, 7.4), (0.91, 9.0). A boxed black-outline text 'r = 0.986 / p < 0.0001' sits at top left of the plot. Teal horizontal rule near the bottom of the slide. Capsida Biotherapeutics logo (small blue text with a teal geometric icon) at bottom left.
Slide 18
Decreased GluSph Levels in Plasma Confirm Target
Engagement in GLP Tox Study in Healthy NHPs
Plasma GluSph in NHP GLP Tox Study
-29%
-11%
-32%
0
-10
-20
-30
-40
-50
GluSph in plasma
(% change from Vehicle)
CAP-003
9.8E12 vg/kg
CAP-003
3.1E13 vg/kg
CAP-003
5E13 vg/kg
GluSph = Glucosylsphingosine
NHP = non-human primate
GLP Tox Study
In-life: 3 months
Species: Cynomolgus macaques (n=3/grp)
18
Visuals: A bar chart in a white panel with a thin teal outline (about x 17-84%, y 22-90%) and a rounded-top green header band reading 'Plasma GluSph in NHP GLP Tox Study'. Chart is titled by that band. Y axis: 'GluSph in plasma (% change from Vehicle)', range 0 at top to -50 at bottom, ticks every 10 (0, -10, -20, -30, -40, -50), thick black axis lines. The x axis is drawn at the bottom (-50) with three tick marks. Three downward bars hang from the 0 line at the top, each with a downward error bar with a cap. Bar 1: CAP-003 9.8E12 vg/kg, pale mint (#D1F4E3), value -29%, error bar to about -41. Bar 2: CAP-003 3.1E13 vg/kg, medium mint green (#75DEAB), value -11%, error bar to about -25. Bar 3: CAP-003 5E13 vg/kg, dark green (#208856), value -32%, error bar to about -39. Above each bar is a light grey (#D9D9D9) rectangular label box with its percentage in bold black. No legend. A thin teal horizontal rule spans the full slide width above the footer. A small CAPSIDA Therapeutics logo (teal text with a teal and green geometric polyhedron icon) at bottom-left.
Slide 19
GLP Tox Data Demonstrate CAP-003 is Substantially Detargeted
from Liver and DRGs in NHPs Compared to AAV9
Liver DNA
DRG RNA
18X lower at double the dose
3X lower at double the dose
DNA biodistribution
(WPRE copies/µg DNA)
10^8
10^7
10^6
RNA biodistribution
(WPRE copies/µg RNA)
10^7
10^6
10^5
AAV9*
2.5E13 vg/kg
CAP-003
5E13 vg/kg
AAV9*
2.5E13 vg/kg
CAP-003
5E13 vg/kg
Well-tolerated safety profile with no adverse histopathological findings
*Historical IV-delivered AAV9 2.5E13 vg/kg (non-GBA cargo control)
NHP = non-human primate
GLP Tox Study
In-life: 3 months
Species: Cynomolgus macaques (n=3/grp)
19
Visuals: Two bar charts on log scales, each in a white panel with thin teal outline and green rounded-top header. Left chart (Liver DNA): y-axis 10^6 to 10^8, label 'DNA biodistribution (WPRE copies/µg DNA)'. Grey bar AAV9* 2.5E13 vg/kg reaches about 7x10^7 with a tiny error bar. Dark green bar CAP-003 5E13 vg/kg reaches about 4x10^6 with an upper error bar to about 5x10^6. Green bracket line from the top of the AAV9 bar down to the CAP-003 bar, annotated '18X lower at double the dose'. Right chart (DRG RNA): y-axis 10^5 to 10^7, label 'RNA biodistribution (WPRE copies/µg RNA)'. Grey AAV9* bar reaches about 3x10^6 with an error bar up to about 5x10^6. Dark green CAP-003 bar reaches about 9x10^5 with an error bar to about 1.1x10^6. Green bracket annotated '3X lower at double the dose'. Black axes with tick marks. A blue-to-teal gradient rounded banner holds white text. The Capsida Biotherapeutics logo (teal text with a hexagonal icon) sits at bottom left. A thin teal horizontal line spans the full width above the footer.
Slide 20
CAP-003 (PD-GBA) Phase 1/2 Clinical Plan
Clinical Ph1/2
Planning
Population
» Ages 21-75 years
» PD Hoehn & Yahr
Stage 1-3
» Ph1: 6 patients
Key Measurements
» Safety
» Biomarkers (e.g., GCase, GluSph, & GluCer)
» 1 & 2-year efficacy (e.g., MDS-UPDRS, cognition, etc.)
2025
2026
Q1
Q2
Q3
Q4
Q1
Q2
Q3
Q4
IND-Enabling
Clinical Ph1/2
CAP-003
(PD-GBA)
Program
Overview
IND Clearance
Projected 1st Patient Dosed
Projected 1st Patient Biomarkers
Projected 1st Patient Efficacy (1 yr)
Projected FDA Meeting
For more information about the Phase 1/2 trial, please visit www.clinicaltrials.gov and search for NCT07011771
GluSph = glucosylsphingosine; GluCer = glucosylceramide;
MDS-UPDRS = Unified Parkinson's Disease Rating Scale
20
Visuals: Gantt timeline with 2025 and 2026 headers and Q1-Q4 each, with faint vertical grey quarter dividers and a light teal divider at the year boundary. Mint pill bars: IND-Enabling spans 2025 Q1 to mid Q2, Clinical Ph1/2 spans from late Q2 2025 to end of 2026 Q4. Green six-pointed star markers precede the milestones. IND Clearance has a star and a black checkmark at about Q2/Q3 2025. Projected 1st Patient Dosed has a star at about 2025 Q3 and a green arrow running to about 2026 Q1. Projected 1st Patient Biomarkers has a star at about 2025 Q4 and an arrow to about 2026 Q2. Projected 1st Patient Efficacy (1 yr) has a star at about 2026 Q3 and an arrow to the right end of 2026 Q4. Projected FDA Meeting has a green diamond at about 2026 Q2/Q3. Capsida Biotherapeutics logo at bottom-left, with teal text and a teal and green geometric mark. Thin teal horizontal line above the footer.
Slide 21
CAP-003 Phase 1/2 Study (NCT07011771)
A Clinical Trial of CAP-003 Gene Therapy in Adult Patients With GBA1 Associated Parkinson's Disease
ClinicalTrials.gov ID NCT07011771
Sponsor Capsida Biotherapeutics, Inc.
Ph1
Dose escalation
N=6
Ph2 (single dose)
N=25
Primary endpoints:
• Safety
Efficacy (secondary endpoints)
• CSF and plasma glucosylsphingosine (GluSph) biomarker change
• CSF and plasma β-Glucocerebrosidase (GCase) biomarker change
• MDS-UPDRS disease rating change
“We recognize the urgency for new treatment approaches, so we are working diligently to initiate the Phase 1/2 clinical trial for CAP-003 with the aim of dosing the first patient in the third quarter of this year,” –
Swati Tole, M.D., Chief Medical Officer of Capsida Biotherapeutics
See clinicaltrials.gov for full list of clinician & caregiver secondary endpoints
21
Visuals: Left: a white rounded rectangle with a green (#2BB673) outline containing two green rounded rectangles with dark navy outlines (Ph1 Dose escalation N=6, Ph2 single dose N=25). Right: a solid green rounded rectangle with white bullet text. A pale mint quote box with a subtle drop shadow. Two small navy circled 'i' info icons next to the labels. A thin teal horizontal line across the slide above the footer. A Capsida Biotherapeutics logo at bottom left (small teal geometric emblem with blue 'CAPSIDA' wordmark).
Slide 22
CAP-004: FA
Friedreich’s ataxia
Visuals: Full-slide pale gradient background. On the left, a 3D medical illustration of a translucent blue-grey human torso and head in profile facing right, cropped at the waist by the bottom edge. Inside it are visible organs: a green-tinted brain in the head, lungs, a heart, kidneys and vessels, in muted blues. Soft studio lighting with a transparent, glassy look. Behind the figure's shoulder and upper left are clusters of dark grey metallic spheres forming molecular or protein structures that trail diagonally from the top centre-left down to the shoulder. They fade into white at the left. A thin light-blue horizontal line extends from the torso to the right edge.
Slide 23
Friedreich’s Ataxia
Opportunity
CNS, cardiac, and sensory / manifestations
~5,000 patients in the US and / 15,000 worldwide
Genetic validation and potential / for FDA approval after Ph2
>$1B peak year sales
CAP-004
Best in class IV-administered program
Industry-leading frataxin protein expression in all / relevant tissues
Potential for correction of CNS, cardiac, and / sensory manifestations
Safety demonstrated in NHPs, including liver and DRGs
IND-enabling studies ongoing, incl. self-regulating cargo
2H 2026 IND Filing
23
Visuals: Left card: white body with light grey outline, rounded corners, grey header band, four grey circle bullets, thin grey divider lines between items. Right card: pale cyan body with thin green outline and rounded corners, teal header band, five green filled circles with white checkmarks and one empty green outlined circle for the last item, thin light-teal divider lines between items. Thin teal horizontal line across the full width near the bottom. Capsida Biotherapeutics logo (teal text with a teal and green geometric polyhedron mark and a script wordmark) at bottom-left.
Slide 24
IV CAP-004 Achieves Therapeutically Meaningful RNA Expression
Levels in Key FA Tissues While Detargeting Liver
Brain FXN in NHPs
Spinal Cord & Sensory
Neuron FXN in NHPs
Liver FXN in NHPs
>750X
>600X
>13X
<6X
>14X
WPRE copies/ug RNA
10^8
10^7
10^6
10^5
10^4
10^3
Motor Cortex
Cerebellum
SC
DRG
Retina
Liver
AAV9 2.5E13 vg/kg1
CAP-004 2.5E13 vg/kg
FXN = Frataxin
1 AAV9 data generated from past Capsida study with same expression cassette (promoter, regulatory elements, etc.) but different therapeutic cargo
24
Visuals: Three log-scale bar charts, each in a white panel with a thin teal outline and a teal header with rounded top corners. All three y-axes read 'WPRE copies/ug RNA' with ticks 10^3, 10^4, 10^5, 10^6, 10^7, 10^8. Grey bars are AAV9 and teal bars are CAP-004, with black error bars. Values below are estimates. Chart 1, Brain FXN in NHPs, x categories Motor Cortex and Cerebellum. Motor Cortex: AAV9 about 8x10^3 (error about 5x10^3 to 1.1x10^4), CAP-004 about 6x10^6 (error about 1.5x10^6 to 1.1x10^7). Cerebellum: AAV9 about 1.4x10^4 (error about 1x10^4 to 2x10^4), CAP-004 about 8x10^6 (error about 6x10^6 to 1.1x10^7). Teal bracket lines link the grey and teal bars of each category, labelled >750X over Motor Cortex and >600X over Cerebellum. Chart 2, Spinal Cord & Sensory Neuron FXN in NHPs, categories SC, DRG, Retina. SC: AAV9 about 6x10^5 (error about 2x10^5 to 1x10^6), CAP-004 about 7x10^6 (error about 3x10^6 to 1.2x10^7). DRG: AAV9 about 3x10^6 (error about 1.5x10^6 to 5x10^6), CAP-004 about 5x10^5 (error about 3x10^5 to 7x10^5). Retina: no AAV9 bar, CAP-004 about 1.7x10^6 (error about 1.3x10^6 to 2.2x10^6). Teal brackets are labelled >13X over SC and <6X over DRG. Chart 3, Liver FXN in NHPs, one category Liver. AAV9 about 4.5x10^5 (error about 2.5x10^5 to 6x10^5), CAP-004 about 3x10^4 (error about 2x10^4 to 4x10^4). A teal bracket labelled >14X joins the two bars. Legend: grey square labelled AAV9 2.5E13 vg/kg with superscript 1, teal square labelled CAP-004 2.5E13 vg/kg. A thin teal horizontal line spans the slide above the footer. The Capsida Biotherapeutics logo, with a teal and blue faceted gem icon, sits at bottom left.
Slide 25
27% Average Transduction of Left Ventricle with CAP-004
Results in >70% Increase in FXN Expression in Heart
Left Ventricle %HA Positive Area in NHPs
Cardiac FXN protein levels increase in NHPs
CAP-004 2.5E13 vg/kg
Untreated
CAP-004 2.5E13 vg/kg
27%
70%
50
40
30
20
10
0
% Area
1000
100
10
1
ng FXN per mg of protein
25
Visuals: Left panel: bar chart titled 'Left Ventricle %HA Positive Area in NHPs'. Y axis '% Area' from 0 to 50 with ticks every 10. One solid teal bar for CAP-004 2.5E13 vg/kg reaching about 27 (label '27%' in bold black above it). Error bar upper cap at about 36. Three black dots at about 38, 34.5 and 7.5. Legend: teal square with 'CAP-004 2.5E13 vg/kg'. Right panel: bar chart titled 'Cardiac FXN protein levels increase in NHPs'. Y axis 'ng FXN per mg of protein', log scale from 1 to 1000 with ticks at 1, 10, 100, 1000. Two bars: Untreated is white with teal outline, height about 60; CAP-004 2.5E13 vg/kg is solid teal, height about 100. Black dots: one at about 60 on the untreated bar, three on the CAP-004 bar at about 130, 110 and 65. Small error bar cap on the teal bar at about 120. A black bracket joins the two bars, with '70%' in bold black above it. Legend: white square with teal outline 'Untreated' and teal square 'CAP-004 2.5E13 vg/kg'. Thin teal horizontal line at the bottom. Capsida Biotherapeutics logo (small teal text with a green-teal geometric polyhedron icon) at bottom left.
Slide 26
Platform and Capabilities
Visuals: A 3D medical-style illustration of a male figure in profile, facing right, torso cropped at the bottom edge. The body is rendered as a translucent steel-blue (#3A5578) shape with visible internal organs: a green-grey brain (#5B7F78) in the head, heart, lungs, kidneys and blood vessels in lighter blue. Dark grey glossy spheres form clusters of protein or molecular structures that float behind the shoulder and head at the upper left, with a few chains of beads. The figure fades into the pale background with soft edges. A thin light-blue line (#A9CBEE, about 1px) runs horizontally at y≈80% from x≈38% to the right edge. No logos.
Slide 27
Capsida – Uniquely Positioned to Lead Gene Therapy
Capsid Engineering Scale
Fully industrialized and / roboticized platform
Screening capabilities across cell / types in NHPs and human cells
CNS Tropism
>99% specific to neurons
>70% neurons transduced
Broad IP capsids and / capsid/cargo
Peripheral Detargeting
>16x liver & >50x DRG detargeted
Superior off-target safety profile
Broad IP protecting detargeting
Therapeutic Expression
Expression in NHPs with / potential for full disease / correction
Industry leading expression / levels across pipeline programs
Clinical Translatability
Identified/patented novel human / receptor with complete homology / in NHPs and humans
Validated expression in NHPs / including primates >20 years old
Manufacturability
In-house process development / and GMP manufacturing
Productivity surpassing AAV9
Quality specifications > FDA / requirements
Only Capsida has created all the capabilities and results needed to / deliver on the promise of gene therapy
27
Visuals: Six cards: each has a header with rounded top corners filled with a horizontal gradient from blue (#0088BB) on the left to teal-green (#00AA9E) on the right, and a white body with a 1px teal outline. Thin light-gray divider lines separate statements within each card. A wide rounded-rectangle banner with the same blue-to-teal gradient spans the lower part. A thin teal horizontal line spans the full slide width above the footer. The Capsida Biotherapeutics logo (blue 'CAPSIDA' wordmark with a small teal and green hexagonal/geometric mark with script text) is at the bottom left.
Slide 28
In-house Process & Analytical Development and cGMP Manufacturing
Enables Capsida to control quality, timelines, and costs
Vector
Production
Rapid production of engineered capsids for preclinical studies
Process &
Analytical
Development
Conduct manufacturability assessment in HEK293 suspension process
Up to 50 L bioreactor scale
Develop and optimize key analytical assays
cGMP
Manufacturing
15,000 ft2 cGMP Manufacturing Facility
Leverages single use systems
200L bioreactor scale with ability to significantly expand capacity
Finish – fill operations
Unidirectional flow
In-house QC capabilities for product release
Modular clean rooms
Excellent yields and quality specifications at or above FDA standards
28
Visuals: Three small photographs in the middle column. Top: a woman in a blue lab coat working at a benchtop centrifuge in a lab with shelves. Middle: a man in a blue lab coat working beside a red bioreactor/incubator unit in a lab. Bottom: two people in white cleanroom suits, hoods and green gloves working at a stainless steel bioreactor in a cleanroom. Thin teal horizontal divider lines at about y 33.5%, 53.5% and 81%. Light gray thin lines between bullet rows. A rounded rectangle banner with blue-to-green horizontal gradient. A thin teal footer line across the full width. Capsida Biotherapeutics logo at bottom left (blue wordmark with teal leaf/triangle icon).
Slide 29
Corporate & Finance
Visuals: Rendered 3D translucent human torso in profile facing right, in steel blue (#2F4A6E) with a visible green-grey brain (#5F8B80) in the head, heart, lungs, kidneys and vessels showing through the body. The figure is cropped at the waist and the left arm is cut off at the slide edge. Behind the head and shoulders, clusters of grey-black glossy spheres form molecular or protein strands, rising diagonally from the shoulder to the top edge of the slide. They are lit softly, with a white fade on the left. A thin light-blue horizontal line (#A9CBEF, about 1px) extends from the figure's torso to the right edge.
Slide 30
Leadership Team and Board of Directors
Decades of Industry Experience and Drug Development Expertise
Leadership
Board Members
Peter Anastasiou
Chief Executive Officer
Nicholas Flytzanis,
PhD
Founder, Chief Research
and Innovation Officer
Swati Tole, MD
Chief Medical
Officer
Clare Ozawa,
PhD
Beth Seidenberg,
MD
Viviana Gradinaru,
PhD
Founder
Julie Hakim
Chief Financial Officer
Bethany Mancilla
Chief Business Officer
Rob Murphy
Chief Manufacturing
and Quality Officer
Rita Balice-Gordon,
PhD
CEO, Muna Tx
Frank Verwiel,
MD
Chairman, Intellia
Peter Anastasiou
Chief Executive Officer
30
Visuals: Two horizontal pill-shaped gradient banners (Leadership: teal-blue #0088B8 to green-teal #00A79D; Board Members: darker blue #2060A0 to light blue #0088C0). Twelve rounded-corner square portrait photos on light grey #F2F2F2 backgrounds, each a professional headshot of a person from the chest up, on a neutral grey backdrop. Leadership row 1: bald smiling man in grey blazer and light blue shirt; bearded dark-haired man in dark jacket; smiling woman with long black hair, dark navy top. Leadership row 2: woman with short blond hair and green top; woman with long grey-blonde hair in light blue top; older man with dark grey hair in navy jacket and light blue shirt. Board row 1: woman with black bob hair; woman with long wavy brown-grey hair in black top; woman with brown shoulder-length hair in cream top. Board row 2: woman with dark brown hair in cream top; man in dark suit and white shirt with short hair; bald smiling man in grey blazer. Small white rounded-rectangle logo chips with thin grey border beneath each person: Peter Anastasiou (CEO): Lundbeck with red starfish, Lilly script logo. Nicholas Flytzanis: Caltech. Swati Tole: Genentech. Clare Ozawa: Versant Ventures, Novartis. Beth Seidenberg: Westlake BioPartners, Kleiner Perkins. Viviana Gradinaru: Caltech. Julie Hakim: Lundbeck, Sequoia Vaccines. Bethany Mancilla: Amgen, Micromet. Rob Murphy: Amgen. Rita Balice-Gordon: Muna Therapeutics, Sanofi. Frank Verwiel: Avexis, Intellia Therapeutics. Peter Anastasiou (second): Lundbeck, Lilly. Thin teal horizontal line near the bottom; Capsida Biotherapeutics logo with teal-green geometric mark at bottom left.
Slide 31
>$300M Funding to Date
2019
2021
2023
2025
$50M Series A
CNS $90M
CNS $55M
Ophthalmology $70M
Contract manufacturing
$12M convertible note
AbbVie opt-in ($40M)
Potential additional milestones
Series B (TBD)
31
Visuals: Four gradient pill labels (blue to teal; the 2025 pill is a darker blue) on a thin teal horizontal line. White rounded-corner logo cards with light grey borders. 2019 column: Versant Ventures logo (grey-teal V mark with VERSANT ventures wordmark), Westlake BioPartners logo (blue wave mark with blue text). 2021 column: AbbVie logo (navy lowercase wordmark). 2023 column: Lilly logo (red script), AbbVie logo, KATE Therapeutics logo (green and grey chevron mark, dark KATE lettering, 'A Novartis Company' tagline), NEURO.VC logo (dark navy bold condensed text with a small box). 2025 column, inside a pale blue rounded rectangle with a teal outline: AbbVie logo, a second AbbVie logo, Lilly logo, and Capsida Biotherapeutics logo (blue CAPSIDA text with teal and green geometric mark). A small Capsida logo sits bottom-left in the footer. A thin teal line spans the full width above the footer.
Slide 32
Next-generation Genetic Medicines Company
Unlocking the full potential of gene therapy for all
Wholly-owned Pipeline
Fully-integrated Capabilities
External Validation
Two clinical programs in 2025
CAP-002: STXBP1-DEE
IND clearance
ODD granted
Fast Track granted
CAP-003: PD-GBA
IND clearance
Human POC in Q4
Third clinical program in 2026
CAP-004: Friedreich’s ataxia
» Capsid engineering
» Cargo optimization
» Clinical development
» In-house manufacturing
» Protected by expansive IP portfolio
Strategic partnerships
abbvie » 1st AbbVie opt-in ($40M) achieved
Contract manufacturing
>$300M funding to date, including $50M Series A
32
Visuals: Three column cards with a thin teal outline and a blue-to-teal gradient header band. Left column holds three rounded pill shapes: blue (CAP-002) with three white check-circle icons, green (CAP-003) with one check-circle icon and a white bullet, and teal (CAP-004). Middle column has » chevron bullets. Right column has logo boxes with thin light-grey rounded borders: abbvie wordmark in dark blue with a » chevron beside it, Lilly red script logo, CRISPR Therapeutics black-framed logo, KATE Therapeutics (a Novartis company) logo with green/grey chevron mark. Bottom: Versant Ventures logo (teal V mark and grey text) and Westlake BioPartners logo (dark blue W mark, blue text) in white rounded boxes overlapping the right end of the grey bar. Thin teal horizontal line above the footer. Small Capsida Biotherapeutics logo bottom left.
Slide 33
Our Pipeline is Making the
Impossible Possible
1300 Rancho Conejo Blvd
Thousand Oaks, California
www.capsida.com
Visuals: Capsida Biotherapeutics logo at top left: 'CAPSIDA' in blue outlined geometric capitals, 'BIOTHERAPEUTICS' in grey letter-spaced capitals below it, and a blue-to-green faceted polyhedron/capsid shape with a small teal DNA strand curling over it. A large DNA double helix made of grey-blue dots (about #8FA9B8) spans the right 56% of the slide, running diagonally from top centre to bottom right, cropped at the edges. A thin light grey horizontal line runs across the lower left at about 70% of the slide height, ending at about 71% of the width. Three thin black outline icons: an envelope beside the email, a map pin beside the address, and a browser window with cursor beside the website.
Download this deck
The hosted PDF of every library deck is free for readers of the SlideDeck Co newsletter. Join with your email and the viewer and download appear here.
Preparing a results presentation or business update of your own? The SlideDeck Co Standard Deck is a slide library for business reviews, updates and plans.







