

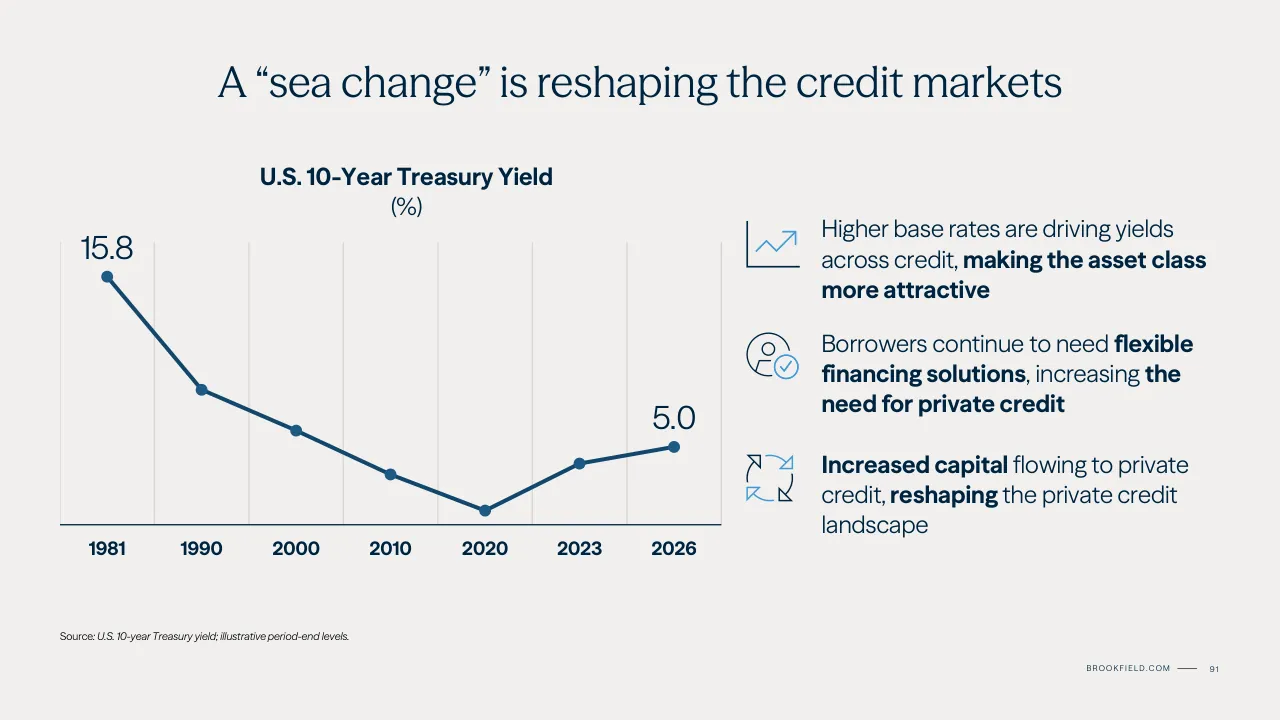
The deck is an investor day presentation from Brookfield Asset Management, dated to mid-2026 based on data as of June 30, 2026. It opens with a title slide and an agenda listing speakers including the CEO, CFO, and the Co-CEO of Credit, followed by a section titled The Brookfield Advantage. The middle sections cover the firm's business mix across five groups, its consistency of performance, its positioning for future trends, and its growth model. The CFO section explains the company's structure and projects fee-bearing capital, fee-related earnings and distributable earnings through 2031. A credit section then covers the platform after the Oaktree integration, the market environment, and the main growth areas. The deck closes with key takeaways, a CEO panel slide, and endnotes and notices. Worth studying: slide 4, which packs headline capital figures for each business group into one view; slide 24, a table comparing target and actual returns across strategies; slide 46, a bar chart with a record-year callout; and slide 91, which uses a simple Treasury yield line to frame the credit market shift.
Slides worth studying
Questions about this deck
What does the Brookfield Asset Management investor day deck say about fee-bearing capital?
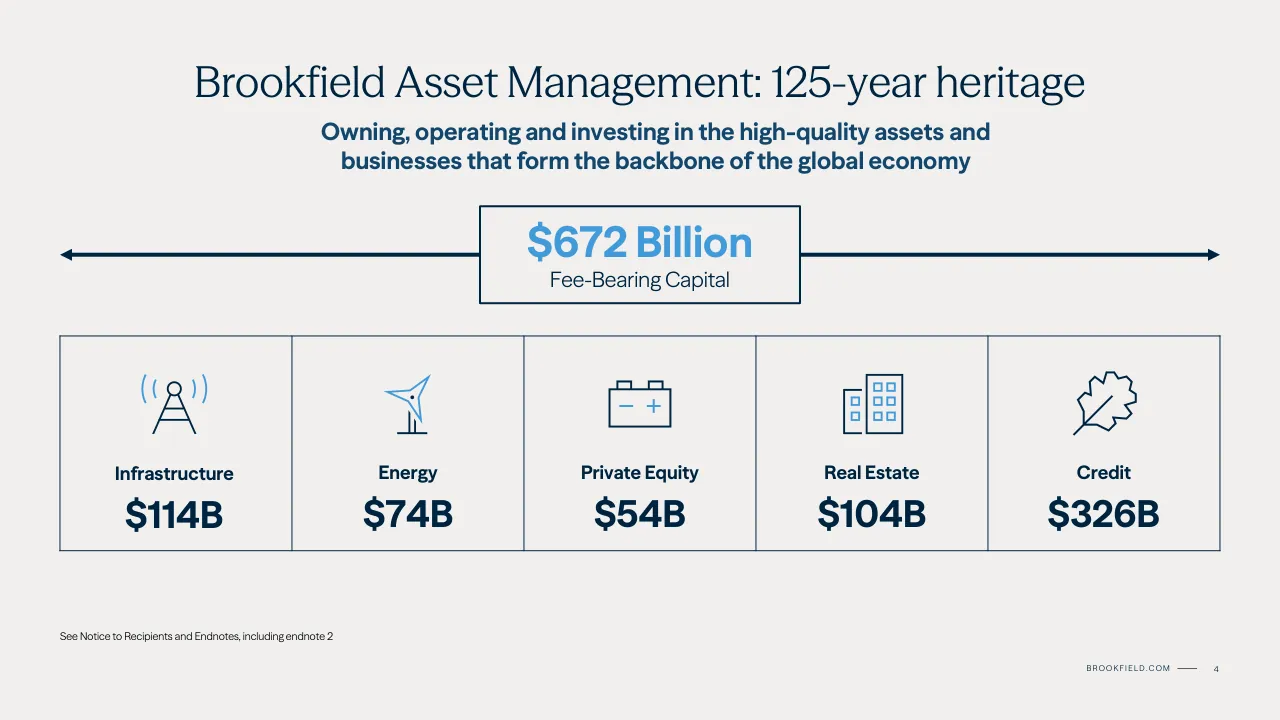
Slide 4 shows $672 Billion in Fee-Bearing Capital, split as Infrastructure $114B, Energy $74B, Private Equity $54B, Real Estate $104B and Credit $326B.
How much fundraising does the Brookfield Asset Management investor day deck report?
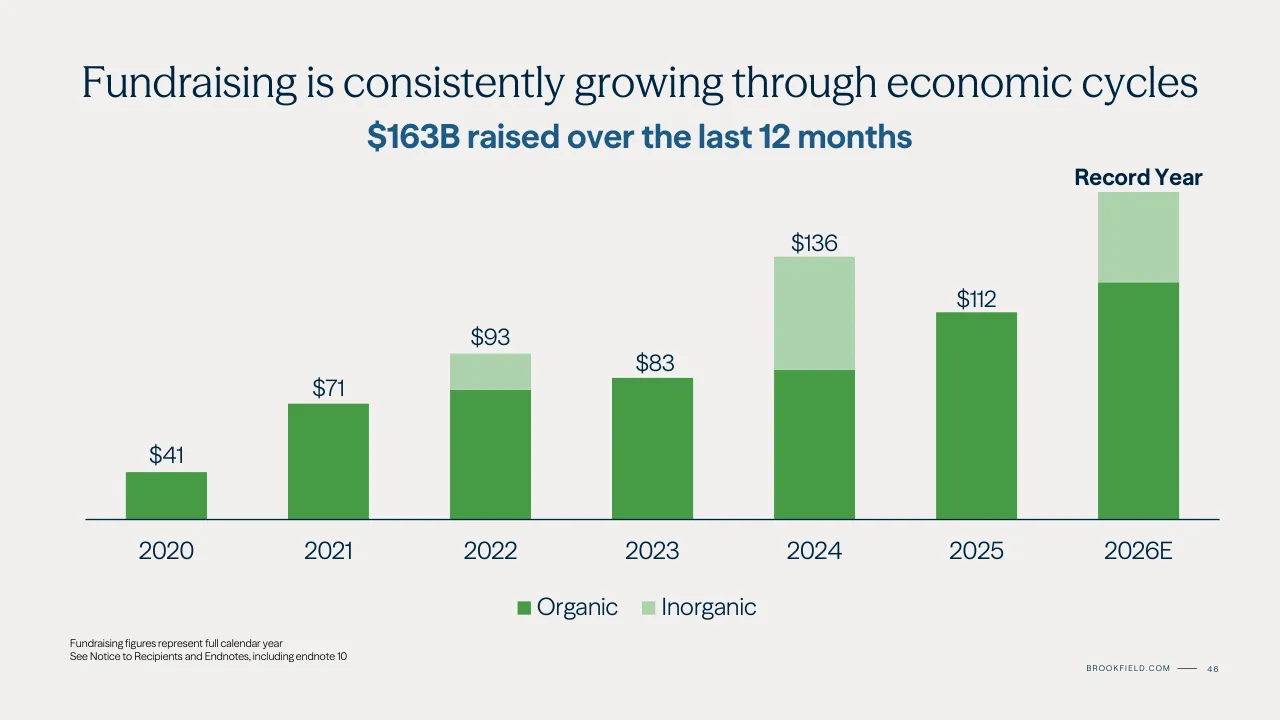
Slide 6 shows Fundraising of $97 for Q2 '25 LTM and $163 for Q2 '26 LTM, a +70% change. Slide 46 states $163B raised over the last 12 months and labels a Record Year.
What returns does the Brookfield Asset Management investor day deck show for its strategies?
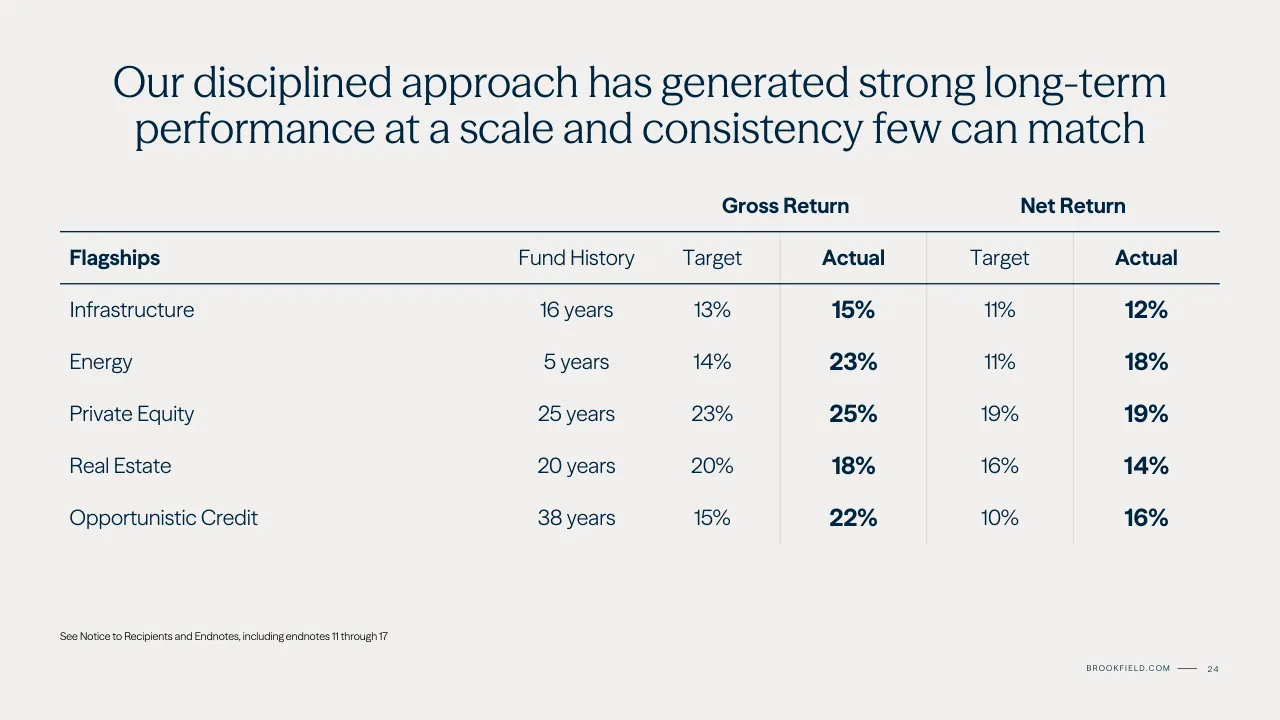
Slide 24 compares target and actual returns, and for Infrastructure (16 years) it shows a gross target of 13% against an actual of 15%, and a net target of 11% against an actual of 12%.
How many slides does the Brookfield Asset Management investor day deck have and how is it organized?
The deck has 114 pages. Slide 2 lists the agenda, with Connor Teskey as CEO at 12:50 PM, Hadley Peer Marshall as CFO at 1:10 PM and Bob O'Leary as Co-CEO of Credit at 1:35 PM.
Details
- Company: Brookfield Asset Management
- Year: 2026
- Type: Investor presentation
- Industry: Asset Management
- Pages: 114
Review score: 7 out of 10, Effective
Presentation quality, judged with the SlideDeck Co review heuristic. Ask, evidence and idea merit are not rated here.
The deck has a clear route: agenda, section dividers, a three-part framing (diversified, consistent, positioned for the future) that is restated in takeaways on slides 37 and 71, and a CFO section that builds from fee-bearing capital to fee-related earnings to distributable earnings in slides 62 to 67. Individual pages are clean and legible, with strong hierarchy on slides 4, 24 and 46, consistent navy and green identity, and a sensible sentence-style title chain. Weaknesses are consequential: many pages are near-empty dividers or three-icon placeholders (slides 8, 9, 18, 30, 31, 36, 45, 50, 55, 61), the sunburst on slides 14 to 16 shrinks to unreadable text, and footnotes and the page footer are tiny. Some charts have an uneven axis or crowded labelling (slide 47 has two scales sharing one chart, slide 26 has very small labels), which leaves a competent but not exceptional deck.
Worth keeping: Keep the slide 4 headline-number layout, the slide 24 table with bolded actuals, the slide 46 stacked bars with a record callout, and the CFO bridge from capital to earnings to dividend on slides 62 to 68.
Most useful repair: Enlarge or simplify the sunburst on slides 15 and 16 and the sub-sector labels, and fold the near-empty divider and icon-only pages into content slides that carry a claim.
What would change the score: I would cut the repeated dividers and the 'Increasingly diversified' echo on slides 8 and 9, and raise the footnote and chart label sizes so small text on slides 26, 47 and 60 is readable.
Confidence medium. 72 of 114 pages inspected on contact sheets, 4 at readable size. Reviewed 2026-11-08. Model-assisted review (claude-sonnet-5-5).
Full text of the slides (114 slides)
Every slide's words and a description of its charts and images, so the deck can be searched and rebuilt. Also available as Markdown.
Slide 1
Brookfield
Brookfield Asset
Management
Investor
Day 2026
Visuals: One photograph, full-bleed in the right column (x 64.2%, y 0%, w 35.8%, h 100%, 788 by 1238 pixels). It shows a tall glass-and-steel office tower photographed from street level looking steeply upward. Its facade bands of horizontal window rows and vertical mullions converge toward the top left, and a curved edge sweeps across the frame. The sky at upper right is pale blue. Lighting is soft daylight, and the glass reflects a cool blue sky. Dominant colours are slate blue-grey, deep navy and pale sky blue. The image is cropped at the top, bottom and right edges and is not boxed. There is no overlay or tint. One short horizontal accent bar in bright blue sits above the event label, a graphic rule rather than a picture.
Slide 2
12:50 PM
The Brookfield Advantage
Connor Teskey, CEO
1:10 PM
Designed for Durability,
Positioned for Growth
Hadley Peer Marshall, CFO
1:35 PM
One Scaled Global
Credit Leader
Bob O’Leary, Co-CEO of Credit
1:55 PM
View from the Top: A Conversation
with Brookfield’s CEOs
Moderated by Bruce Flatt, Chairman
2:35 PM
Q&A
Visuals: none (no photographs, charts or icons; only thin white vertical rule lines beside each agenda block, listed under elements).
Slide 3
The Brookfield Advantage
Connor Teskey
CEO
Slide 4
Brookfield Asset Management: 125-year heritage / Owning, operating and investing in the high-quality assets and / businesses that form the backbone of the global economy / $672 Billion / Fee-Bearing Capital / Infrastructure / $114B / Energy / $74B / Private Equity / $54B / Real Estate / $104B / Credit / $326B / See Notice to Recipients and Endnotes, including endnote 2 / BROOKFIELD.COM / 4
Visuals: Five outline line icons, each in a grid cell, drawn with about 2px navy and blue strokes on the off-white background. (1) Infrastructure: a radio or transmission tower, navy lattice tower with a circle at the top and three horizontal crossbars, flanked by blue signal arcs on both sides. (2) Energy: a wind turbine, navy pole with a navy base line and a three-blade rotor in blue with a navy hub dot. (3) Private Equity: a battery, a navy rectangle outline with two terminal nubs on top, a navy minus sign and a blue plus sign inside. (4) Real Estate: a building cluster, a tall navy-outlined tower with a blue grid of six square windows, and a shorter navy-outlined block to its left with a column of three small blue square windows. (5) Credit: a leaf, a navy-outlined serrated leaf with a diagonal navy stem line running from lower-left to the centre. Also a horizontal double-headed arrow: a navy line about 0.5% of slide height thick running from left to right, with solid navy triangular arrowheads at both ends, interrupted by the headline box in the centre. Grid: a thin navy (#002540) rectangular outline with 1px vertical dividers separating five equal cells.
Slide 5
Consistent execution delivering strong performance and continued growth / Deployment / FBC / FRE / Monetization / $ 76 B / 19 % / 19 % / $ 47 B / Capital invested LTM / YoY growth / YoY growth / Proceeds / generated LTM / See Notice to Recipients and Endnotes, including endnotes 2, 4, and 18 / BROOKFIELD.COM / 5
Visuals: No photographs, charts, logos or icons. Four identical rectangles with no fill and a thin light-grey outline (about #D4D4D4, about 1 px at slide scale, square corners, no shadow) frame the four stat blocks: Deployment box, FBC box, FRE box and Monetization box. Each box holds a large bold figure in blue #419AD9 with a smaller unit mark: $76B (Deployment), 19% (FBC), 19% (FRE), $47B (Monetization). Beneath each figure is a dark-navy caption: Capital invested LTM, YoY growth, YoY growth, Proceeds generated LTM. A short dark-navy horizontal rule sits to the left of the page number in the footer.
Slide 6
Record fundraising highlights the momentum…
Fundraising ($B)
$163
$97
+70%
Q2 '25 LTM
Q2 '26 LTM
BROOKFIELD.COM
6
Visuals: Bar chart titled 'Fundraising ($B)' with two bars. Bar 1 labelled Q2 '25 LTM, value $97 printed above it, green fill #489B48, spanning about 19.7% to 34.7% of slide width and rising from baseline at about 70% of height to top at 50.2%. Bar 2 labelled Q2 '26 LTM, value $163 printed above it in bold, dark blue fill #14486E, spanning about 64.9% to 79.9% of width and top at 36.8%. Baseline is a thin dark navy line #002540 running across the full chart width at about 69.9% of height. No y-axis, no gridlines, no numeric axis range printed; bar heights are proportional to values. A light grey arrow (#D9D7D1, about 0.5% of height thick) runs from the top of bar 1 up to the top of bar 2 with an arrowhead pointing at bar 2. A grey circle #D9D7D1 sits on the arrow midpoint, about 9.3% wide and 16.6% tall, containing the bold text +70% in dark navy. No legend.
Slide 7
And our business hit new records across the board
Infrastructure
Energy
Private Equity
Real Estate
Credit
On track to have the world’s largest fund
Record development and monetization
Expected to be our largest flagship fund yet
$40B+ deployed,
a new record
Integrated Oaktree into Brookfield Credit
See Notice to Recipients and Endnotes, including endnote 19
BROOKFIELD.COM
7
Visuals: Five single-weight line icons, one per column, all drawn in navy #002540 with blue #3E9AD6 accents. (1) Infrastructure: a navy lattice radio tower with a small circle at the top, flanked by two pairs of blue signal arcs on either side. (2) Energy: a navy vertical mast on a short base, with a blue three-bladed wind turbine head shaped like a pinwheel. (3) Private Equity: a navy outlined battery with two small terminal tabs on top, with a blue minus sign and a blue plus sign inside the body. (4) Real Estate: a navy outlined tall building with a grid of blue-outlined square windows (3 by 3), beside a shorter navy outlined annex with two blue square windows in one column. (5) Credit: a navy outline of an oak leaf with a diagonal midrib line running from the lower left to the upper right. Icons are centred in their columns and are about 9% of slide height tall. The icons are not cropped and have no overlay. A thin navy rectangular frame with 1 px lines and sharp corners encloses the five columns, and thin navy vertical rules divide them.
Slide 8
Ongoing drivers of BAM’s growth and resiliency / Increasingly diversified / Consistency of performance / Positioned for the future / BROOKFIELD.COM / 8
Visuals: Three line icons in dark navy, each centred in its column above the label. Left: three overlapping outline circles (Venn-style, two at bottom and one at top) in navy #002540. Middle: a trophy/cup outline with a shield-shaped bowl, a small five-point star inside the bowl drawn in bright blue (about #3A9AD9), a stem and a flat base, all in navy with the star in blue. Right: a rosette/award badge outline with a scalloped edge, a circle in its centre drawn in bright blue (about #3A9AD9), and two ribbon tails below in navy. Icons are stroked, no fill, roughly 2.5% of slide height tall. A thin grey rule (about #D0CFCC, 0.1% width) forms the cell borders and a short dark rule sits beside the footer text.
Slide 9
Increasingly diversified / BROOKFIELD.COM / 9
Visuals: One icon: a Venn-style mark of three overlapping outline circles in white, stroke about 0.3% of slide width. The top circle is centred above the other two, which sit side by side and overlap each other and the top circle, forming three interlocking rings. Centred horizontally at about x 47.2 to 52.9%, y 28.8 to 38.4%. Thin white horizontal rule (about 3% of slide width) in the footer between the URL and the page number, at about y 92.9%. No photographs, charts or other graphics.
Slide 10
Our capabilities continue to drive incremental growth
Strong long-term performance
Grow existing strategies & launch new products
More diversification
Enduring competitive advantages
Greater market reach / information
BROOKFIELD.COM
10
Visuals: Diagram: a circular cycle of five curved block arrows, drawn clockwise, forming one continuous ring with arrowheads at the joins. Starting at the top and moving clockwise: a light grey arc (#D9D7D1) at top-left, ending in an arrowhead pointing right at the top; a pale green arc (#ADD2AD) at top-right, with an arrowhead pointing down-right; a dark green arc (#237239) at right, with an arrowhead pointing down-left; a bright green arc (#26A049) at bottom, with an arrowhead pointing left; and a navy arc (#002F4A) at left, with an arrowhead pointing up-right into the grey arc. The ring has a hollow centre with no content. Each arc is a solid filled block arrow with no outline. Five line icons, each in dark navy (#002540) stroke about 1 pt wide, sit beside their labels: a brick wall icon (top-left, beside 'Strong long-term performance'), a network icon of a central circle with four squares joined by lines (top-right, beside 'Grow existing strategies & launch new products'), a globe showing continents (right, beside 'More diversification'), a trophy cup with a star in light blue (#4A9FD8) (left, beside 'Enduring competitive advantages'), and two standing figures with a double-headed light blue arrow between them (bottom, above 'Greater market reach / information').
Slide 11
Deeper relationships and broader client base
Flagship Infrastructure
BIF V
80%
Re-ups
Infrastructure Debt
BID III
58%
Crossover
from BIF
Long-Dated Infrastructure
BSIP
60%
New to Brookfield
Sovereign Wealth Fund
Public & Private Pension
Insurance
Endowment / Foundation
Other
BROOKFIELD.COM
11
Visuals: Three donut charts, each with a 'hole' of about 55% of its outer diameter, containing a large percentage and a caption. Chart 1, Flagship Infrastructure (BIF V): centre reads '80%' over 'Re-ups'. Segments clockwise from 12 o'clock: Sovereign Wealth Fund #1D5A85 about 40%; Public & Private Pension #489B48 about 33%; Insurance #5F265F about 14%; Endowment / Foundation #BBA5BF about 5%; Other #ADD2AD about 8%. No values are printed on segments. Chart 2, Infrastructure Debt (BID III): centre reads '58%' over 'Crossover / from BIF'. Segments clockwise from 12 o'clock: Sovereign Wealth Fund #1D5A85 about 28%; Public & Private Pension #489B48 about 27%; Insurance #5F265F about 41%; Endowment / Foundation #BBA5BF about 1%; Other #ADD2AD about 3%. No values are printed on segments. Chart 3, Long-Dated Infrastructure (BSIP): centre reads '60%' over 'New to / Brookfield'. Segments clockwise from 12 o'clock: Sovereign Wealth Fund #1D5A85 about 7%; Public & Private Pension #489B48 about 56%; Insurance #5F265F about 13%; Endowment / Foundation #BBA5BF about 16%; Other #ADD2AD about 8%. No values are printed on segments. Legend: five square swatches with labels, in order Sovereign Wealth Fund (#1D5A85), Public & Private Pension (#489B48), Insurance (#5F265F), Endowment / Foundation (#BBA5BF), Other (#ADD2AD). No highlighted points. Segments have flat fills with no outlines, no shadows and no gradients.
Slide 12
Having more clients reduces dependence on
any one capital source
2016
2026
2,500+
Clients
320+
Clients
Sovereign Wealth Fund
Public & Private Pension
Insurance
Endowment / Foundation
Other (Financial, Family Office,
Unions, & Corporates)
1.9x
strategies per client
2.6x
strategies per client
See Notice to Recipients and Endnotes, including endnote 22
BROOKFIELD.COM
12
Visuals: Two donut charts and one arrow. Chart 1 (left, labelled 2016): donut with centre text 320+ over Clients, about 1.9x strategies per client in a grey box below. Segments clockwise from 12 o'clock: Sovereign Wealth Fund blue about 4%, Public & Private Pension green about 50%, Insurance purple about 12%, Endowment / Foundation mauve about 16%, Other light green about 17% (all segment values are estimates, no values printed). Chart 2 (right, labelled 2026): donut with centre text 2,500+ over Clients, 2.6x strategies per client in a grey box below. Segments clockwise from 12 o'clock: Sovereign Wealth Fund blue about 3%, Public & Private Pension green about 28%, Insurance purple about 10%, Endowment / Foundation mauve about 23%, Other light green about 36% (estimates, no values printed). Both donuts have a hole about 50% of the outer diameter, no gaps between segments, no outlines. Legend (centre): five entries, each a filled square swatch followed by label: blue #1F5C8A Sovereign Wealth Fund; green #489B48 Public & Private Pension; purple #5F265F Insurance; mauve #BFA8BF Endowment / Foundation; light green #ADD2AD Other (Financial, Family Office, Unions, & Corporates). Arrow: a navy #002540 horizontal line about 0.4% thick with a solid triangular arrowhead pointing right, running from about x 38.5% to x 61.5% at about 42% height, placed above the legend and between the two donuts. No photographs, logos or icons. Highlighted points: none.
Slide 13
Global reach minimizes exposure to any one cycle
Capital Base by Geography
2020
2023
2026
+20%
vs 2020
+43%
vs 2023
North America
Europe
APAC
Middle East
See Notice to Recipients and Endnotes, including endnotes 23
BROOKFIELD.COM
13
Visuals: Three donut charts, each with a navy North America segment, a green Europe segment, a light green APAC segment and a lilac Middle East segment, all drawn from 12 o'clock clockwise. Chart titles are the years 2020, 2023 and 2026 above each donut. No numeric values or axes are printed; segment shares are not labelled. Estimated shares read from the image: 2020 about 45 percent North America, about 10 percent Europe, about 30 percent APAC, about 12 percent Middle East; 2023 about 35 percent North America, about 10 percent Europe, about 35 percent APAC, about 20 percent Middle East; 2026 about 60 percent North America, about 12 percent Europe, about 20 percent APAC, about 8 percent Middle East. Centre labels: 2023 donut reads '+20%' over 'vs 2020'; 2026 donut reads '+43%' over 'vs 2023'. The 2020 donut has no centre label. Scale: the 2020 donut is about 13.8 percent wide, the 2023 donut about 16.9 percent, and the 2026 donut about 22.5 percent, so size encodes the year's capital base. Legend below the charts: navy-blue square 'North America', green square 'Europe', light green square 'APAC', lilac square 'Middle East'. Two navy chevrons (stroke #002540, about 0.9 percent of slide height thick, round-capped, no fill) sit between the donuts as a progression arrow. No photographs, logos or icons.
Slide 14
No one business group represents more than a third of our revenues…
Credit
Infrastructure
Real Estate
Energy
Private Equity
BROOKFIELD.COM
14
Visuals: One donut chart (ring with a hollow centre) divided into five equal-sized segments, drawn as flat fills with no gaps or outlines. Segments clockwise from the top: Infrastructure (dark blue #1D5A85, top-right, from 12 o'clock to about 2 o'clock), Energy (green #489B48, right), Private Equity (pale green #ADD2AD, bottom), Real Estate (dark purple #5F265F, lower-left), Credit (pale mauve #BFA8BF, upper-left). The hole in the centre is filled with the background colour #F2F1EF. Each segment carries a label and a small line icon: Infrastructure has a white transmission tower with signal arcs; Energy has a navy leaf outline; Private Equity has a navy briefcase outline; Real Estate has white outline icons of a house and a multi-window office building; Credit has a navy outline icon of a hand holding a coin. Scattered around the donut, on the background, are loose thin white/light outline icons, not connected to the chart: a delivery truck at about x 54.2-56.5%, y 30.8-34.2%; a cardboard box or sofa-like object at about x 57.2-59.4%, y 34.7-38.0%; a briefcase-like or safe-like icon at about x 36.7-38.7%, y 47.7-50.8%; an office building outline at about x 36.6-38.4%, y 54.4-57.8%; and a cluster of two buildings at about x 37.8-39.7%, y 60.7-64.0%. The outline icons are white at very low contrast against the pale background. No photographs. No chart axes, legend or values are printed.
Slide 15
…and we have capabilities across every major sub-sector…
Utilities
Transport
Midstream
Data
Hydro
Solar
Wind
Other Energy Solutions
Infrastructure Services
Industrials
Business Services
Technology Services
Housing
Commercial
Hospitality
Retail
Asset-Backed Finance
Real Asset Finance
Opportunistic Credit
Corporate Credit
Infrastructure
Energy
Private Equity
Real Estate
Credit
BROOKFIELD.COM
15
Visuals: One segmented ring chart (a sunburst-style wheel) with two concentric rings around a small empty centre hole. The inner ring has five segments: Credit (light mauve #BFA8BF, with a hand-and-coin style icon), Infrastructure (blue #1D5A85, with a transmission tower icon), Energy (green #489B48, with a leaf icon), Private Equity (pale green #ADD2AD, with a briefcase icon) and Real Estate (purple #5F265F, with a house and office building icon). The outer ring is divided into the same five colour families: blue Infrastructure segments Utilities (pylon icon), Transport (truck icon), Midstream (storage/pipeline icon), Data (cell tower with signal icon); green Energy segments Hydro (water drop icon), Solar (sun/gear icon), Wind (wind turbine icon), Other Energy Solutions (solar panel icon); pale green Private Equity segments Infrastructure Services (gear icon), Industrials (battery icon), Business Services (briefcase icon), Technology Services (wifi signal icon); purple Real Estate segments Housing (house and building icon), Commercial (office building icon), Hospitality (hotel icon), Retail (shopping bag icon); mauve Credit segments Asset-Backed Finance (crane/aircraft icon with a vehicle), Real Asset Finance (house in circle icon), Opportunistic Credit (hand with dollar sign icon), Corporate Credit (briefcase icon). Segment labels run radially, with outer labels rotated to follow the wheel. Each segment is separated by a thin lighter line, and a thick white circular gap separates the inner ring from the outer ring. Icons are thin single-weight line drawings in dark navy or white matching the label colour. No axes, legend or data values.
Slide 16
…and we have capabilities across every major sub-sector… / BROOKFIELD.COM / 16 / Outer ring, Infrastructure: Transportation / Distribution / Rail & Ports / Toll Roads / Pipelines / LNG & Storage / Data Centers / Fiber & Towers / Middle ring, Infrastructure: Utilities / Transport / Midstream / Data / Centre label: Infrastructure / Outer ring, Energy: Run-of-River / Pumped Storage / Utility-Scale Solar / Distributed Solar / Onshore Wind / Offshore Wind / Battery Storage / Nuclear / Middle ring, Energy: Hydro / Solar / Wind / Other Energy Solutions / Centre label: Energy / Outer ring, Private Equity: Data & Analytics / Vertical Software / Outsourced Services / Financial Infrastructure / Heat-Tracing Systems / Low-Voltage Batteries / Fuel Distribution / Social Infrastructure / Middle ring, Private Equity: Technology Services / Business Services / Industrials / Infrastructure Services / Centre label: Private Equity / Outer ring, Real Estate: Multifamily / Student & Senior / Office & Life Science / Logistics & Industrial / Luxury & Resort / Select Service / Regional Malls / Open-Air Retail / Middle ring, Real Estate: Housing / Commercial / Hospitality / Retail / Centre label: Real Estate / Outer ring, Credit: Infrastructure Debt / Real Estate Debt / Equipment Finance / Aviation Finance / Distressed Debt / Special Situations / Direct Lending / High Yield & CLOs / Middle ring, Credit: Corporate Credit / Opportunistic Credit / Real Asset Finance / Asset-Backed Finance / Centre label: Credit
Visuals: Radial sunburst diagram with three concentric rings and five parent sectors. Infrastructure is blue #1D5A85 in the top-right quadrant, running from about 12 o'clock to 3 o'clock. Energy is green #489B48 in the right and lower-right, from about 3 o'clock to 5 o'clock. Private Equity is pale green #ADD2AD along the bottom, from about 5 o'clock to 8 o'clock. Real Estate is plum #5F265F in the left and lower-left, from about 8 o'clock to 10 o'clock. Credit is mauve #BFA8BF in the upper-left, from about 10 o'clock to 12 o'clock. Thin off-white gaps (#F2F1EF, about 0.3% of slide width) separate the sectors and rings. Outline-style icons in dark navy #002540 sit in the middle ring: Infrastructure has a utility tower (Utilities), a truck (Transport), a warehouse or building (Midstream) and a transmission mast (Data). Energy has a water drop (Hydro), a sun or gear (Solar), a leaf (Wind area) and a wind turbine (Wind). Other Energy Solutions has a solar panel icon. Private Equity has a briefcase (Business Services), a wifi-like signal (Technology Services), a battery (Industrials) and a gear (Infrastructure Services). Real Estate has a house (Housing), a building (Commercial), a hotel building (Hospitality) and a shopping bag (Retail). Credit has a briefcase (Corporate Credit), a hand with coins (Opportunistic Credit), a house in a circle (Real Asset Finance) and a cart with containers (Asset-Backed Finance). The centre is a small off-white circle (#F2F1EF) at about x 48%, y 50%, about 4% wide, with the label Credit area at top-left above it. No photographs or charts are present.
Slide 17
Our platforms grow at different points in time, but create
consistent growth on a consolidated basis
Across the
Cycle
Infrastructure
Energy
Real Estate
Pro-Cyclical
Counter Cyclical
BROOKFIELD.COM
17
Visuals: Illustration: a diagram of two sinusoidal waves and one rising arrow on a navy field. Shapes and labels: (1) a grey dashed sine wave labelled 'Pro-Cyclical', about three half-cycles, peaking near x 33% and x 71%, with troughs near x 46% and x 63%; (2) a blue dashed sine wave labelled 'Counter Cyclical', out of phase with the grey wave, troughs near x 32% and x 71%, peaks near x 53% and x 79%; (3) a thick solid green arrow running from lower left (about x 18%, y 64%) to upper right (about x 89%, y 36%) with a filled triangular arrowhead at the upper right, drawn over both waves. The two waves cross each other at about x 42% and x 61% and the arrow crosses them at the same points. No axes, legend or values. Dashes are roughly even, with rounded ends. Full-width, no box, no shadow, no overlay.
Slide 18
Consistency of performance / BROOKFIELD.COM / 18
Visuals: One icon: a white outline trophy cup (line-art, roughly 6.1% of slide width by 9.6% of slide height) with a shield-shaped cup body, two side handles curving outward and downward, a short stem and a flat rectangular base. Inside the cup body is a five-pointed star outline drawn in a medium blue (about #4A90D9) with a stroke of roughly the same weight as the white outline. Stroke weight is thin and uniform. No photograph, chart or diagram. Footer includes a short horizontal white rule (about 2.5% of slide width) between the site name and the page number.
Slide 19
We have a consistent approach to / drive attractive returns by being / leading owners, operators / and originators / BROOKFIELD.COM / 19
Visuals: A short horizontal rule, navy #002540, about 0.25% of slide height thick, sits between the BROOKFIELD.COM footer text and the page number at about x 92.0 to 93.5, y 92.8. No photographs, charts, icons or logos.
Slide 20
Global reach with 250,000 operating employees across 50+ countries
North America
110K
Operating employees
Europe & Middle East
65K
Operating employees
Asia Pacific
40K
Operating employees
South America
34K
Operating employees
Brookfield office
See Notice to Recipients and Endnotes, including endnote 24
BROOKFIELD.COM
20
Visuals: Illustration: a light grey world map in flat silhouette, showing all continents, with Greenland, Alaska, Canada, the USA, Mexico, Central and South America, Europe, Africa, the Middle East, Russia, India, China, Japan, South-East Asia, Australia and New Zealand. The map is filled #D9D7D1 at 50% opacity over the #F2F1EF background, with no outlines, and it extends from roughly 3% to 94% of the width. Four large circles, each filled #14486E at 60% opacity (rendering as a muted slate blue), each carry a region name, a figure and the words Operating employees in white: North America 110K (circle at x5.5 y21.0, 13.2 by 23.4% of the slide), Europe & Middle East 65K (x53.1 y28.6), Asia Pacific 40K (x79.7 y55.2), South America 34K (x16.9 y64.3). The circles are unshaded and sit over the map and the title's lower edge. Office markers: about 31 solid dark navy (#0B3A66-ish, fill close to #14486E) dots, each about 1.2% of the slide width in diameter with a thin white outline. Approximate positions as % of slide width and height: Scandinavia (49.5, 34.3); UK (42.3, 41.0) and (44.3, 41.0); continental Europe (46.4, 42.5), (47.6, 43.3), (45.9, 44.9), (47.3, 44.9), (47.2, 46.7), (44.3, 50.2); North America (18.2, 41.7), (26.6, 48.9), (24.9, 51.1), (28.4, 50.0), (29.1, 49.6), (28.4, 51.3), (23.0, 53.9), (23.6, 55.3), (16.2, 52.1), (16.6, 52.8); South America (29.1, 68.2), (38.2, 79.1), (29.7, 92.0); Middle East (57.5, 61.1), (60.0, 60.0); India (64.6, 60.0), (65.1, 62.7), (66.0, 64.2); South-East Asia (72.9, 71.4); China and Japan (76.2, 51.3), (79.3, 52.7), (82.3, 52.9), (77.1, 55.1), (76.2, 59.6); Australia (85.8, 87.6). Legend: a rectangular box with a thin mid-grey border (about #A8A8A8, 0.1% stroke) and no fill or a fill matching the background, containing a navy dot and the words Brookfield office. The footer carries a short horizontal dash line (about 1.5% of the width, navy #002540, thin stroke) between the website and the page number. Nothing is cropped; the slide is not a photograph.
Slide 21
The Brookfield Ecosystem creates proprietary insight
And enables us to be one step ahead of the broader market
Hospitality
Mixed use, retail
& entertainment
Solar
Business
services
Housing
Logistics &
self-storage
Energy
transition
Data
Transport
Infrastructure
services
Brookfield
Office
Utilities
Midstream
Technology
services
Wind
Hydro
Industrials
Healthcare
Science &
innovation
BROOKFIELD.COM
21
Visuals: Network diagram over a faded grey world map. Central node: a large dark navy filled circle labelled 'Brookfield' in white bold type. Surrounding nodes are white circles with thin navy line icons and a navy label beneath each, connected to the centre and to each other by thin navy straight lines. Nodes, with icon and label: Hospitality (a multi-storey building with windows and an arched entrance); Mixed use, retail & entertainment (a shopfront with an awning); Solar (a sun-burst gear shape with a central circle, representing solar); Business services (a briefcase); Housing (a house with a small building beside it); Logistics & self-storage (a warehouse with a roller door); Energy transition (a solar panel on a stand); Data (a telecom tower with signal arcs); Transport (a lorry/truck with speed lines); Infrastructure services (a cog gear); Office (a city office building with windows); Utilities (a power pylon); Midstream (a pipeline valve on a pipe); Wind (a wind turbine); Technology services (a server or cabinet icon with a window); Science & innovation (a domed building with columns); Industrials (a battery icon with minus and plus signs); Healthcare (a hospital building with a cross sign); Hydro (a water drop with a wave). Connectors: Hospitality-Business services; Hospitality-Housing; Business services-Housing; Business services-Transport; Business services-Infrastructure services; Mixed use-Housing; Mixed use-Logistics; Housing-Brookfield; Logistics-Brookfield; Logistics-Solar; Logistics-Data; Solar-Energy transition; Energy transition-Data; Energy transition-Utilities; Data-Office; Data-Utilities; Brookfield-Infrastructure services; Brookfield-Wind; Brookfield-Science & innovation; Brookfield-Technology services; Brookfield-Midstream-area via Wind line; Transport-Midstream; Transport-Industrials; Midstream-Industrials; Industrials-Wind; Wind-Science & innovation; Science & innovation-Technology services; Technology services-Office; Technology services-Healthcare; Office-Healthcare; Utilities-Healthcare; Utilities-Hydro; Hydro-Healthcare; Infrastructure services-Wind. Lighting: flat, no shadows. Dominant colours: navy #002540, white, light grey. Not cropped; the map runs off the edges of the slide.
Slide 22
Our origination advantage feeds strategies across Brookfield
Flagships
Insurance capital
Equity strategies
Credit strategies
Sector focused
Geographic focused
Partner managers
Public affiliates
BROOKFIELD.COM
22
Visuals: Eight minimal line icons, one per grid cell, drawn in navy #002540 with light-blue #3B9BDB accents. Row 1: (1) a shield outline containing a globe with a blue globe grid, for Flagships; (2) two open hands holding a blue dollar sign above them, for Insurance capital; (3) a bank building with columns and a base line, with a blue magnifying glass at upper right, for Equity strategies; (4) three overlapping circles, outlined in navy, for Credit strategies. Row 2: (5) concentric target-like arcs with a blue cursor arrow pointing into them, for Sector focused; (6) a navy globe outline with a blue cursor arrow at its left, for Geographic focused; (7) three person figures, the centre one navy and the two side ones outlined in blue, for Partner managers; (8) a navy person outline in a circle with a blue check-mark circle overlapping lower right, for Public affiliates. Vertical rules at about x 27.3%, 50.0% and 72.7% span y 30.1% to 82.6%; horizontal rule at about y 56.3% spans x 4.7% to 95.3%; rules are light grey #D0D0CE, about 0.1% of slide width.
Slide 23
And the pace of these cross-business origination opportunities is accelerating
Originated by
Credit
Deployed in
Private Equity
Originated by
Energy
Deployed in
Credit
Originated by
Credit
Deployed in
Infrastructure
BROOKFIELD.COM
23
Visuals: Three company logos and three double-chevron arrow icons. Logo 1: Kobalt, a red-orange (#FF3B26 approx.) geometric K mark followed by black lowercase wordmark 'Kobalt'. Logo 2: Origis Energy, four stacked curved arc strokes in orange, dark blue, blue and green on the left, followed by orange wordmark 'Origis Energy' with registered mark. Logo 3: Compass Datacenters, a circular mark split dark slate grey (#37424A approx.) on the left half and orange (#F7820A approx.) on the right half with a small green leaf accent, followed by dark slate grey 'COMPASS' capitals and orange italic 'datacenters' with registered mark. Each card has a thin outline chevron pair (two open right-pointing chevrons, dark navy #002540 stroke, about 0.2% stroke) between 'Originated by' and 'Deployed in'. No photographs or charts.
Slide 24
Our disciplined approach has generated strong long-term / performance at a scale and consistency few can match / Gross Return / Net Return / Flagships / Fund History / Target / Actual / Target / Actual / Infrastructure / 16 years / 13% / 15% / 11% / 12% / Energy / 5 years / 14% / 23% / 11% / 18% / Private Equity / 25 years / 23% / 25% / 19% / 19% / Real Estate / 20 years / 20% / 18% / 16% / 14% / Opportunistic Credit / 38 years / 15% / 22% / 10% / 16% / See Notice to Recipients and Endnotes, including endnotes 11 through 17 / BROOKFIELD.COM / 24
Visuals: Table with columns: Flagships (row label), Fund History, Gross Return Target, Gross Return Actual, Net Return Target, Net Return Actual. Rows: Infrastructure, 16 years, 13%, 15%, 11%, 12%. Energy, 5 years, 14%, 23%, 11%, 18%. Private Equity, 25 years, 23%, 25%, 19%, 19%. Real Estate, 20 years, 20%, 18%, 16%, 14%. Opportunistic Credit, 38 years, 15%, 22%, 10%, 16%. Actual columns are set in bold. No chart, photograph or logos. Thin navy horizontal rule under the Gross Return and Net Return group labels spanning the table width, a second navy rule under the column header row, and thin light grey vertical dividers after the Gross Target/Actual column (between Actual and Net Return Target area) at about 65% and 75% of width running from the header row to the last data row.
Slide 25
Our investment-driven approach / allows us to successfully launch / new strategies / BROOKFIELD.COM / 25
Visuals: None apart from a short thin navy horizontal rule (about 1.5% of slide width, about 0.2% of slide height) between 'BROOKFIELD.COM' and the page number, located at about x 92.0, y 92.8. No photographs, charts, icons or logos.
Slide 26
Leading to significant expansion of our strategies to 60+
Infrastructure (2009 First Flagship)
Infrastructure Income Fund
Infrastructure Structured Solutions
AI Infrastructure
2023
2024
2026
Private Equity (2001 First Flagship)
Financial Infrastructure Fund
Evergreen Private Equity
Middle East Fund
2025
2025
2025
Real Estate (2006 First Flagship)
2016
Core-Plus Real Estate
2022
Real Estate Solutions
2024
Opportunistic Regional Sleeves
Energy (2021 First Flagship)
2025
Emerging Markets Transition
China Renewable Fund
2026
Credit (1988 First Flagship)
Infrastructure & Renewable
2016
Global Credit
2017
Asset Backed
2018
Flagships are no longer the majority of revenues for any business group
BROOKFIELD.COM
26
Visuals: A horizontal timeline bar chart (Gantt style) with no axes, no tick marks, no legend and no numeric scale; each bar is labelled at its left end with its start year and runs to the right edge of the chart (about 95.6% of slide width), so the bars show start years only. Infrastructure group (navy bars #002540): 'Infrastructure Income Fund' bar labelled 2023, starting about 66.4% from the left; 'Infrastructure Structured Solutions' bar labelled 2024, starting about 73.2%; 'AI Infrastructure' bar labelled 2026, starting about 90.9%. Private Equity group (blue bars #419AD9): 'Financial Infrastructure Fund', 'Evergreen Private Equity' and 'Middle East Fund' bars, each labelled 2025, starting about 80.6%. Real Estate group (green bars #489B48): 'Core-Plus Real Estate' labelled 2016, starting about 25.9%; 'Real Estate Solutions' labelled 2022, starting about 60.3%; 'Opportunistic Regional Sleeves' labelled 2024, starting about 74.1%. Energy group (plum bars #5F265F): 'Emerging Markets Transition' labelled 2025, starting about 81.2%; 'China Renewable Fund' labelled 2026, starting about 90.9%. Credit group (mauve bars #BFA8BF): 'Infrastructure & Renewable' labelled 2016, starting about 25.9%; 'Global Credit' labelled 2017, starting about 31.5%; 'Asset Backed' labelled 2018, starting about 36.5%. No highlighted points. Bars are uniform thin pills of about 0.9% of slide height, evenly spaced within each group. The footer has a short dark grey rule between the URL and page number.
Slide 27
Our recipe for new strategies is built on discipline at every step / Leveraging our capabilities… / Play to our strengths / Focus on adjacencies / Chase durability and longevity / Target leadership positions / …While being prudent / Walk before running / Keep mistakes small, learn fast / Scale decisively / Tap into the Brookfield ecosystem / BROOKFIELD.COM / 27
Visuals: Eight line icons, each drawn in thin dark-navy outline with a small blue accent. Left column, top to bottom: (1) a pickaxe-like tool, a navy diagonal handle with a blue curved arc at its head and a small navy tick at the top right; (2) two overlapping outline circles, a Venn-style pair; (3) an outline shield with no inner detail; (4) an outline trophy cup with a blue five-point star on the bowl and a navy base. Right column, top to bottom: (5) a navy check mark with a blue upper stroke; (6) an outline magnifying glass with a blue dollar sign inside the lens; (7) an outline set square (right-angle triangle) with tick marks along its edges and a blue inner triangle; (8) an outline globe with navy continent shapes. No photographs, charts or diagrams. Icons are not boxed, filled or shadowed.
Slide 28
Complementary products built the right way for the long term
BSIP
Identified substantial
need in the market for
super core capital
Broad sourcing
capabilities
Utilizing existing teams
and capabilities to
drive value
Built patiently over 8 years
$26B
Raised since inception
(including co-investments)
~$3B+
Run-rate annual fundraising
Fundraising ($B)
$3.3
$2.6
$1.0
2024
2025
2026
BROOKFIELD.COM 28
Visuals: Icons and chart. (1) Line-chart icon in the first navy panel: a white L-shaped axis (vertical then horizontal, bottom-left corner) with a blue #419AD9 zigzag trend line rising to the upper right with an arrowhead at the end. (2) Layers icon in the second panel: a white circle outline containing three stacked blue #419AD9 chevron-diamond layers. (3) Overlapping circles icon in the third panel: a white circle outline overlapping a blue #419AD9 circle outline, the blue one lower-right. (4) Bar chart titled Fundraising ($B), vertical bars, no visible y-axis or gridlines, baseline in navy #002540. Series values printed above each bar: 2024 $1.0 (bar about 41% to 48% across, shorter bar), 2025 $2.6 (about 61% to 67%, medium bar), 2026 $3.3 (about 81% to 87%, tallest bar). Bar heights are proportional to the printed values, so the 2025 bar is about 79% of the 2026 height and the 2024 bar about 30%. Bars are solid #1D5A85 with no outlines. No legend. No highlighted points. (5) Navy chevron bracket: a thick #002540 stroke in the shape of a right-pointing angle bracket spanning about 29% to 33% horizontally and 52% to 88% vertically, pointing right toward the chart.
Slide 29
Private wealth products built the right way for the long term
BII
Institutional and wealth capital invest in same assets side by side
Matching fundraising and deployment
Slower growth early, exponential growth later
Built patiently over ~4 years
$10B
~$4B
Zero
Raised since inception
Run-rate annual fundraising
Quarters of net outflow
More consistent fundraising
Better client experience
Exponential long-term growth
BROOKFIELD.COM
29
Visuals: Six line icons and one chevron. (1) Top-left panel: two overlapping outline circles, the left one white and the right one light blue #419AD9, stroke about 2 px. (2) Top-middle panel: a white outline circle containing three stacked blue #419AD9 chevron layers (a layers icon). (3) Top-right panel: a line chart icon, an L-shaped white axis with a blue zigzag line rising to an arrowhead at upper right. (4) Lower-right grey box: outline overlapping circles in navy #002540. (5) Trophy outline in navy with a blue star on the cup. (6) Blue check mark over a navy check mark. (7) A thick navy #002540 chevron pointing right, apex at about x 54.9%, y 69%, stroke about 4 px, spanning y 51.7% to 87.8%. No photographs. No chart.
Slide 30
Positioned for the future / BROOKFIELD.COM / 30
Visuals: One icon: a line-art award rosette (badge) in white outline, about 4% of the slide width and 9.6% of the slide height, centred horizontally at about 48% to 52% of the slide width and 28.7% to 38.3% of the slide height. The rosette is a scalloped white outline badge with a blue inner circle (#4A90D9) and two white ribbon tails hanging below it. Also one short horizontal white hairline rule between the URL and the page number, about 1.5% of the slide width wide, at about 92.0% to 93.5% of the slide width. No photographs, charts, tables or diagrams.
Slide 31
We have strengths in the areas that will matter tomorrow
Strategic partnerships
Enhanced capabilities
The right
markets
BROOKFIELD.COM
31
Visuals: Three line icons, one per column, each centred horizontally in its cell above the label. Left: a navy (#002540) outline handshake, two hands clasped, drawn with a single stroke of about 1.5 px. Centre: a black (#000000) outline cloud-like scalloped badge containing a blue ($ sign) in the centre, the dollar sign in a light blue (about #3B8FD9) and about 1.5 px stroke. Right: a navy (#002540) outline shield with a blue (about #3B8FD9) globe with meridian and equator lines inside. No photographs, charts or tables.
Slide 32
Building partnerships with large sovereign governments and / the companies that will define the next decade / BROOKFIELD.COM / 32
Visuals: Eight partner tiles in a 4 by 2 grid, all with thin grey outlines, each holding one logo or flag. Row 1, left to right: NVIDIA wordmark with its green eye emblem; U.S. Department of Energy seal with the words U.S. DEPARTMENT of ENERGY; OpenAI Deploy Co. wordmark with the black flower-like OpenAI mark; ANTHROP\C wordmark. Row 2, left to right: Bloom energy wordmark, dark green Bloom over bright green energy; flag of France, vertical bands navy, white and red; flag of Kuwait, horizontal bands green, white and red with a black trapezoid on the hoist side; Maple Fund logo, a red maple leaf over navy Maple Fund wordmark. The Maple Fund tile sits on a slightly lighter off-white panel that extends beyond the tile edges. No photographs or charts.
Slide 33
Investor relationships have become more than just clients
NVIDIA
LP Investor
$2B
BAIIF commitment
Technology Partner / Tenant
CSQUARE
RADIANT
NVIDIA-powered cloud platform
Investment Partner
NAVER
200MW planned Korea capacity by 2028
Financing Partner
$500B
Third-party capital target
We invest in relationships, driving repeat commitments, broader mandates and new opportunities
BROOKFIELD.COM
33
Visuals: Four outlined rectangular panels with thin light-grey borders on the light background. Panel 1 (LP Investor) holds the figure $2B in blue. Panel 2 (Technology Partner / Tenant) holds the CSQUARE wordmark in black above the RADIANT logo, which is white letters on a black rectangle with a faint red dotted globe graphic behind the word. Panel 3 (Investment Partner) holds the NAVER wordmark in bright green capitals. Panel 4 (Financing Partner) holds the figure $500B in blue. The NVIDIA logo at the top is the green eye-shaped mark beside black NVIDIA wordmark with a registered symbol. A navy bar sits across the bottom. No charts, photographs or tables.
Slide 34
Our partnership and solutions approach makes the difference
Infrastructure
Energy
Private Equity
Customized Solutions
Directs
Secondaries
BROOKFIELD PLATFORM
INVESTMENT ACCESS
Funds
Co-Investments
Balance Sheet Investments
Real Estate
Credit
$10B
Closed or approved mandates
$5B
7 Recent wins
$600M
Average mandate size
BROOKFIELD.COM
34
Visuals: Diagram: a large circle (about 31% wide, 55% tall, centred at about x 32%, y 58%) with a thin navy #002540 outline (about 1 px) and a fine light-grey square grid pattern filling its interior (grid lines about #D9D9D9 on #F2F1EF). At the centre sits a solid navy #002540 circle (about 12% wide) containing the white text 'Customized Solutions' in two centred lines. Around the centre are six green #489B48 pill-shaped labels with white bold text: 'Directs' and 'Secondaries' across the upper half, 'Funds' and 'Co-Investments' across the middle-lower half, and 'Balance Sheet Investments' along the bottom. Two outlined pills sit on the horizontal axis at the left and right edges of the circle: 'BROOKFIELD PLATFORM' (outline #2F7FD0 blue, white fill) on the left and 'INVESTMENT ACCESS' (outline #489B48 green, white fill) on the right. Five solid blue #4A9BD9 circles, each about 3.5% wide, sit on the circle edge at compass points, each with a white thin-line icon: top (Infrastructure, a transmission tower with radiating signal arcs), upper-left (Energy, a wind turbine), upper-right (Private Equity, a battery-like box with plus and minus symbols), lower-left (Real Estate, a house beside a multi-storey building), lower-right (Credit, a leaf-like or dollar-like emblem with a line motif). Each icon circle has a navy text label beside it: 'Infrastructure' above the top circle, 'Energy' to its left, 'Private Equity' to the right of its circle, 'Real Estate' to the left of the lower-left circle, and 'Credit' to the right of the lower-right circle. Statistics on the right: '$10B' in very large bold navy with a smaller 'B' suffix, 'Closed or approved mandates' beneath; '$5B' with '7 Recent wins' beneath; '$600M' with a smaller 'M' suffix and 'Average mandate size' beneath. Two thin light-grey horizontal rules (about #D0D0D0, 1 px) separate the three stat blocks. No photographs.
Slide 35
Defined Contribution is the next / institutional-scale alternatives market / Opportunity to enhance / outcomes for the retiree / Collaboration with / AllianceBernstein / Private Markets Share of Defined Contribution Assets / 15%+ / $14T / Total addressable / market / <1% / 2026 / Long / Term / Source: Brookfield Estimates, Investment Company Institute / See Notice to Recipients and Endnotes / BROOKFIELD.COM / 35
Visuals: Chart: a rising line chart with no axis numbers. Title: Private Markets Share of Defined Contribution Assets. The curve is a single dark blue (#1D5A85) stroke, about 4 px thick, rising slowly from left to a steep climb at right. It starts with a dark blue circle labelled <1% at the 2026 end, and ends with a dark blue circle labelled 15%+ at the top right end, above and to the right of the curve. The horizontal baseline is a thin dark navy (#002540) line with the label 2026 under its left end and Long Term under its right end. A large light grey (#D9D7D1) circle sits over the middle of the chart, centred on $14T with the caption Total addressable market beneath it. No legend. No highlighted points beyond the two circle markers. Logo: AllianceBernstein square logo, black square (#000000) with white stylised [A/B] brackets and a white horizontal bar, placed in the left panel. The logo is boxed square with no rounding. A thin light grey (#D9D7D1) divider line sits between the statement and the logo.
Slide 36
The 3 D’s have accelerated, and no one is better positioned / to benefit from these trends / Digitalization / Deglobalization / Decarbonization / BROOKFIELD.COM / 36
Visuals: Three line icons, each about 5.4% of slide width and 9.6% of slide height, drawn in dark navy #002540 with blue #4A9FDB accents. Icon 1 (left column, centred at about x 13.8%, y 42%): a computer chip, a navy square outline with short pins on all four sides, with the letters 'AI' in blue inside. Icon 2 (centre column, about x 47%, y 42%): a cargo ship, navy hull and superstructure outline with a blue inner window bar and three blue wave lines beneath. Icon 3 (right column, about x 76%, y 42%): a seedling, a navy stem with a navy left leaf and a blue right leaf. No photographs, charts or tables.
Slide 37
Key takeaways
1
Increasingly diversified
2
Consistency of performance
3
Positioned for the future
BROOKFIELD.COM
37
Visuals: Three outlined square number boxes, each with a thin navy stroke, containing the numerals 1, 2 and 3 in a light-weight thin blue sans-serif numeral (about #3A9AD9). Boxes are equal size, left-aligned in a column at the same x position, spaced evenly down the slide. A short horizontal navy dash sits in the footer between the domain and the page number. No photographs, charts or logos.
Slide 38
Designed for Durability, / Positioned for Growth / Hadley Peer Marshall / CFO
Slide 39
The Brookfield model
BROOKFIELD.COM
39
Slide 40
Pure-play, asset-light alternative manager / $672B / Fee-Bearing Capital / $245B / Permanent Capital Base / $427B / Private Funds / Public market capital / NYSE, TSX: BIP, BEP, BBUC / Brookfield Property (BPG) / Insurance capital / Annuities / Pension risk transfer / Institutional capital / Global fundraise capacity / Diversified client base / Individual capital / Private wealth / See Notice to Recipients and Endnotes, including endnote 2 / BROOKFIELD.COM / 40
Visuals: Non-photographic. One filled circle in the centre, colour #CCCAC4 with a thin off-white (#F2F2F0) rim, containing the figure $672B and the label Fee-Bearing Capital in dark navy #002540. Four rectangular outlined boxes with square corners and thin strokes about 0.2 percent of slide width: two green (#489B48) boxes under the left heading, enclosing Public market capital and Insurance capital; two blue (#419AD9) boxes under the right heading, enclosing Institutional capital and Individual capital. Boxes have no fill, showing the navy background. No charts, photographs, logos or icons.
Slide 41
We have a product for
every investor because of our model
BROOKFIELD.COM
41
Slide 42
More attractive options for more investors
Infrastructure products across the liquidity and risk/return spectrum
Liquid
Daily liquidity
BIP
Value-add / core plus
Evergreen
Periodic liquidity
BII
Diversified across risk / return
BSIP
Core, stable income
Drawdown
Long-term
BAIIF
Value-add
BIF
Core-plus, growth and income
BISS
Core-plus, structured equity
BID
Credit / debt strategies
BROOKFIELD.COM
42
Slide 43
More attractive options for more investors
Sector and geography
Global
diversified / worldwide
Sector-Focused
theme / sector
Geographic
single-market
BIF Infrastructure
BGTF Energy transition
BSREP Real estate
BCP Private equity
Opps Credit
BAIIF AI infrastructure
BREVA-H Housing
BFIP Financial infrastructure
Power Opps Energy services
BREF Real estate finance
CTF Emerging markets
BCRF Asia
BSREP-APAC Asia Pacific
BSREP-E Europe
BMEP Middle East
BROOKFIELD.COM
43
Slide 44
Over 60 funds allow us meet the strong investor demand / Real Estate / Debt / Bank / Loans / Core-Plus / Real Estate / Non-Traded / REIT / BIP / Global Core / Infrastructure / Real Estate / Solutions / Real / Estate / Flagship / Insurance / Solutions / Infrastructure / Debt / Venture / Debt / Private / Equity / Flagship / High Yield / Bonds / Venture Capital / Solutions / Infrastructure / Structured / Solutions / Special / Investments / Global Transition / Flagship / Infrastructure / Flagship / BEP / Global Core / Real Estate / Private Equity / Wealth / Middle East / Partners / BBUC / Catalytic / Transition / Opportunistic / Credit / Flagship / Direct / Lending / Infrastructure / Wealth / BROOKFIELD.COM / 44
Visuals: Bubble (packed circle) diagram with 27 circles, each labelled with a fund name. Circle diameter differs by fund; no numeric values, axes or legend are printed. Colour key by fill, not printed on slide: dark blue #1D5A85 (Real Estate Debt, Core-Plus Real Estate, Real Estate Solutions), light blue #B3D7F0 (BIP, Real Estate Flagship, Infrastructure Flagship, Infrastructure Wealth, BEP, BBUC, Middle East Partners, Infrastructure Structured Solutions), teal #8FC6CB (Non-Traded REIT, Global Core Infrastructure, Private Equity Wealth), green #ADD2AD (Private Equity Flagship, High Yield Bonds, Catalytic Transition, Direct Lending), warm grey #D9D7D1 (Bank Loans, Insurance Solutions, Infrastructure Debt, Venture Debt, Venture Capital Solutions, Global Transition Flagship, Global Core Real Estate, Special Investments, Opportunistic Credit Flagship). No photographs, icons or logos.
Slide 45
Our success is consistent / BROOKFIELD.COM / 45
Slide 46
Fundraising is consistently growing through economic cycles / $163B raised over the last 12 months / Record Year / $136 / $112 / $93 / $83 / $71 / $41 / 2020 / 2021 / 2022 / 2023 / 2024 / 2025 / 2026E / Organic / Inorganic / Fundraising figures represent full calendar year / See Notice to Recipients and Endnotes, including endnote 10 / BROOKFIELD.COM / 46
Visuals: Chart: vertical stacked column chart, seven columns, one per year. Columns are 2020, 2021, 2022, 2023, 2024, 2025 and 2026E, read left to right. Title: none inside the chart; the slide headline and subtitle serve as its title. Axes: no visible y-axis or tick labels; the x-axis is labelled with the years. A y-axis scale of 20 to 160 exists only as near-invisible text in #F2F1EF (see elements). Series: Organic (dark green #489B48, bottom segment) and Inorganic (light green #ADD2AD, top segment). Printed values are totals only: 2020 $41; 2021 $71; 2022 $93; 2023 $83; 2024 $136; 2025 $112; 2026E no value printed but its column is the tallest and is labelled Record Year. Organic and inorganic split values are not printed. The 2020, 2021, 2023 and 2025 columns show only the organic segment. The 2022 column has an inorganic segment about 30% of its height. The 2024 column has an inorganic segment about 40% of its height. The 2026E column has an inorganic segment about 25% of its height; these are visual estimates. Legend: centred below the x-axis; dark green square followed by Organic, then light green square followed by Inorganic. Highlighted point: the 2026E column carries the bold label Record Year directly above it, right-aligned to the column. Baseline: a single dark navy #002540 horizontal line under all columns, about 0.2% of the height thick. Columns: flat rectangles with square corners and no shadows, no outlines, evenly spaced with gaps about equal to their width; each column is centred over its year label.
Slides 47 to 114 continue in the full text file.
Download this deck
The hosted PDF of every library deck is free for readers of the SlideDeck Co newsletter. Join with your email and the viewer and download appear here.
Preparing a results presentation or business update of your own? The SlideDeck Co Standard Deck is a slide library for business reviews, updates and plans.







