
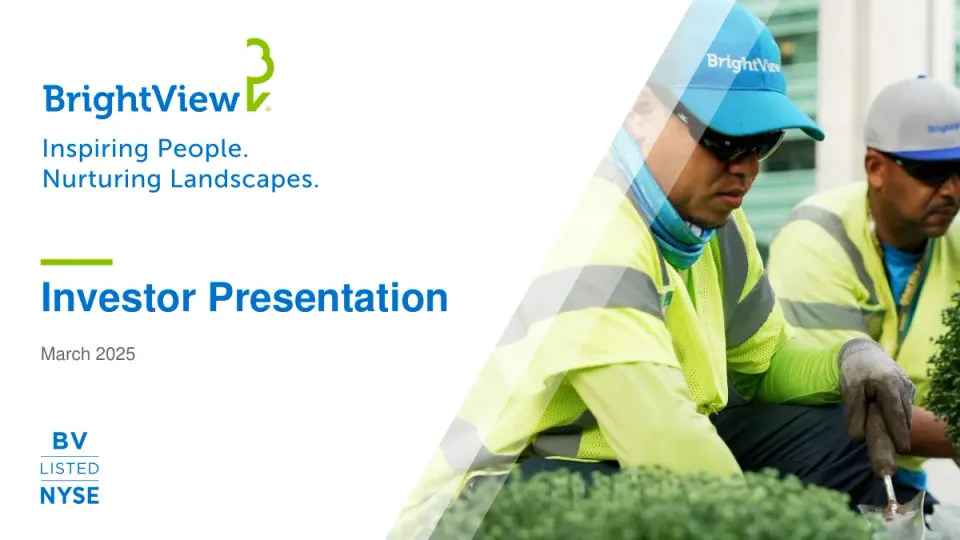
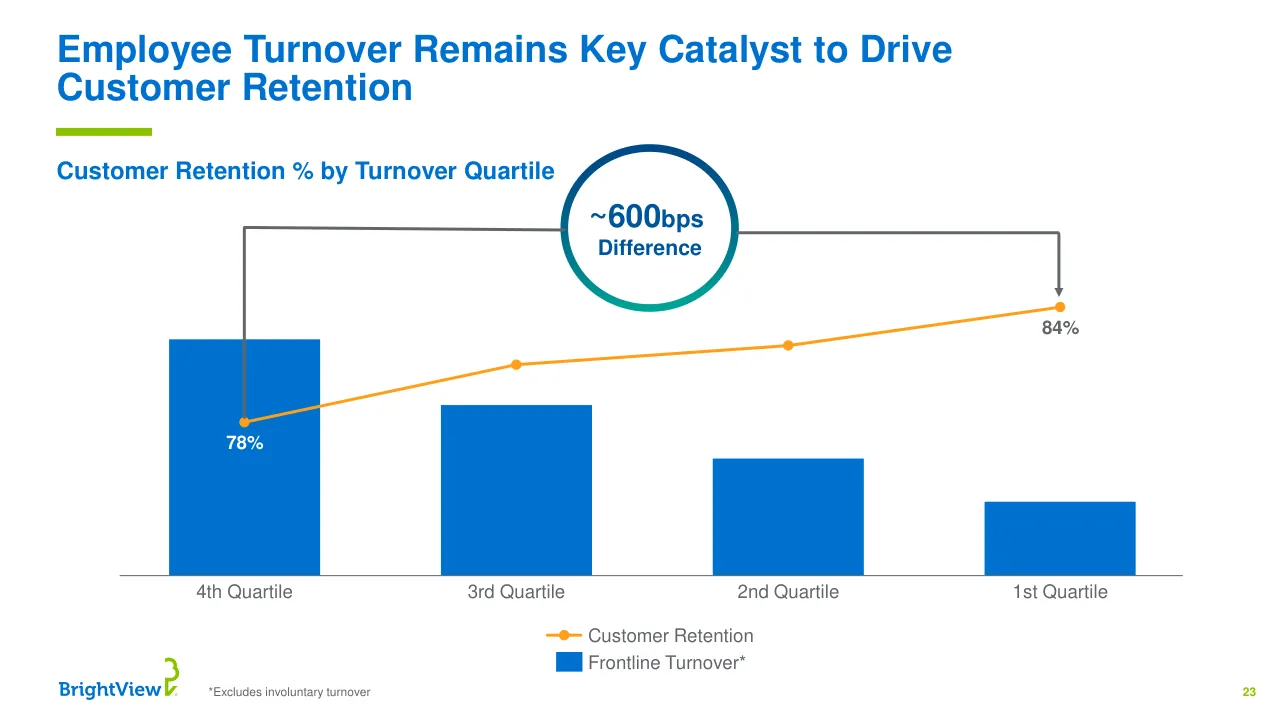
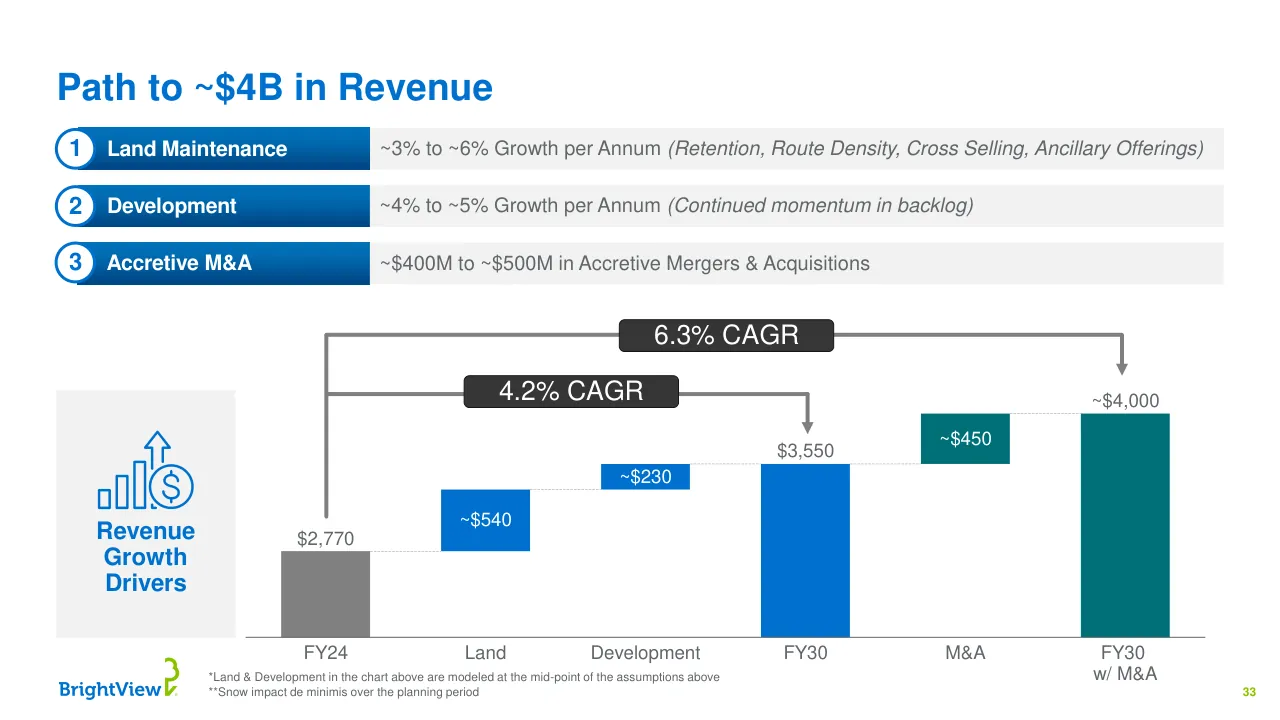
The deck opens with a title slide and a forward-looking statements disclaimer, then introduces BrightView as a commercial landscaping and snow services company with about 20,000 employees, $2.8B in revenue and 280 branch locations. It moves through the company's history, showing a prior period of revenue growth without profit growth, the refreshed focus under new leadership, and the 2023 to 2025 adjusted EBITDA trend. Core sections cover the market opportunity, frontline employee turnover, customer retention, development-business growth, share of wallet, national accounts, capital allocation, and a path to about $4B in revenue and 16%+ EBITDA margins by 2030. Operational levers follow, including purchasing, fleet management, and SG&A rebalancing toward sales. The appendix holds FY25 guidance, leadership, and non-GAAP reconciliations. The deck closes with a short thank-you slide. Slides worth studying are the customer retention and turnover correlation charts on slides 22 and 23, which pair a single metric with a clear visual, and the revenue bridge on slide 33 that breaks growth into labeled drivers.
Slides worth studying
Questions about this deck
What does the BrightView investor presentation say about customer retention?
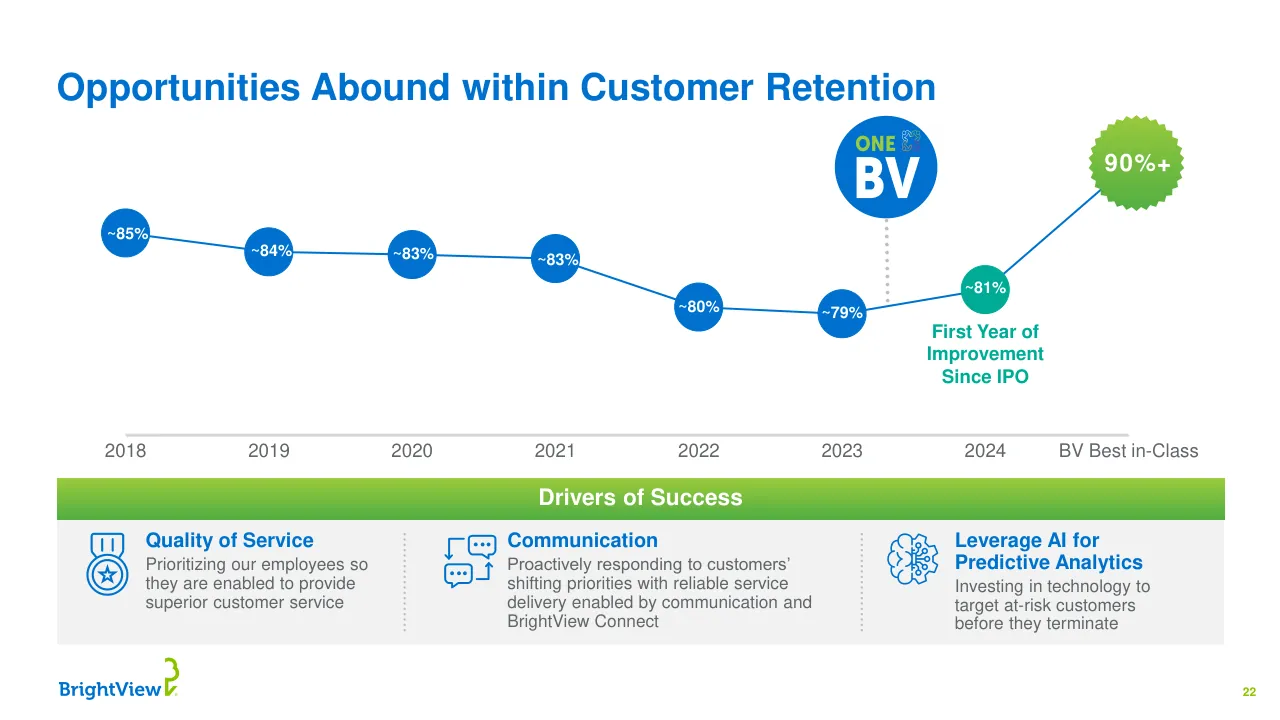
Slide 22 shows BrightView customer retention moving from about 85% in 2018 to about 81% in 2024, with 2024 marked as the first year of improvement since the IPO. The same slide lists drivers of success including quality of service, communication, and AI-based predictive analytics.
What are BrightView's 2030 aspirational targets?
Slide 15 lists 2030 aspirational targets from the February 2025 Investor Day of about $4B in total revenue, about $650M+ in adjusted EBITDA, about 16%+ adjusted EBITDA margins, and about 40%+ free cash flow conversion.
What is BrightView's FY25 revenue and EBITDA guidance?
Slide 17 gives FY25 guidance from the November 2024 earnings call of total revenue of $2.750B to $2.840B and adjusted EBITDA of $335M to $355M. The same slide lists adjusted free cash flow guidance of $40M to $60M.
How big is the U.S. market that BrightView operates in, and what share does it hold?
Slide 10 places the U.S. commercial landscaping services market at about $88B, with BrightView at about $1.7B (land only) and a market share of about 2%. The slide cites IBIS Industry Reports (April 2024) as the source.
Details
- Company: BrightView
- Year: 2025
- Type: Investor presentation
- Industry: Commercial landscaping and snow services
- Pages: 45
Review score: 7 out of 10, Effective
Presentation quality, judged with the SlideDeck Co review heuristic. Ask, evidence and idea merit are not rated here.
The deck has a consistent brand system and a clear storyline from past to refreshed focus to a 2030 path, and the chart slides (22, 23, 33) put one message in the title and one visual beneath it. Weaknesses are consequential: the 2030 targets slide 15 packs a dense highlights panel and a repeated icon strip into one page, slide 14 labels its equals signs ambiguously, and slides 13 and 15 repeat the same five-step diagram. Several slides use very small source and footnote text (11, 27, 38, 39), and the appendix tables on 43 and 44 are unreadable at presentation size. The forward-looking disclaimer is a wall of tiny text.
Worth keeping: Keep the action titles with a green takeaway bar, the single-message chart slides 22 and 23, and the labeled waterfall on slide 33 with CAGR brackets.
Most useful repair: Cut the duplicated five-step graphic on slide 15, enlarge or trim the small chart labels and footnotes on slides 27, 39 and 42, and break the appendix reconciliations into readable tables.
What would change the score: I would reduce the number of slides that restate the same retention, turnover and growth framework (12, 13, 14, 21) so the argument advances rather than loops.
Confidence high. 45 of 45 pages inspected on contact sheets, 4 at readable size. Reviewed 2026-11-08. Model-assisted review (claude-sonnet-5-5).
Full text of the slides (45 slides)
Every slide's words and a description of its charts and images, so the deck can be searched and rebuilt. Also available as Markdown.
Slide 1
BrightView
Inspiring People.
Nurturing Landscapes.
Investor Presentation
March 2025
BV
LISTED
NYSE
Visuals: BrightView logo: 'BrightView' in blue rounded bold sans with a green stylised sprout/tree glyph and registered mark at upper right. Short green horizontal bar above the title. Stacked stock badge 'BV / LISTED / NYSE' with thin blue horizontal rules between the lines. Photograph on the right: two landscaping workers in hi-vis yellow-green safety vests with grey reflective stripes crouching and planting; the foreground worker wears a turquoise BrightView cap, dark sunglasses, a blue neck gaiter and a grey work glove holding a trowel; the second worker at right wears a grey cap and sunglasses. Green shrubs in the foreground, blurred green-glass building behind, bright daylight, dominant yellow-green, blue and white. Photo is cropped to a diagonal parallelogram edge, with two semi-transparent white diagonal bands (35% and 60% opacity) overlapping the left edge of the photo.
Slide 2
Forward Looking Statements
This presentation contains "forward- looking statements" within the meaning of the safe harbor provision of the U.S. Private Securities Litigation Reform Act of 1995, Section 27A of the Securities Act of 1933, as amended (the “Securities Act”), and Section 21E of the Securities Exchange Act of 1934, as amended (the “Exchange Act”), which are subject to the “safe harbor” created by those sections. All statements, other than statements of historical facts included in this presentation, including statements concerning our plans, objectives, goals, beliefs, business outlook, business trends, expectations regarding our industry, strategy, future events, future operations, future liquidity and financial position, future revenues, projected costs, prospects, plans and objectives of management and other information, may be forward-looking statements.
Words such as “believes,” “expects,” “may,” “will,” “should,” “seeks,” “intends,” “plans,” “estimates,” or “anticipates,” and variations of such words or similar expressions are intended to identify forward-looking statements. The forward-looking statements are not historical facts or guarantees of future performance and are based upon our current expectations, beliefs, estimates and projections, and various assumptions, many of which, by their nature, are inherently uncertain and beyond our control. Our expectations, beliefs, and projections are expressed in good faith, and we believe there is a reasonable basis for them. However, there can be no assurance that management’s expectations, beliefs and projections will result or be achieved, and actual results may vary materially from what is expressed in or indicated by the forward-looking statements. There are a number of risks, uncertainties and other important factors, many of which are beyond our control, that could cause our actual the forward-looking statements contained in this presentation. New risk factors and uncertainties may emerge from time to time, and it is not possible for management to predict all risk factors and uncertainties. Some of the key factors that could cause actual results to differ from our expectations include risks related to: competitive industry pressures; our ability to preserve long-term customer relationships; a determination by customers to reduce their outsourcing or use of preferred vendors; inconsistent practices and the operating results of individual branches; our ability to implement our business strategies and achieve our growth objectives; impacts of future acquisitions or other strategic transactions; the possibility that costs or difficulties related to the integration of acquired businesses’ operations will be greater than expected and the possibility that integration efforts will disrupt our business and strain management time and resources; the potential impacts on revenues and our financial condition caused by any disposition of assets or discontinuation of lines of business; the seasonal nature of our landscape maintenance services; our dependence on weather conditions and the impact of severe weather and climate change on our business; disruptions in our supply chain and changes in our ability to source adequate supplies and materials in a timely manner; any failure to accurately estimate the overall risk, requirements, or costs when we bid on or negotiate contracts that are ultimately awarded to us; the conditions and periodic fluctuations of the new commercial construction sector, as well as spending on repair and upgrade activities; the level, timing and location of snowfall; our ability to retain or hire our executive management and other key personnel; our ability to attract, retain and maintain positive relations with workers; any failure to properly verify employment eligibility of our employees; the liability exposure from our use of subcontractors to perform work under certain customer contracts; our recognition of future impairment charges; laws and governmental regulations, including those relating to employees, wage and hour, immigration, human health, safety, transportation and the associated financial impact of such regulations; environmental, health and safety laws and regulations, including laws pertaining to the use of pesticides, herbicides and fertilizers, or liabilities thereunder, as well as the related risk of potential litigation; the distraction and impact caused by litigation, of adverse litigation judgments and settlements resulting from legal proceedings; tax increases and changes in tax rules; any increase in on-job accidents involving employees; any failure, inadequacy, interruption, security failure or breach of our information technology systems; compliance with data privacy regulations; our ability to adequately protect our intellectual property; any adverse consequences of our substantial indebtedness; increases in interest rates governing our variable rate indebtedness increasing the cost of servicing our substantial indebtedness; risks related to counterparty credit worthiness or non-performance of the derivative financial instruments we utilize; restrictions within our debt agreements that limit our flexibility in operating; our ability to generate sufficient cash flow to satisfy our significant debt service obligations; the incurrence of substantially more debt, including off-balance sheet financing, contractual obligations and general and commercial liabilities; any failure to extend credit under our facility or reduce the borrowing base under our Revolving Credit Facility; any future sales, or the perception of future sales, by us or our affiliates, which could cause the market price for our common stock to decline; the ability of KKR and One Rock to exert significant influence over us; anti-takeover provisions in our organizational documents that could delay or prevent a change in control; the authorization of our Board of Directors to issue and designate shares of our preferred stock in additional series without stockholder approval; the fact that the holders of our Series A Preferred Stock may have different interests from and vote their shares in a manner deemed adverse to, holders of our common stock; the dividend, liquidation, and redemption rights of the holders of our Series A Preferred Stock; our certificate of incorporation restricting all stockholder litigation matters to the Court of Chancery of the State of Delaware and the federal district courts of the United States of America; general business, economic, and financial market conditions; increases in raw material costs, fuel prices, wages and other operating costs, and changes in our ability to source adequate supplies and materials in a timely manner; occurrence of natural disasters, terrorist attacks, global health emergencies and other external events; heightened inflation, geopolitical conflicts, recession, financial market disruptions and other economic conditions; environmental, social and governance matters and/or our reporting of such matters; significant changes in our stock price and its ability for resale; securities analysts’ reports about our business or their downgrade of our stock or sector; maintaining effective internal controls; and costs and requirements imposed as a result of maintaining compliance with the requirements of being a public company.
Additional factors that could cause our results to differ materially from those described in the forward-looking statements can be found under "Item 1A. Risk Factors" in our Form 10-K for the fiscal year ended September 30, 2024, and such factors may be updated from time to time in our periodic filings with the Securities and Exchange Commission, which are accessible on the SEC's website at www.sec.gov. Accordingly, there are or will be important outcomes or results to differ materially from those indicated in these statements. These factors should not be construed as exhaustive and should be read in conjunction with the other cautionary statements that are included in this release and in our filings with the SEC. Any forward-looking statement made in this press release speaks only as of the date on which it was made. We caution you that the risks, uncertainties, and other factors referenced above may not contain all of the risks, uncertainties and other factors that are important to you. In addition, we cannot assure you that we will realize the results, benefits, or developments that we expect or anticipate or, even if substantially realized, that they will result in the consequences or affect us or our business in the way expected. We undertake no obligation to publicly update or revise any forward-looking statements to reflect subsequent events or circumstances, any change in assumptions, beliefs or expectations or any change in circumstances upon which any such forward-looking statements are based, except as required by law.
Non-GAAP Financial Measures
Included in this presentation are certain non-GAAP financial measures, such as " Adjusted EBITDA", "Adjusted EBITDA Margin", "Adjusted Net Income", "'Free Cash Flow", Total Financial Debt", "Total Net Financial Debt" and "Total Net Financial Debt to Adjusted EBITDA ratio", designed to complement the financial information presented in accordance with U.S. GAAP because management believes such measures are useful to investors. These non-GAAP financial measures should be considered only as supplemental to financial measures provided in accordance with GAAP. Please refer to the appendix of this presentation for a reconciliation of the historical non-GAAP financial measures included in this presentation to the most directly comparable financial measures prepared in accordance with GAAP. Because GAAP financial measures on a forward-looking basis are not accessible, and reconciling information is not available without unreasonable effort, we have not provided reconciliations for forward-looking non-GAAP measures. For the same reasons we are unable to address the probable significance of the unavailable information, which could have a potentially unpredictable and potentially significant impact on our future GAAP financial results.
2
Visuals: BrightView logo at bottom left: the word 'BrightView' in bold blue sans-serif with a green stylised leaf/sprout mark made of curved strokes to its right, and a tiny registered mark. No other images, charts or shapes.
Slide 3
BrightView Today
Founded in 1939
Headquartered: Blue Bell, PA
Employees: ~20,000
Revenue: $2.8B
Jobs: ~20,000
Branch Locations: 280
Note: Branch locations include satellites
States with BrightView Branches
Corporate Headquarters
Maintenance Branches
Development Branches
Shared Branches
Business Overview & Highlights
Essential Commercial Landscaping & Snow Services
Predictable recurring revenue model
Non-discretionary and resilient service
Broad offering of ancillary services
Landscape Architecture & Development Services
New landscapes / large-scale redesign projects
Horticultural & design thought-leadership
Complex and high-profile projects
3
Visuals: A map of the United States (with Alaska and Hawaii insets) shows states with BrightView branches in muted purple (#7B7BA8) and states without branches in light grey (#B3B6B8). Small dots mark branches: dark navy for maintenance, orange for development and light green for shared. Dense clusters appear in California, Arizona, Texas, Florida and the Northeast corridor. A yellow star marks the headquarters near Pennsylvania. The legend to the right has a purple square, a yellow star, a navy dot, an orange dot and a green dot, each beside its label. A blue gradient banner (#0072CE at top fading to dark navy #004A8F at bottom) holds white bold text. A vertical dotted grey line separates the two lower columns. The BrightView logo has blue wordmark text with a green stylised tree/leaf mark.
Slide 4
BrightView – Much More Than Just Mowing
Maintenance
Mowing
Gardening
Mulching
Snow Services
Tree Care
Water Mgmt. / & Irrigation
Lake & Pond / Management
Landscape / Installation
Disaster / Recovery
Sports / Fields
Golf Course / Maintenance
Landscape / Design
Development
Design & Pre- / development
Landscape / Installation
Masonry + / Concrete
Hardscape / Installation
Irrigation / Systems
Pools & Water / Features
Soil Mixing / & Testing
Sports Field / Installation
BrightView
4
Visuals: White line-art icons above each label. Maintenance row 1: person on a riding mower; kneeling gardener planting a sprout; wheelbarrow of mulch; snow blower with spray; worker with chainsaw in a tree; sprinkler/irrigation head with water droplets. Row 2: lake with trees and reeds; potted plant with shovel and rake; house hit by a tornado with flood waves; sports stadium with field; golf flag on a green with trees; blueprint with triangle ruler and pencil. Development row: blueprint with set square and pencil; potted plant with shovel and rake; brick wall with trowel; cement mixer truck; sprinkler head; pool with water waves in a tiled frame; hand holding soil with sprouting plant; sports stadium. Left vertical strips are blue-to-dark-blue and teal-to-dark-teal gradient images. BrightView logo: blue wordmark with a green stylised leaf/tree mark.
Slide 5
BrightView’s Early Days…
Combined Two / Legacy / Companies / to Create a / National Presence
Initial Public / Offering
Not Growing / Profitability, / Limited Cash, / Stuck In Place
2014
2018
2019–2022
2023
2024
2025+
Focused on Revenue Growth, but not Profitable Growth
BrightView
5
Visuals: Six chevron arrows in a row, rotated about 14 degrees upward to the right. Each carries a white bold year label. Fills: 2014 dark teal #005559, 2018 teal #007177, 2019–2022 bright teal #00AD97, 2023 dark blue #00569B, 2024 blue #0072CE, 2025+ green gradient #8BC400 to #6AB43E. Three white chevron separators sit between the arrows. Three circular line icons with thin teal outlines: a handshake with radiating lines under 2014 (dark teal), a dollar sign with an upward trend arrow over stacked coins above 2018 (teal), and a dollar coin with three downward arrows under 2019–2022 (bright teal). A green gradient banner holds white bold text. The BrightView logo has blue wordmark text and a green stylised B tree mark.
Slide 6
…Led to These Financial Results
Revenue ($Ms)
+~$420M or / +18%
2,775
2,554
2,405
2,354
2018
2019
2021
2022
Adj. EBITDA ($Ms) / & EBITDA %
(~$12M) & / (240bps)
12.8%
12.7%
305
300
302
11.8%
288
10.4%
2018
2019
2021
2022
Adj. EBITDA %
Adjusted EBITDA
NOTE: FY20 excluded from above due to atypical results related to COVID pandemic
BrightView
6
Visuals: Left panel: bar chart of Revenue ($Ms) with four solid blue bars for 2018, 2019, 2021 and 2022. Printed values are 2,354, 2,405, 2,554 and 2,775. There is a grey baseline and no y-axis. An elliptical callout reading '+~$420M or +18%' sits on a grey bracket line that goes from above the 2018 bar across to an arrowhead pointing down at the 2,775 label. Right panel: combo chart of Adj. EBITDA ($Ms) and EBITDA % with four mustard-gold bars for 2018, 2019, 2021 and 2022. Printed bar values are 300, 305, 302 and 288. A green line runs across the bars with percentage labels 12.8%, 12.7%, 11.8% and 10.4%; the 11.8% and 10.4% labels have white backgrounds. The line starts near the top of 2018, stays roughly flat to 2019, then slopes down steeply to 2021 and 2022. The right axis (15.0 to 10.0) and left axis (380 to 250) are hidden by white fills, so no axis is visible. An elliptical callout reading '(~$12M) & (240bps)' sits on a grey bracket line going from the 2018 point to an arrowhead pointing down at the 288 bar. The legend below the chart has a green line swatch labelled 'Adj. EBITDA %' and a gold square labelled 'Adjusted EBITDA'. Each panel has a thin light grey border. The BrightView logo is blue wordmark text with a green stylised tree/leaf mark.
Slide 7
BrightView’s Refreshed Focus…
Increased
Employee &
Customer Focus,
While Delivering
Record EBITDA
Results
Not Growing
Profitability,
Limited Cash,
Stuck In Place
Combined Two
Legacy
Companies
to Create a
National Presence
Top-Line Growth
Fueling
Transformation
New Leadership,
One Rock
Partnership, New
Journey Begins
Initial Public
Offering
2014
2018
2019–2022
2023
2024
2025+
ONE BV
BrightView of the Past Will Not be the BrightView of the Future
BrightView
7
Visuals: Six chevron arrow segments tilted upward, left to right, in a gradient of colours: 2014 dark teal #005559, 2018 teal #007177, 2019–2022 bright teal-green #00AD97, 2023 dark blue #00569B, 2024 bright blue #0072CE, 2025+ green gradient (#8BC400 to #6AB82F) with an arrow tip. Each has a white bold year label rotated along the incline. Circular outline icons: (1) dark teal circle with a handshake and radiating lines, below the 2014 segment; (2) teal circle with a dollar sign, upward trend arrow and coin stacks, above 2018; (3) green-teal circle with a dollar coin and three downward arrows, below 2019–2022; (4) dark blue circle with a person figure above three stars, above 2023; (5) bright blue circle with 'ONE BV' text in blue and a small puzzle-like icon, below 2024; (6) lime green circle with a hand holding a rising bar chart with an arrow, above 2025+. Full-width green gradient banner (#8BC400 to #7DB92E) with white bold text. BrightView wordmark in blue with a green stylised leaf/tree mark at bottom left.
Slide 8
…Positions BrightView for Long Term Profitable Growth
Prioritizing our employees and a customer-centric focus producing momentum
Revenue ($Ms)
~Flat
2,816
2,767
2,795
2023
2024
2025*
Adj. EBITDA ($Ms)
& EBITDA %
+~$45M & / +170bps
299
325
345
10.6%
11.7%
12.3%
2023
2024
2025*
Adj. EBITDA %
Adjusted EBITDA
Midpoint of guidance as of February 2025 Earnings Call. Revenue reflects divested franchise business and unwinding of non-profitable subcontractor business
Includes the sale of USL and the elimination of BES
8
Visuals: Left panel: bar chart 'Revenue ($Ms)' with three blue bars for 2023 (2,816), 2024 (2,767) and 2025* (2,795), a grey baseline, no gridlines or y-axis. A grey bracket line runs from above the 2023 bar to an arrowhead above the 2025* bar, with an oval labelled '~Flat' on it. Right panel: bar chart 'Adj. EBITDA ($Ms) & EBITDA %' with three gold bars for 2023 (299), 2024 (325) and 2025* (345), with small tick marks under the value labels. A green line with white-backed labels connects 10.6% (2023), 11.7% (2024) and 12.3% (2025*) across the bars. A grey bracket with an oval labelled '+~$45M & +170bps' runs from above the 2023 bar to an arrowhead above the 2025* bar. The hidden secondary axis is white-covered (values 10.0–15.0 and 240–380). Legend at the bottom: green line 'Adj. EBITDA %' and gold square 'Adjusted EBITDA'. BrightView logo at bottom left: blue wordmark with a green stylised leaf/B mark.
Slide 9
Key Investment Highlights
Unifying BrightView
Market leader with size, scale and strategy to / compound competitive advantages
Prioritizing our employees to become employer and / service provider of choice
Sustainable business model with recurring revenue / and intense customer focus to gain wallet share
Multiple strategic initiatives including leveraging our / size and scale to drive profitable growth
Clear path to achieve long-term targets and drive / shareholder value
BrightView of the Past Will Not Be the BrightView of the Future
BrightView
9
Visuals: Blue gradient banner (darker at the bottom) across the width with centred white bold text. Five circular blue-outlined icons stacked vertically at the left: 1) award rosette with check mark; 2) three people figures above an upward zigzag arrow; 3) circular arrows forming a cycle; 4) three overlapping circles (Venn); 5) bar chart with rising dotted line and arrow. Right: a photograph in a thin grey border of an asphalt road curving into the distance through green trees and grass under a blue sky with large white clouds; white edge lines and painted white numbers 2026, 2025 and 2024 on the road, growing larger toward the viewer; the road is at the centre, with sunlight and saturated greens and blues. Green gradient banner (light green at the top to darker green at the bottom) with white bold text. BrightView logo: blue wordmark with a green stylised B mark at the right. Small green page number.
Slide 10
Opportunity Abounds in Large & Highly Fragmented Market
U.S. Market Structure
BrightView 2024 Revenue: $2.8B
~$130B
U.S. Commercial Landscaping,
Snow and Development
~$113B
U.S. Commercial
Landscaping and Snow
~$88B
U.S. Commercial
Landscaping Services
BrightView: ~$1.7B (Land only)
Market Share: ~2%
Development
~30%
~70%
Maintenance
Recurring Revenue
+
Scalable Business Model
+
Accretive M&A
=
Significant Shareholder Value Opportunity
Stable, non-discretionary & versatile nature of service
Resilient revenue from focus on industry’s Top Quartile
Overall market grows ~1-2% annually
#1 Player in a Growing Industry with Revenue 5x Our Next Largest Competitor
BrightView
Source: IBIS Industry Reports (April 2024), Landscaping and Snow Removal (May 2024)
10
Visuals: Left: three nested circles sharing a bottom tangent point: largest blue (~$130B), medium lime green (~$113B), smallest teal (~$88B), thin white outlines on inner circles. A small orange circle at the bottom of the teal circle marks BrightView's share. Between the columns is a soft blue-to-white gradient triangular arrow pointing right. Right: pie chart with ~70% blue Maintenance slice and ~30% lime green Development slice (top-left), white percentage labels inside. Vertical dotted grey divider line. Green gradient banner with white text. BrightView logo (blue wordmark with green stylised tree/B mark) bottom left.
Slide 11
Prioritizing Our Frontline Employees
Investments in Our Frontline Employees Have Yielded Significant Momentum in Turnover
Trucks
Mowers
Affordable Benefits
PTO
Boots
Service Hours
Flexible Schedules
HRIS*
Frontline Turnover Trend (TTM)
Turnover down ~20% over 5 quarters
Savings from Reduced Turnover Reinvested Back Into Frontline
Sep ’23
Dec ’23
Mar ’24
Jun ’24
Sep ’24
Dec ’24
*HRIS: Human Resources Information System
11
Visuals: Eight circular outline icons in a 4x2 grid. Green (#8BC400) circles with line-art icons: a pickup truck, a work boot, a person pushing a lawn mower, a clock with a person (service hours), a hand holding a dollar coin (affordable benefits), and a calendar with a schedule. Green filled circular checkmarks sit beside Trucks, Boots, Mowers, Service Hours, Affordable Benefits and Flexible Schedules. Two blue (#0072CE) circles show a calendar with a check (PTO) and a gear with a person (HRIS*), with no checkmarks. A dotted light-grey horizontal divider runs across the slide at about 49% height. Below it is a line chart with no y-axis: a blue line falls from about 67% height at Sep ’23 through about 69% at Dec ’23 and Mar ’24, about 71% at Jun ’24 and about 76% at Sep ’24 to about 79% at Dec ’24, above a thin grey x-axis line with six labelled months. A dark grey bracket line starts at a vertical tick above the Sep ’23 point and runs horizontally through a teal-blue gradient outlined ellipse reading 'Turnover down ~20% over 5 quarters', continuing to the green circle at right. A green gradient circle at right (#8BC400 to #4CAF50) holds white bold text, with a dark grey arrow pointing down from it to the Dec ’24 end of the line. The BrightView logo is blue text with a green stylised leaf mark at bottom left.
Slide 12
Driving Profitable Growth…
Profitable Growth
New Sales / Growth
Development / Growth
Development / Conversions
Ancillary / Offerings
National / Accounts
CUSTOMER RETENTION
BrightView
12
Visuals: Temple/pillar diagram. A dark grey triangular pediment with a vertical gradient (lighter grey #707275 at top to darker #48494C at bottom) holds the label 'Profitable Growth'. Five trapezoid pillars with capitals and bases, each with a vertical gradient and a white circular icon badge near the top. Pillar 1 is blue (#0072CE to #004282) with an icon of a dollar-sign coin with rays above three upward arrows. Pillar 2 is dark teal (#009AA0 to #004F55) with an icon of a checklist clipboard and two gears. Pillar 3 is turquoise-green (#00C9B0 to #009A8A) with an icon of two curved arrows, one pointing left and one right, forming an exchange loop. Pillar 4 is lime green (#8DC600 to #5F8A00) with an icon of a gear containing an exclamation mark above an open hand. Pillar 5 is pale green (#C4E28A to #A5D55A) with an icon of a US map with a hashtag and a group of three people above it. Capitals and bases are flat colour trapezoids in each pillar's colour, with darker thin strips. The base bar spans the pillars with a horizontal gradient from navy blue (#004282) through teal (#00A39A) and lime (#8DC600) to pale green (#C4E28A). The BrightView logo has blue wordmark text and a green stylised tree-like mark.
Slide 13
…by Operating as One BrightView
Early in the / Journey of / Transforming / BrightView
BECOMING / THE / EMPLOYER / OF CHOICE
CUSTOMER / CENTRIC / FOCUS
UNLOCKING / SIZE AND / SCALE
STRATEGIC / CAPITAL / ALLOCATION
INVESTMENT / OF CHOICE
13
Visuals: Left panel: pentagon/arrow-shaped block with a gradient from navy blue at top to teal at bottom, pointed edge on the right. Light grey (#F2F2F2) horizontal strip behind the circles. Five tall pale-tinted rounded-top cards, each with a coloured bar at the bottom and a 113px circular gradient badge with a white ring and white line icon. Card 1: teal circle, person with star on chest and sun rays. Card 2: blue circle, two people shaking hands with a star above. Card 3: dark teal circle, coin with dollar sign above a seesaw/scale with a hand. Card 4: light blue circle, donut/pie chart with a dollar sign at the centre. Card 5: green circle, hand holding a plant sprout with two dollar coins. Grey plus signs between circles 1-2, 2-3, 3-4 and a grey equals sign between 4 and 5. BrightView logo: blue wordmark with a green tree icon.
Slide 14
This is the Winning Formula…
Adjusted FCF Generation, Strategic Capital Allocations, Long-Term Shareholder Value
Employee Turnover
=
Customer Retention
Customer Retention
=
Growing Branches
Bigger Branches
=
More Profitable Branches
BrightView
14
Visuals: Left: a vertical pentagon/chevron-pointing-right shape with a gradient from dark blue at top to teal-green at bottom. Six white circles with blue outlines (about 3px, #0072CE), each holding a green gradient block arrow: row 1 left arrow points down, all other five point up. Three small circular badges with a dark blue to teal gradient, each with a white equals sign. Two light grey dotted horizontal lines between rows. BrightView logo at bottom left: blue wordmark with a green stylised tree/leaf mark.
Slide 15
2030 Aspirational Targets (from February ’25 Investor Day)
Clear path to / achieve long-term / targets and drive / shareholder value
~$4B*+
Total Revenue
~$650M+
Adjusted EBITDA
~16%+
Adjusted EBITDA / Margins
~40%+
Free Cash Flow / Conversion**
KEY INVESTMENT HIGHLIGHTS
Market leader with size, / scale and strategy to / compound competitive / advantages
Prioritizing our employees / to become employer and / service provide of choice
Sustainable business / model with recurring / revenue & intense / customer focus to gain / wallet share
Multiple strategic / initiatives including / leveraging our size and / scale to drive profitable / growth
BECOMING / THE / EMPLOYER / OF CHOICE
CUSTOMER / CENTRIC / FOCUS
UNLOCKING / SIZE AND / SCALE
STRATEGIC / CAPITAL / ALLOCATION
INVESTMENT / OF CHOICE
BrightView
*~$450M+ in M&A
** Free Cash Flow Conversion = Adjusted Free Cash Flow / EBITDA $
15
Visuals: Green target icon with a dart at top right, drawn as concentric lime-green spiral rings with an arrow pointing in from the left. Rendering of a modern pale stone museum tower with trees, a plaza and people walking, soft overcast light, boxed at left. Four green gradient tiles with white text. Blue highlights panel with short white dividers above each of the four highlights. Light grey band behind the bottom icon row. Five circular icons, each with a tinted label card and a coloured bar at the bottom: teal circle with a person and star, navy circle with two people shaking hands and a star, dark teal circle with a scale and a hand holding a dollar coin, light blue circle with a segmented dollar-sign wheel, green circle with a hand holding a plant with dollar coins. Grey plus signs sit between the circles and a grey equals sign follows the fourth. BrightView logo with a green sprout mark.
Slide 16
Appendix
16
Visuals: Photograph of a man riding a red Exmark Lazer zero-turn lawn mower down a grassy slope, seen from the front at a low angle. He wears a tan bucket hat with yellow ear defenders, a hi-vis yellow-green safety vest with grey reflective stripes over a blue polo, yellow-green gloves, blue trousers and brown work boots. Grass clippings fly at the left. Behind him are dense green trees and a pale overcast sky; the light is soft and natural. Dominant colours are green, red, and yellow-green. The photo is cropped to the left ~80% of the slide. A white diagonal panel runs from the top at about x 79% to the bottom at about x 48%, preceded by two semi-transparent white diagonal bands (35% and 60% opacity) that fade the photo into the white. A short solid green horizontal bar sits above the title.
Slide 17
FY25 Guidance (from November ’24 earnings call)
Total Revenue
$2.750B to $2.840B
Adjusted EBITDA
$335M to $355M
Adj. Free Cash Flow
$40M to $60M
Ex. Capex timing1
~$90M to ~$110M
Assumptions for Revenue & EBITDA Margins
Assumptions
Maintenance Land Revenue1
+1% to +3% excl. Non-Core
Snow Revenue2
$160M - $200M
Development Revenue
~+3% to +6%
Maintenance EBITDA Margin
12.6% to 13.0%
Margin expansion of ~+60 to +100 bps
Development EBITDA Margin
11.0% to 11.2%
Margin expansion of ~+10 to +30 bps
1) Non-Core impact ($28M) in 1H25 from BES/USL
2) Snow includes unwind of BES business ($33M)
Assumptions
Net Capex: $140M to $160M1
Cash Interest: $55M to $60M
Cash Taxes expense: $35M - $40M
FY24 benefits of ~$20M not expected to occur in FY25
1) Net capital expenditures includes proceeds from sale of property & equipment. ~$51M in accrued property & equipment in FY24 that will be a “use of cash” in FY25, (“capex timing”)
BrightView
17
Visuals: Two pale yellow (#FFFFCC) block arrows with dark navy outlines point right, one at the upper group and one at the lower group. Four rounded rectangles with navy outlines hold the values. The upper assumptions table has a grey outline and a thin horizontal divider between revenue rows and margin rows. The lower assumptions table has a grey outline. BrightView logo: blue wordmark with a green stylised tree/B mark.
Slide 18
Leadership
Inspiring & Unifying ~20,000 Employees to Operate as One BrightView
DALE ASPLUND
Chief Executive Officer
BRETT URBAN
Chief Financial Officer
MANDY ORDERS
Chief Human
Resources Officer
MICHAEL DOZIER
Chief Commercial Officer
JONATHAN GOTTSEGEN
Chief Legal Officer &
Corporate Secretary
Sales and Operations Leadership
Average
Operations
Tenure
~22 years
Vince Germann
Growth Operations
Dan Harper
Northwest Region
Todd Chesnut
Southeast Region
Enrico Marogna
Southern California Region
Jessica Durbin
Southwest Region
Darren McDonough
South Florida Region
Judd Strohmeyer
Midwest Region
Ray Nobile
Northeast Region
18
Visuals: Five circular headshot photos with teal-to-blue ring borders against light grey studio backdrops: a smiling grey-haired man with glasses in a navy blazer; a dark-haired man in a navy suit and light blue shirt; a blonde woman with long wavy hair in black; a man with swept-back hair in a navy blazer and patterned blue shirt; a grey-haired man in a dark jacket and striped shirt. A horizontal grey dotted line separates the sections. A green gradient circle, light green at top to darker green at bottom, holds white bold text. BrightView logo with blue wordmark and a green stylized B mark at bottom left.
Slide 19
Our People are Our Differentiator
Building a Strong, Dedicated & Unified One BrightView
~20,000 Total / Employees
Reduced Seasonal / Hiring Needs Due / to Improvement in / Frontline Turnover
Tenured Frontline / Crew Leader: ~8 Yrs. / Crew: ~4 Yrs.
Competitive Wages / with Reliable Work / Schedules
BrightView is the Only National Landscaping Company Utilizing the
E-Verify Standard Enterprise-wide
BrightView
19
Visuals: Centre photo of about 20 BrightView crew members in hi-vis yellow-green vests and blue shirts, standing in a wide arc and stretching sideways in a gravel lot. White BrightView pickup trucks and trailers are parked behind them, with tall green trees under a hazy sky. The light is warm. A thin grey border frames the photo. A white banner overlaid at top centre shows a faint American flag background and the blue and red E-Verify logo with a small flag icon. Four teal boxes with a vertical gradient from bright teal to darker green-teal. A green banner with a gradient from lime to darker green. A short lime green rule under the title. The BrightView logo is blue wordmark with a green stylised leaf/B glyph.
Slide 20
Putting the Customer at the Center of what we do
Scale and / Technology / Advantages
Go-to-Market / Strategy
CUSTOMER CENTRIC FOCUS
Capturing / Share of Wallet
Revenue / Growth Drivers
20
Visuals: Center ring made of four curved light-grey gradient arrow segments (#F2F2F2 to #D6D6D6) with white gaps between them. Blue triangle arrowheads (#0072CE) point right at top, down at right, left at bottom and up at left, so the flow runs clockwise. Inside the ring is a blue gradient circle (#0072BC to #00448A) with a thin white inner outline ring. It holds a white line icon of two people shaking hands with a star above them. Grey curved text 'CUSTOMER CENTRIC FOCUS' runs along the inner lower arc of the ring. Four blue line icons: top-left, devices (monitor, tablet and phone with expand arrows); top-right, a rocket launching; bottom-left, two hands around a target; bottom-right, a person with a magnifier beside a rising bar chart with a dollar coin. Each icon has a solid blue bar beneath it. Dotted grey horizontal lines end in grey dots on the ring, at about y 33% (top pair) and y 73% (bottom pair). The BrightView logo is blue text with a green stylised tree/B mark.
Slide 21
How We’ll Win Moving Forward: Growing Profitably
1
Improved Customer / Retention
Intense customer focus and proactive service delivery to reduce turnover
2
New Maintenance / Sales
Invest in sellers and give them meaningful tools to sell profitable land business
3
New Development / Sales
Continue to build backlog as foundation for future growth
4
Development / Conversions
Convert existing Development clients into annual recurring revenue
5
Ancillary Offerings
Strengthen relationships to earn incremental discretionary spend
6
Strategic National / Accounts
Unlock the untapped opportunity of servicing national players
Long-Term Growth Opportunity: ~3%–6%+
BrightView
21
Visuals: Six leaf icons, each a teal-to-navy gradient leaf shape with a white number (1-6) on it and a curved vein line. Six light grey right-pointing triangles beside the descriptions. Six thin vertical grey divider lines between headings and descriptions. Five horizontal dotted grey separator lines between rows. A green gradient banner from light lime at top to darker green at bottom. BrightView logo in blue text with a green stylised leaf/tree mark at bottom left.
Slide 22
Opportunities Abound within Customer Retention
~85%
~84%
~83%
~83%
~80%
~79%
~81%
90%+
ONE BV
First Year of / Improvement / Since IPO
2018
2019
2020
2021
2022
2023
2024
BV Best in-Class
Drivers of Success
Quality of Service
Prioritizing our employees so / they are enabled to provide / superior customer service
Communication
Proactively responding to customers’ / shifting priorities with reliable service / delivery enabled by communication and / BrightView Connect
Leverage AI for / Predictive Analytics
Investing in technology to / target at-risk customers / before they terminate
BrightView
22
Visuals: Line chart of customer retention by year, 2018 to 2024 plus a 'BV Best in-Class' target. A thin blue line connects circular blue markers with white bold labels: 2018 ~85%, 2019 ~84%, 2020 ~83%, 2021 ~83%, 2022 ~80%, 2023 ~79%. The 2024 marker is teal and labelled ~81%. From it a blue line rises steeply to a green scalloped starburst badge labelled 90%+ at the BV Best in-Class position. A large blue circle with the 'ONE BV' logo (ONE in lime green with a small multicolour puzzle icon, BV in large white bold letters) sits above 2023-2024, connected by a vertical grey dotted line down to the line. Teal text 'First Year of Improvement Since IPO' sits under the 2024 marker. A grey horizontal axis line sits above the year labels. Below, a green gradient banner (lighter lime at top to darker green at bottom) reads 'Drivers of Success'. Three blue line icons: a medal/award ribbon with a star next to Quality of Service; two speech bubbles with arrows next to Communication; a head-profile brain with circuit nodes next to Leverage AI. Two vertical grey dotted dividers separate the columns. The BrightView logo is blue bold text with a green stylised B-shaped mark.
Slide 23
Employee Turnover Remains Key Catalyst to Drive
Customer Retention
Customer Retention % by Turnover Quartile
~600bps
Difference
78%
84%
4th Quartile
3rd Quartile
2nd Quartile
1st Quartile
Customer Retention
Frontline Turnover*
*Excludes involuntary turnover
BrightView
23
Visuals: Combination chart titled 'Customer Retention % by Turnover Quartile'. The x-axis has four categories: 4th Quartile, 3rd Quartile, 2nd Quartile, 1st Quartile, with a thin grey baseline. The blue columns show Frontline Turnover* and have no printed values, with heights decreasing from left to right: about 4th Quartile 55% of plot height, 3rd about 37%, 2nd about 23%, 1st about 13%. An orange line with round markers shows Customer Retention on a secondary axis (about 70 to 85, no axis labels visible); labelled points are 78% (4th Quartile, white bold label inside the blue column) and 84% (1st Quartile, grey bold label under the marker); the middle points are about 81 (3rd Quartile) and about 82 (2nd Quartile). A dark grey bracket line runs from the 78% marker up and across to the circular callout, then from the callout across and down with an arrowhead to the 84% marker. The callout is a white circle with a thick gradient ring going from dark navy at the top to teal-green at the bottom. The circle contains '~600bps Difference' in dark blue. The legend has an orange line with a marker labelled Customer Retention and a blue square labelled Frontline Turnover*. A short lime-green horizontal bar sits under the title. The BrightView logo has blue wordmark text and a green stylised tree icon.
Slide 24
Retention Accelerates Profitable Top-Line Growth
Customer Retention is the Primary Catalyst That Fuels Profitable Top-line Growth
Branch Segmentation*
Branches with Higher Retention Have Higher Contract Growth
~+9%
~+6%
~20%
~20%
~20%
~(4%)
~40%
~(8%)
< 70%
70% - 80%
80% - 90%
90+%
*Based on 2024 results and number of Maintenance branches (~180)
24
Visuals: Left: donut chart 'Branch Segmentation*' with four segments clockwise from 12 o'clock: dark blue (#0072CE) about 20% labelled ~20%, light blue (#85C9FF) 20% labelled ~20%, pale green (#B8D97D) 40% labelled ~40%, bright green (#8BC400) 20% labelled ~20%. Labels are white bold. The hole is white. Right: column chart with four bars on a thin grey zero baseline. The bars are dark blue, which goes down to ~(8%); light blue, down to ~(4%); pale green (#C2E189), up to ~+6%; bright green, up to ~+9%. Value labels are grey bold: ~(8%) and ~(4%) sit below the negative bars, ~+6% and ~+9% sit above the positive bars. A grey dashed trend arrow rises from the lower left (inside the first bar) to the upper right, ending with an arrowhead above the last bar. A legend below has square markers: dark blue '< 70%', light blue '70% - 80%', pale green '80% - 90%', bright green '90+%'. The word 'Contract' in the right heading is underlined. A short bright green horizontal rule sits under the title. The BrightView logo at bottom left has blue wordmark text and a green stylised leaf/tree mark.
Slide 25
A Go-to-Market Strategy Designed to Deliver
Legacy Sales Strategy
Current Sales Strategy
Reporting Structure
Sales and Ops siloed
Sales and Ops aligned
Selling Incentives
Sub-optimal alignment
Focused on profitable growth/retention
Tools
Less technology-based
Route Density / BV Connect
Environmental Opportunities
No central strategy
Helping customers create and maintain sustainable landscapes
Non-accretive New Business
Profitable Growth
Reinvesting Portion of G&A Savings Into Sales Organization
BrightView
25
Visuals: Large hexagonal chevron shape, left half light grey (#F2F2F2) with grey outline fading to white toward the centre, right half fading from white to light blue (#BFE3FF) with a light blue (#99CCFF) outline and pointed right edge. Light grey plus signs between the left rows and light blue plus signs between the right rows; equals signs above the bottom results (grey left, light blue right). Three horizontal dotted grey divider lines across the centre. Four green line icons: org chart of three/four people in circles (Reporting Structure); dollar-sign coin with rays above three up arrows (Selling Incentives); gear with a wrench (Tools); circle with a plant/leaf in the centre connected by spokes to small circles (Environmental Opportunities). Green gradient bar (light green #8CC63F at top to darker green #5AAE3D at bottom) with white text. BrightView logo: blue wordmark with a green stylised tree/leaf mark.
Slide 26
Equipping Our Sellers with Tools to Drive Route Density
Route Density Tool Enables Teams to Target New Customers Along Existing Routes
= Profitable Growth
Branch
Existing Customer
Vetted Target
Unvetted Target
26
Visuals: Left: a rectangular photograph of a person seen from behind, in dark clothing, looking at a desktop monitor. The background is blurred. The monitor shows a Power BI style dashboard, with a blue top toolbar (Export, Chat in Teams, Get insights, Set alert, Copilot), filter row, KPI tiles (20.3K, $1.7bn, 3K, $1.7bn, 20.3K, $1.7bn, 9.6%), a US map covered in dots in green, magenta, blue and dark green, and a data table on the right. Colourful sticky notes lie at the bottom right of the desk. A small green circle on the US map's west coast links to a long green horizontal arrow pointing right to a circular zoom. The circle is a satellite map of San Pablo Bay with a green outline. It has coloured dots in magenta, blue and lime green, a large green ellipse, a red line with a blue label '~25 miles', and the water label 'San Pablo Bay'. Right: four legend circles with labels, in dark green (Branch), lime green (Existing Customer), blue (Vetted Target) and magenta (Unvetted Target). The BrightView logo is bottom left, in blue text with a green stylised leaf mark.
Slide 27
Development Business as a Catalyst for Growth
Development Business Leads Growth Charge; Remains Stable Foundation for Future / Maintenance Growth
Development Services Snapshot
#1
Nationwide Landscape/Irrigation Installation Provider
30
Branches
1,000+
Active Jobs
~$1M
Average Job Size
~90%
“Satisfied” and “Highly Satisfied” Customers
2,500+
Team Members Nationwide
Development Backlog
($MS)
Revenue
($MS)
$1,200
+5.3%
CAGR
$880
10/1/2024
2030
$1,050
+5.2%
CAGR
$809
$758
$699
2022
2023
2024
2030
BrightView
27
Visuals: Left: six-row table with a blue heading rule, light green-tinted first column (#1, 30, 1,000+, ~$1M, ~90%, 2,500+) and grey horizontal row dividers. Under the table are three photos side by side: an aerial view of a circular modern campus building with green lawn and trees; a landscaped garden with a stone lantern, stepped stone wall, lily pond, grasses and trees; a dusk playground scene with a curved wooden lattice canopy structure, lit in purple and red, and children playing. Middle bar chart 'Development Backlog ($MS)': blue bar $880 at 10/1/2024, a very thin green line at the middle position, green bar $1,200 at 2030. Grey arrow rises from lower left to the $1,200 bar, with a white circle outlined in blue holding '+5.3% CAGR'. Right bar chart 'Revenue ($MS)': blue bars $699 (2022), $758 (2023), $809 (2024) and a green bar $1,050 (2030). Grey arrow rising to the upper right with a blue-outlined white circle '+5.2% CAGR'. Thin grey baseline under each chart. Vertical dotted grey separators at about x 49% and x 73%. BrightView wordmark logo in blue with a green stylized leaf mark.
Slide 28
Key Untapped Opportunity in Development Conversions
Opportunity
Notable Wins
CUSTOMER A
CUSTOMER B
$1
Development Job
~$.07
Recurring Maintenance Contract
Development Job
~$4M
~$1.6M
Annual Maintenance
$250K
$200K
70% Conversion Rate implies ~$50M Future Opportunity in Annual Maintenance Revenue
~70%
<10%
2023
2024
2025
Future
Development Conversion $
Conversion %
BrightView
28
Visuals: Two blue gradient header bars (dark-to-light blue, darker at the bottom) with white bold text. A vertical gray dotted divider between the two top panels and a horizontal gray dotted line across the slide at about y 47%. Combo chart: four blue columns (2023, 2024, 2025, Future) rising from very small to very tall, about 3%, 5%, 6% and 29% of slide height, with a green line overlay running from the 2023 bar top, through the 2024 and 2025 bars, then rising steeply to the top of the Future bar. Data labels: '<10%' above the 2023 bar and '~70%' above the Future bar. Gray baseline axis, no gridlines or y-axis. Legend at right: blue square 'Development Conversion $', green line 'Conversion %'. BrightView logo at bottom-left: blue wordmark with a green stylised 'b' mark.
Slide 29
Capturing Share of Wallet
Higher Retention = Better Relationships = Better Share of Wallet
Average Ancillary Penetration*
% by Customer Tenure
~62%
~55%
~40%
~25%
< 1 Year
1 - 3 Years
3 - 5 Years
5+ Years
Moving Each Customer Up One Tranche Represents ~$75M in Annual Revenue
BrightView
*Average Ancillary Penetration Definition: Discretionary spend as a % of contract value
*Based on 2024 end of year customer composition
29
Visuals: Vertical bar chart with four bars on a thin grey baseline and no y-axis or gridlines. Chart title: 'Average Ancillary Penetration*' with the subtitle '% by Customer Tenure'. Bars (left to right): '< 1 Year' dark blue #0072CE, labelled ~25%; '1 - 3 Years' light blue #85C9FF, ~40%; '3 - 5 Years' light green #B8D97D, ~55%; '5+ Years' bright green #8BC400, ~62%. Bars are equal width with equal gaps, rising in height. A grey dashed arrow rises from above the first bar to the upper right above the last bar, ending in an arrowhead at about x 79%, y 35%. A short green horizontal bar (#8BC400) sits under the title. A full-width banner has a vertical gradient from light green at the top to darker green at the bottom, with white bold text. The BrightView logo is blue wordmark text with a green stylised plant or tree mark.
Slide 30
National Accounts: A Significant Strategic Growth Opportunity
Tech Enablement
Measure Progress
Single Point of Contact
Key
Accounts
Aligned Partnership
Targeted Accounts
Leveraging our Self-Perform National Branch Network
BrightView
30
Visuals: Lightbulb diagram: a light grey (#F2F2F2) bulb with a grey circular ring at its centre holding the text 'Key Accounts'. The bulb has a trapezoid neck and a base of two rounded bars with a blue-teal-green-magenta-orange horizontal gradient. A thick segmented ring arc surrounds the top of the bulb in five colours: bottom-left blue, left dark teal, top teal-green, right magenta, bottom-right orange. Five solid circles connect to the ring by short stubs. Top circle, teal-green (#00AD97), white line icon of a gear with circuit nodes, labelled Tech Enablement. Upper-right circle, magenta (#C800A1), white line icon of a person climbing steps and holding a flag, labelled Single Point of Contact. Lower-right circle, orange (#FF9E1B), white line icon of a handshake over connected nodes, labelled Targeted Accounts. Upper-left circle, dark teal (#007177), white line icon of a location pin with chevrons, labelled Measure Progress. Lower-left circle, blue (#0072CE), white line icon of a target with an arrow, labelled Aligned Partnership. A green gradient banner spans the width above the footer. The BrightView logo has a blue wordmark and a lime-green stylised tree mark.
Slide 31
Capital Allocation and Long-Term Value Creation
Maximize / Shareholder / Return
Core Business / Foundation / (Fleet & Technology)
STRATEGIC CAPITAL ALLOCATION
Accretive / Mergers & / Acquisitions
Revenue / Growth / Acceleration
BrightView
31
Visuals: Central circular ring made of four light-grey gradient arc arrows (about #F0F0F0 to #D6D6D6) with white gaps between them, each with a light-blue triangular arrowhead (about #5BB8E8) running clockwise: top-left arrow pointing right at top, right arc pointing down, bottom arc pointing left, left arc pointing up. Inside the ring is a blue gradient circle (#7DCBEA to #2FA9DE) with white outline rings and a doughnut-chart pictogram with segments and a white $ in the centre. Curved blue text 'STRATEGIC CAPITAL ALLOCATION' follows the lower inside of the ring. Four light-blue (#6EC6EC) line icons: top-left a plant growing from a pot with a dollar coin as the flower; top-right a brick wall with a trowel; bottom-left a handshake; bottom-right a map pin with ripples. Each icon has a light-blue horizontal bar beneath it (above it for the bottom icons' labels). Grey dotted horizontal lines with grey dot ends connect the labels to the ring at about y 33% and y 73%. BrightView logo bottom-left: blue wordmark with a green stylised tree/B mark.
Slide 32
Fortified Balance Sheet
Robust Adjusted Free Cash Flow Coupled with Lower Debt and Leverage Provides
Significant Opportunity for Additional Value Creation
Adjusted Free Cash Flow
Net Debt / Leverage Ratio
$106
$87
$97
$7
$80
$145
2018
2019
2021
2022
2023
2024
Adjusted Free Cash Flow
3.8x
3.7x
3.5x
4.8x
2.9x
2.3x
$1,149
$1,131
$1,056
$1,375
$871
$737
2018
2019
2021
2022
2023
2024
Leverage Ratio
Net Debt
BrightView
32
Visuals: Left: blue column chart 'Adjusted Free Cash Flow' with six columns (2018 $106, 2019 $87, 2021 $97, 2022 $7, 2023 $80, 2024 $145), white value labels inside the columns, a thin grey baseline, no gridlines, no visible y-axis, category labels under the columns and a blue square legend key 'Adjusted Free Cash Flow'. Right: teal combo chart with six teal columns of Net Debt in $ millions (2018 $1,149, 2019 $1,131, 2021 $1,056, 2022 $1,375, 2023 $871, 2024 $737) and an orange line for Leverage Ratio. The ratio values are 3.8x, 3.7x, 3.5x, 4.8x, 2.9x and 2.3x, printed in bold grey above the columns. The secondary axis runs 0.0 to 5.5 and the primary axis 0 to 1,500, with both sets of axis labels hidden in white text. The legend below shows an orange line 'Leverage Ratio' and a teal square 'Net Debt'. A short lime-green horizontal bar sits under the title. The BrightView logo has blue wordmark text and a lime-green stylised 'b' plant mark. A vertical dotted grey divider separates the panels.
Slides 33 to 45 continue in the full text file.
Download this deck
The hosted PDF of every library deck is free for readers of the SlideDeck Co newsletter. Join with your email and the viewer and download appear here.
Preparing a results presentation or business update of your own? The SlideDeck Co Standard Deck is a slide library for business reviews, updates and plans.







